Headlines
|
|
Despite exuberance, continued signs of long-term recovery:
Signs of excessively optimistic sentiment abound, but internally markets have been very healthy so far. Fewer than 20% of countries are now in correction territory, and a majority of securities on the NYSE have been in uptrends for months. That's the kind of activity normally seen near the beginnings of long-term recoveries.
Oddities, again: We've been noting consistently that recent gains in the indexes have been notable because they've been accompanied by excellent participation, showing the kinds of thrusts we often see near the beginning of a long-term uptrend (see today's report for more). The biggest worry, given the euphoric state of sentiment, will be when these conditions start to deteriorate. So far, there were only a few isolated days in December, and not enough to drag on the overall environment.Thanks to weakness in small-caps again, though, internal numbers were weak again on Thursday. Both the S&P 500 and Nasdaq Composite rose to records but with abnormally few advancing stocks. It's too early to be excessively worried about this, but it's exactly the kind of thing that will start to drag on the other measures we follow and will start to trigger more important warning signs.
Bottom Line:
The market environment is pristine, with only sporadic signs of internal deterioration, but with near-historic optimism, gains tend to be muted, with a high probability of being reversed at some point over the ensuing weeks. | Other Sectors and Assets |
| | Positives | Negatives | | 1. Energy (here, here, and here) | 1. Skewed tech (here and here) |
|
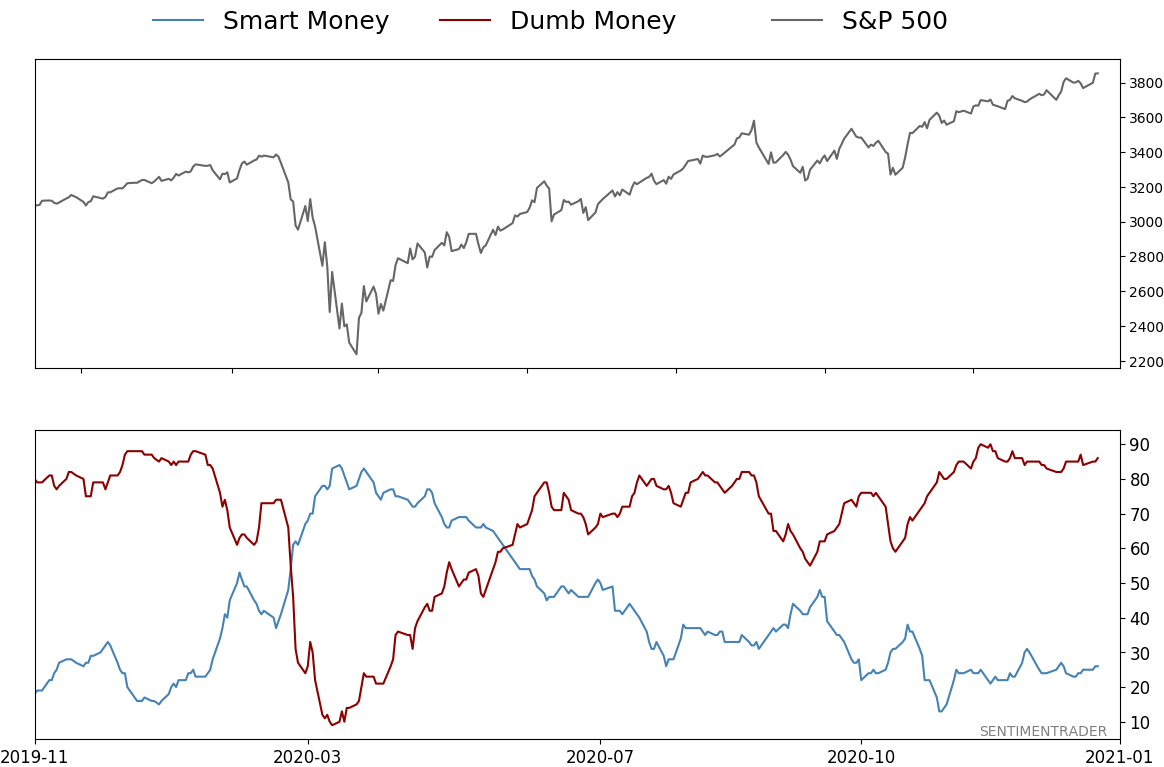
Smart / Dumb Money Confidence
|
Smart Money Confidence: 26%
Dumb Money Confidence: 86%
|
|
Risk Levels
Stocks Short-Term
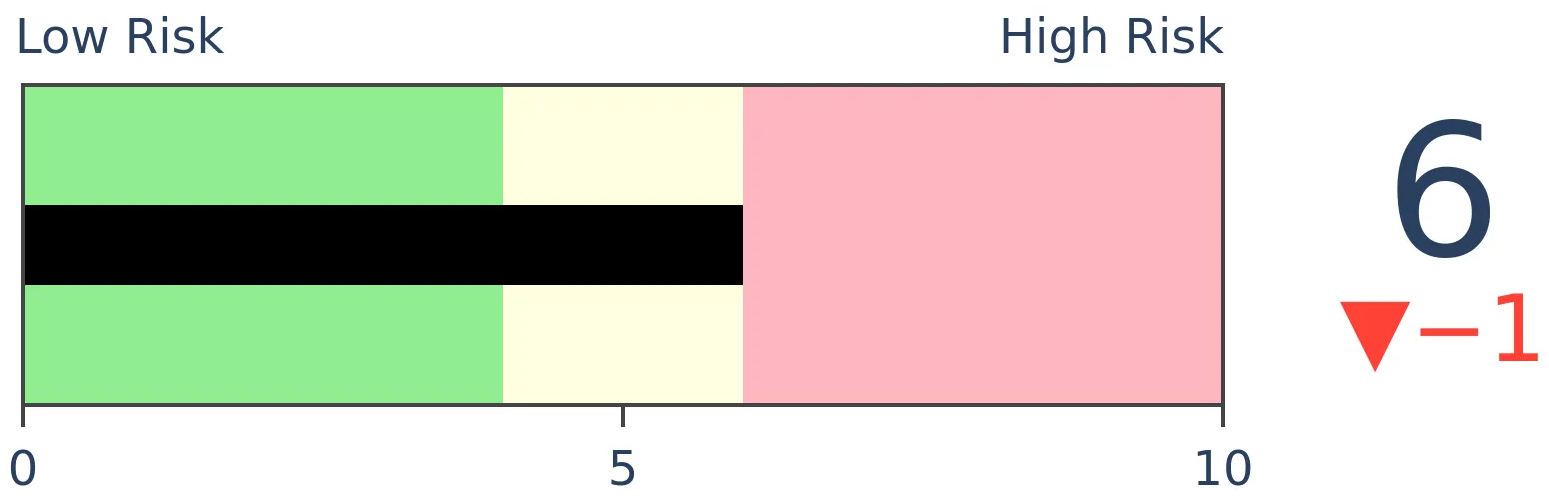
|
Stocks Medium-Term
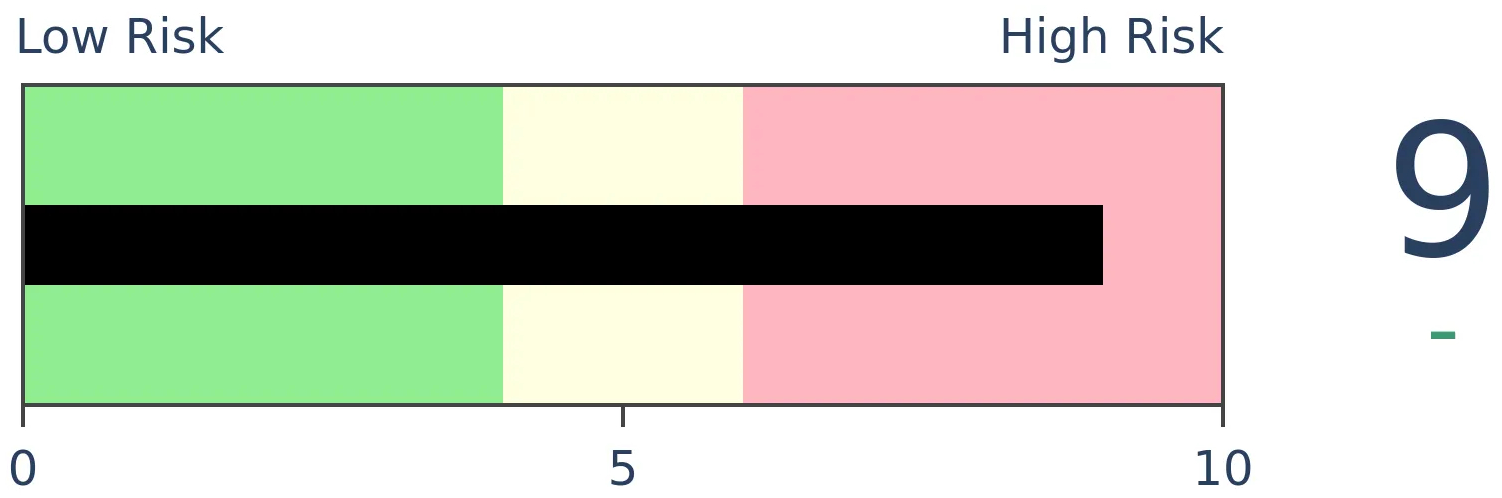
|
|
Bonds
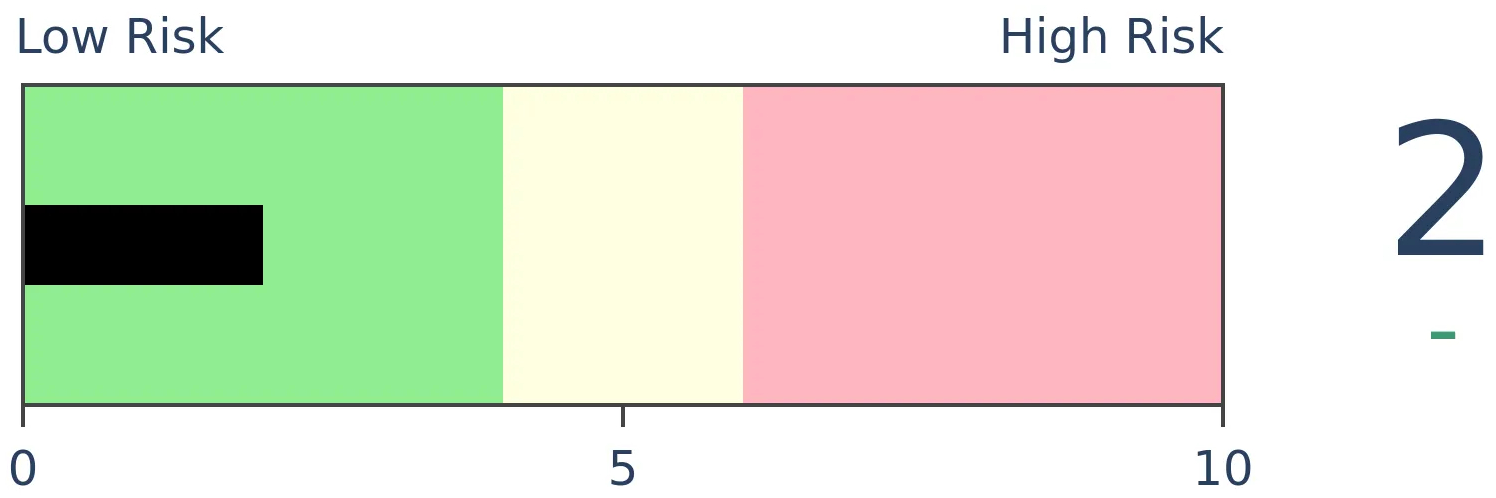
|
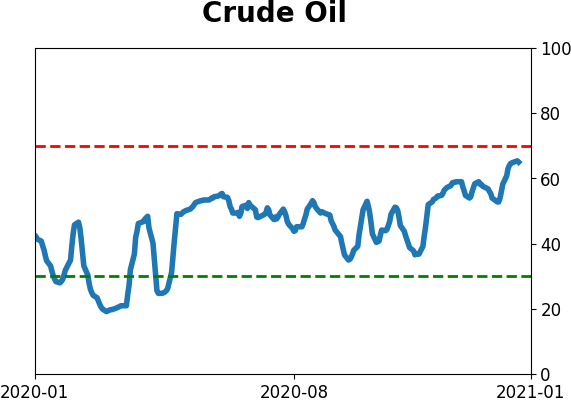
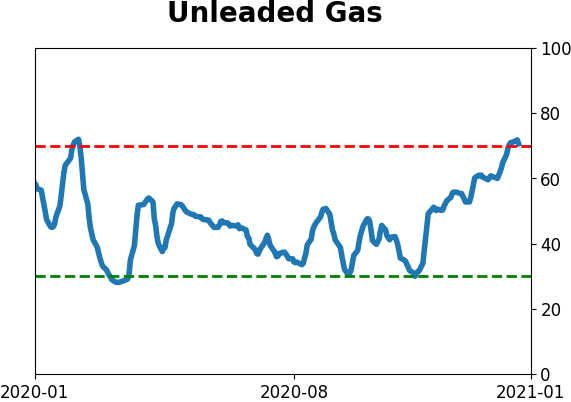
Crude Oil

|
|
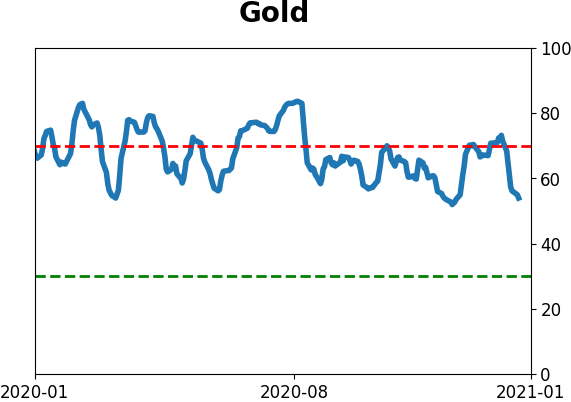
Gold

|
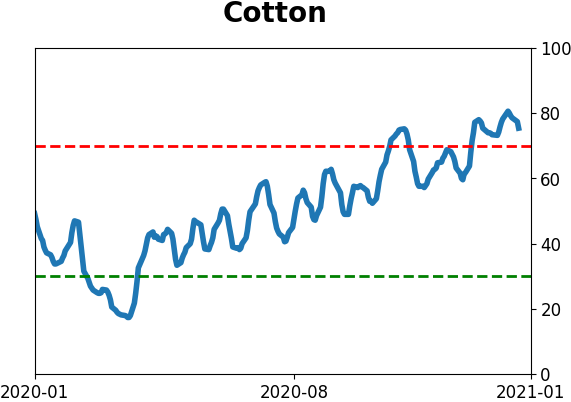
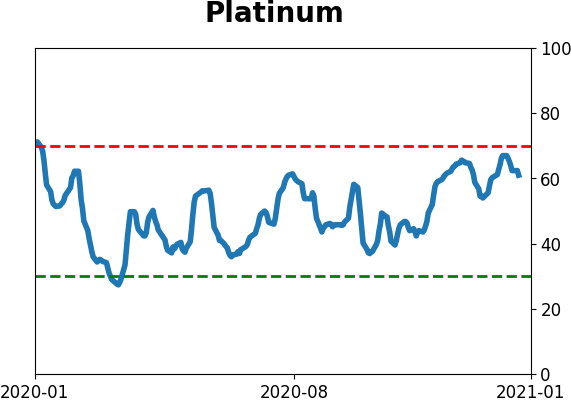
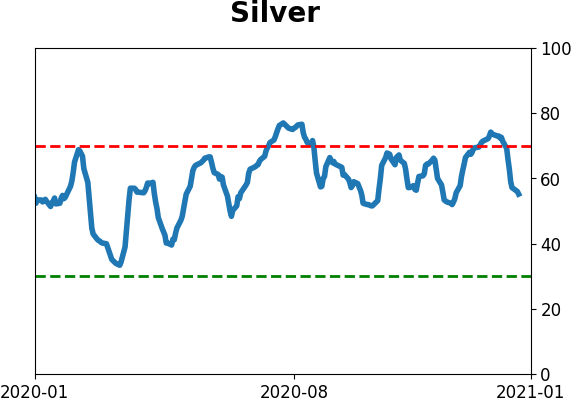
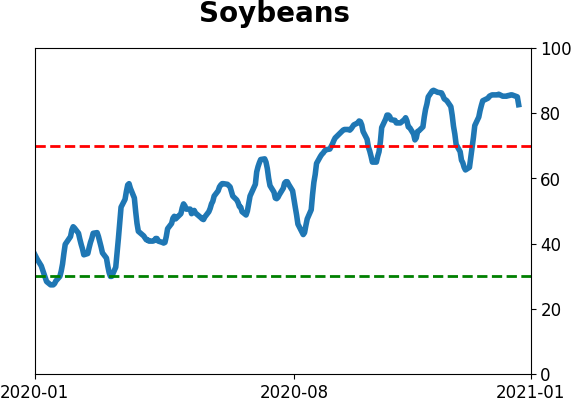
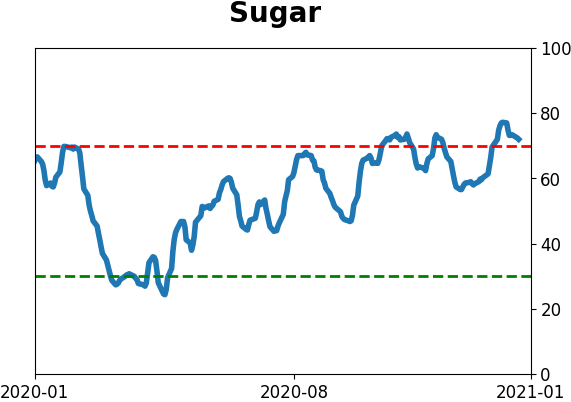
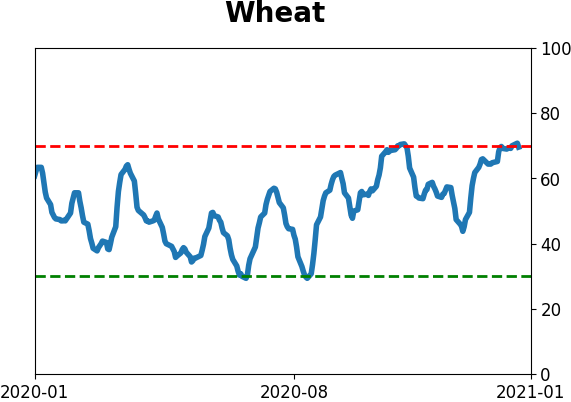
Agriculture

|
|
Research
BOTTOM LINE
Signs of excessively optimistic sentiment abound, but internally markets have been very healthy so far. Fewer than 20% of countries are now in correction territory, and a majority of securities on the NYSE have been in uptrends for months. That's the kind of activity normally seen near the beginnings of long-term recoveries.
FORECAST / TIMEFRAME
SPY -- Up, Long-Term
|
The biggest challenge with this market, one we haven't really ever had to deal with before, is the conflict between an impressive recovery from a historic selloff, superimposed against a backdrop of record levels of speculative activity.
Recoveries from a bear market typically take much longer. By the time they've recovered and been at new highs for a while, speculation comes in, markets plateau, divergences form, and sentiment cycles back down during a correction.
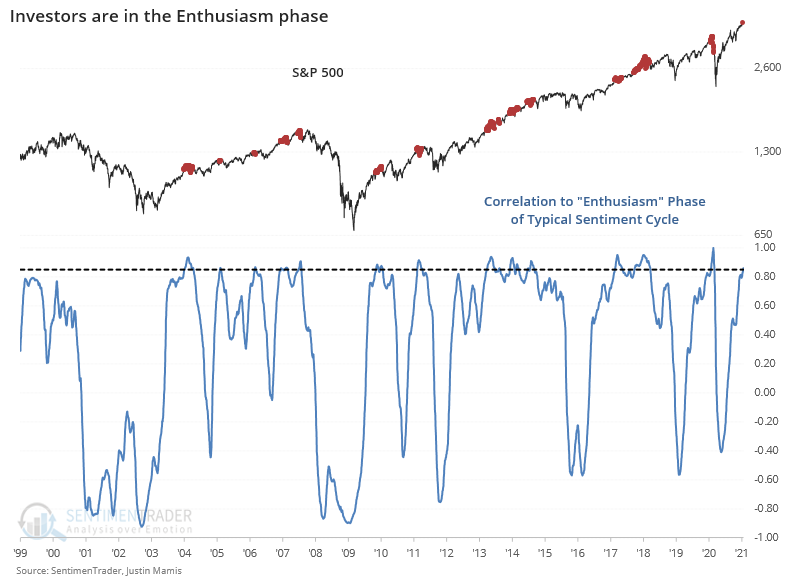
If we look at a typical Sentiment Cycle, then we basically went from enthusiasm to panic and right back to enthusiasm, all in record time.
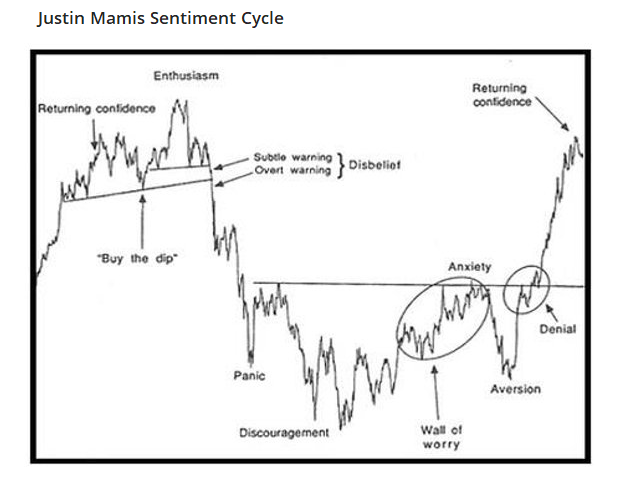
There is little arguing that we're in this part of the cycle. As the Knowledge Base article, "How do I use sentiment?" points out, this part of the cycle is identified by:
- High optimism - CHECK
- Easy credit (too easy, with loose terms) - CHECK
- A rush of initial and secondary offerings - CHECK
- Risky stocks outperforming - CHECK
- Stretched valuations - CHECK
All boxes are checked there. More objectively, when we look at the correlation between the S&P 500's price path lately versus the Enthusiasm phase of past cycles, there is a high positive correlation.
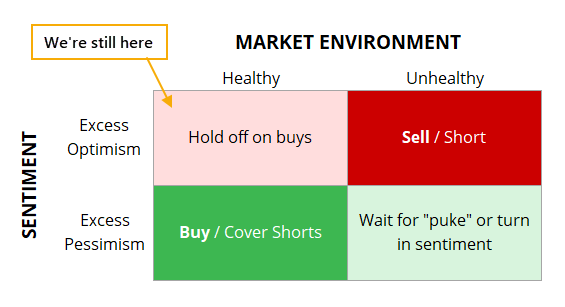
So, investor behavior is like we see near the end, but markets are showing the signs we typically see during the beginning stages of a long-term recovery with thrusts in breadth and the percentage of securities hitting 52-week highs. It's very strange, so we're still in the upper left-hand box of the Sentiment vs Market Environment matrix.
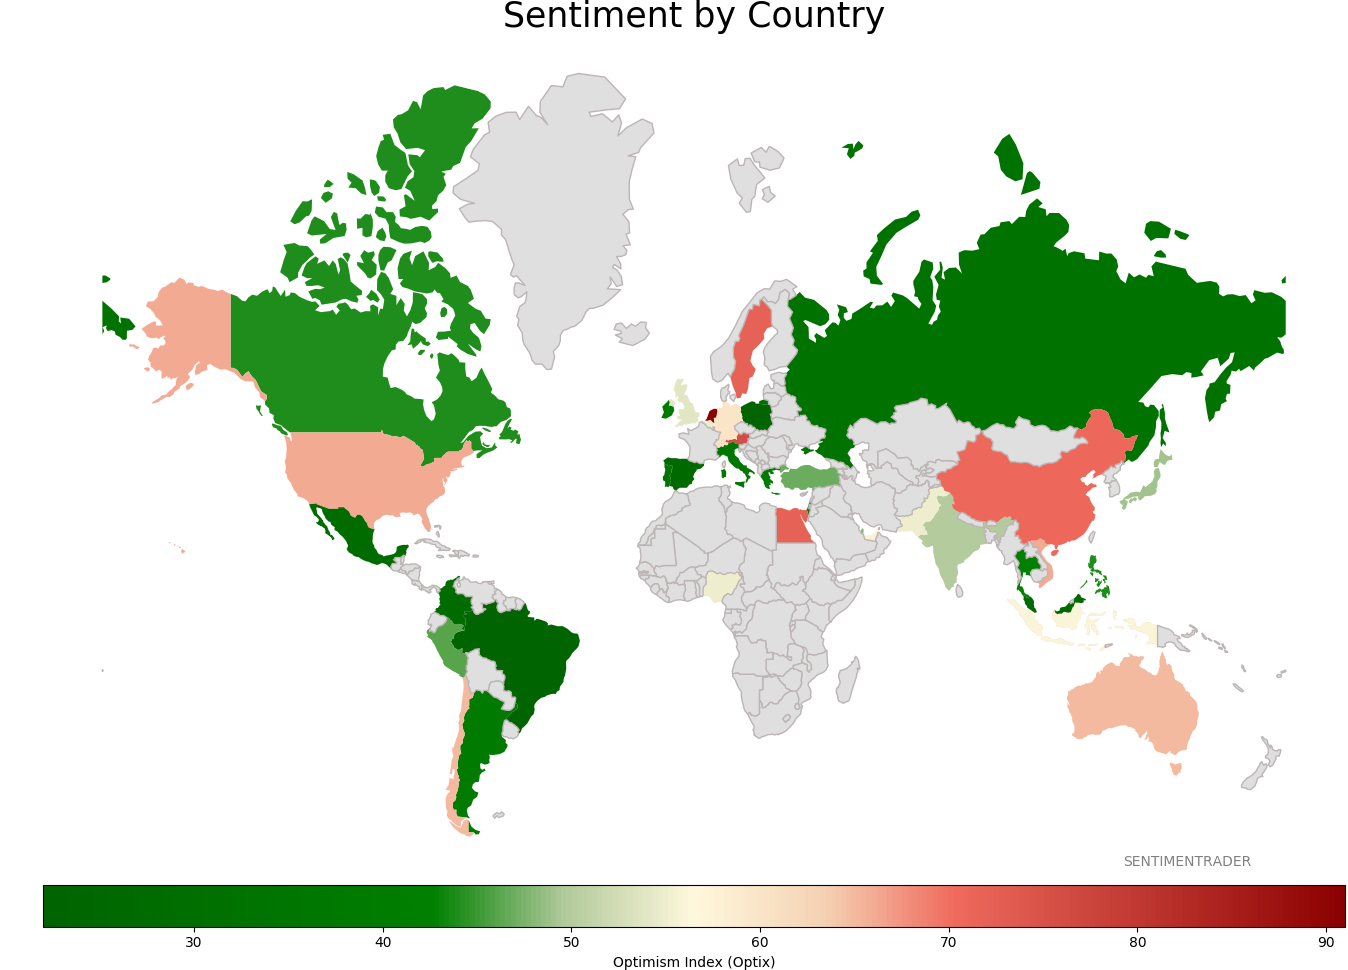
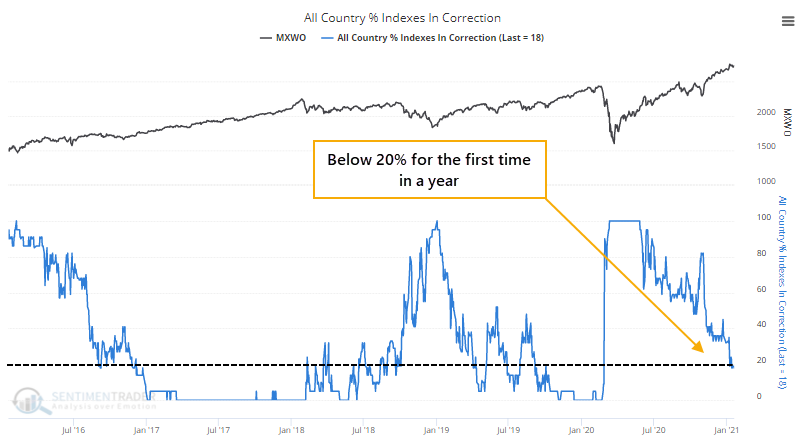
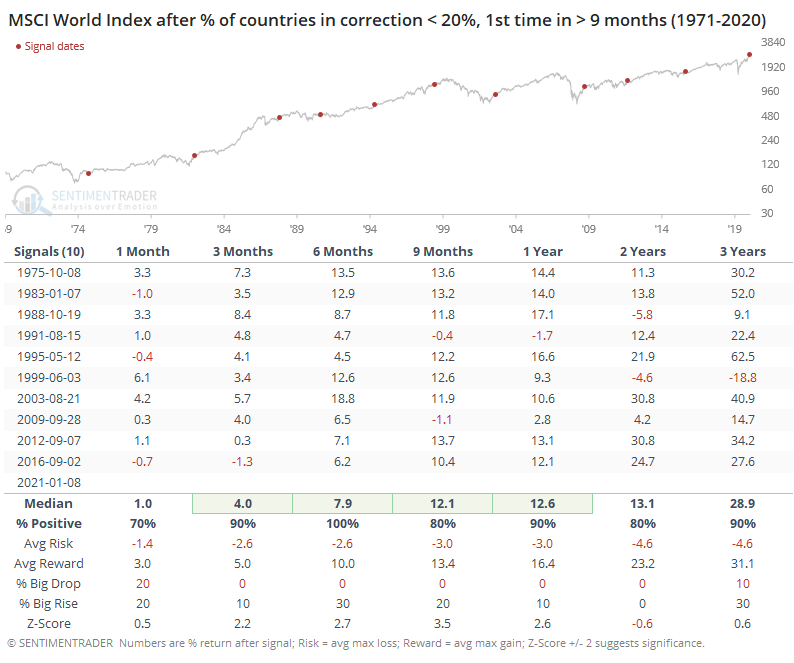
Among the signs of recovery, not just in the U.S. but worldwide, is that for the first time in more than 200 days, fewer than 20% of major world equity indexes are in corrections.
This ends one of the longer streaks since 1971 when more than 20% of countries had been in a correction at the same time.
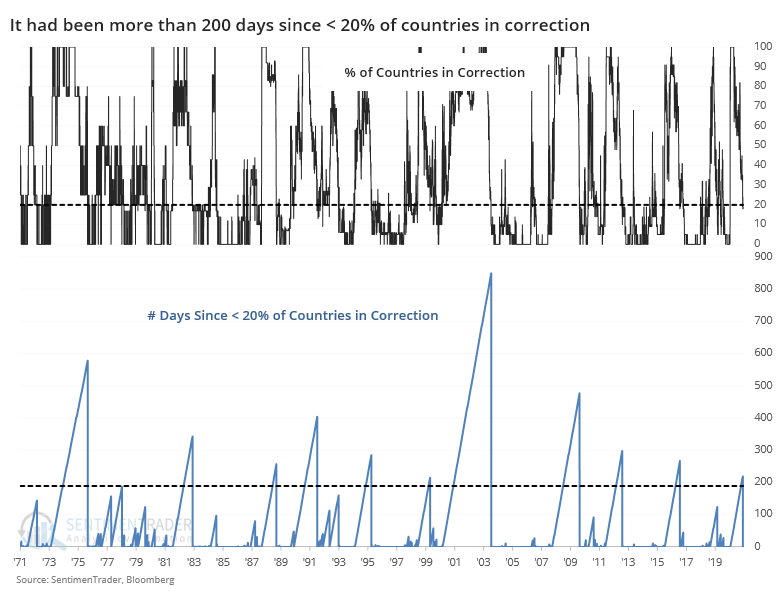
After other streaks ended, it was a good longer-term sign for world stocks. The MSCI World Index showed a positive return over the next 6 months every time, and over the next 9-12 months all but once. Losses were minimal, and the risk/reward was excellent.
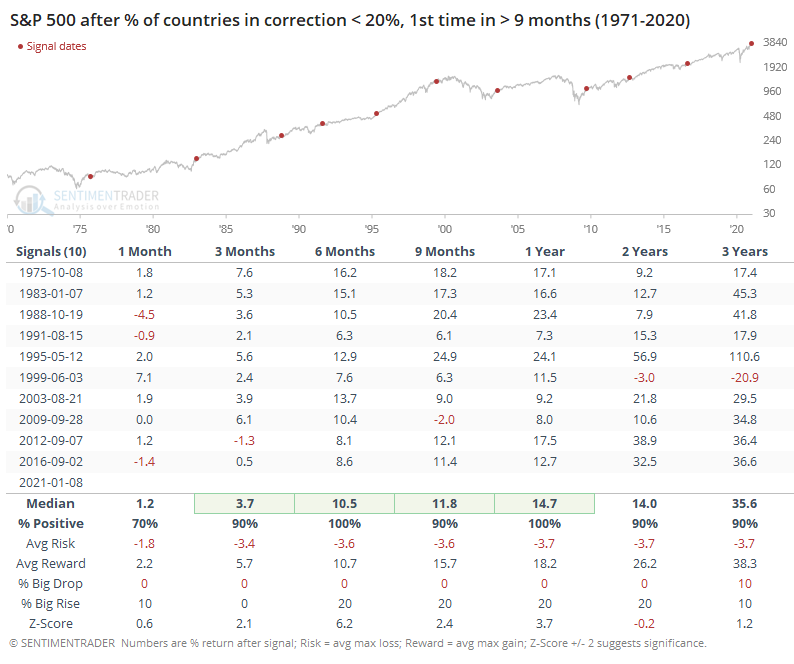
It was good for the S&P 500, too.
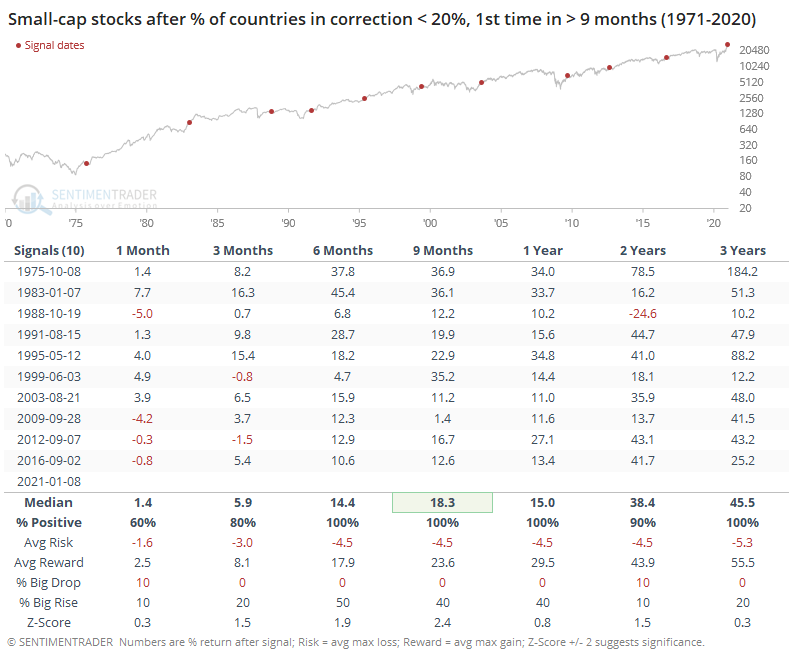
Small-cap stocks were among the biggest beneficiaries of these synchronized recoveries.
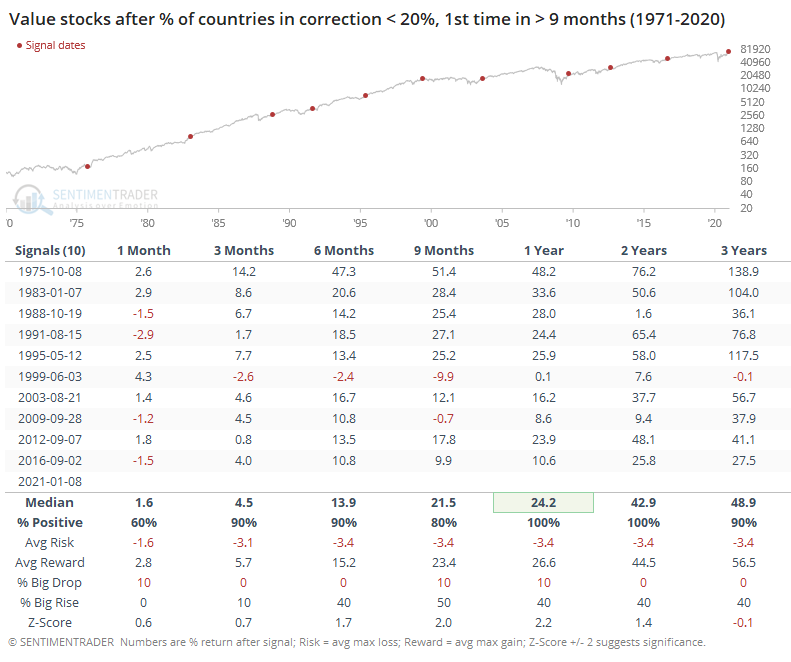
As were value stocks, with a median return of more than 24% over the next year.
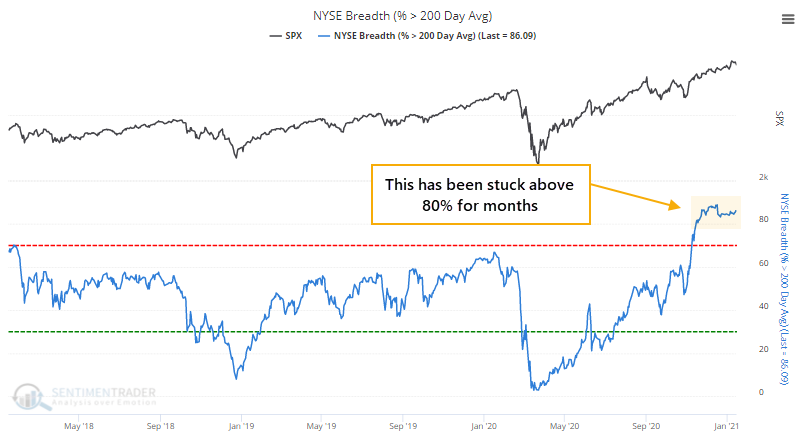
The persistent and broad-based recovery can also be seen in the percentage of securities on the NYSE that have been able to hold above their 200-day averages. This popped above 80% a couple of months ago and has stabilized enough so that an average day over the past 50 sessions has seen more than 80% of securities in an uptrend.
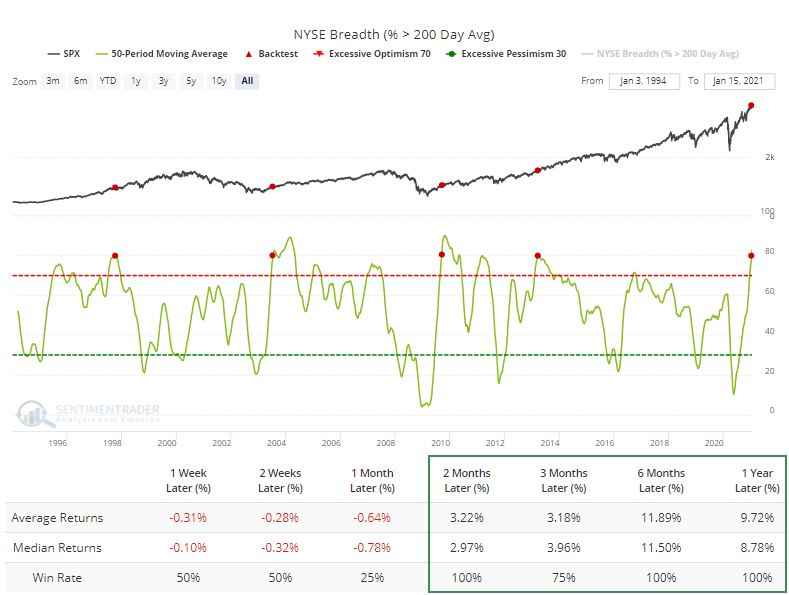
The Backtest Engine shows that when breadth has been this persistent, there were no medium- to long-term losses over the past 25 years, even if it did indicate potential shorter-term overbought conditions and weak returns up to a month later.
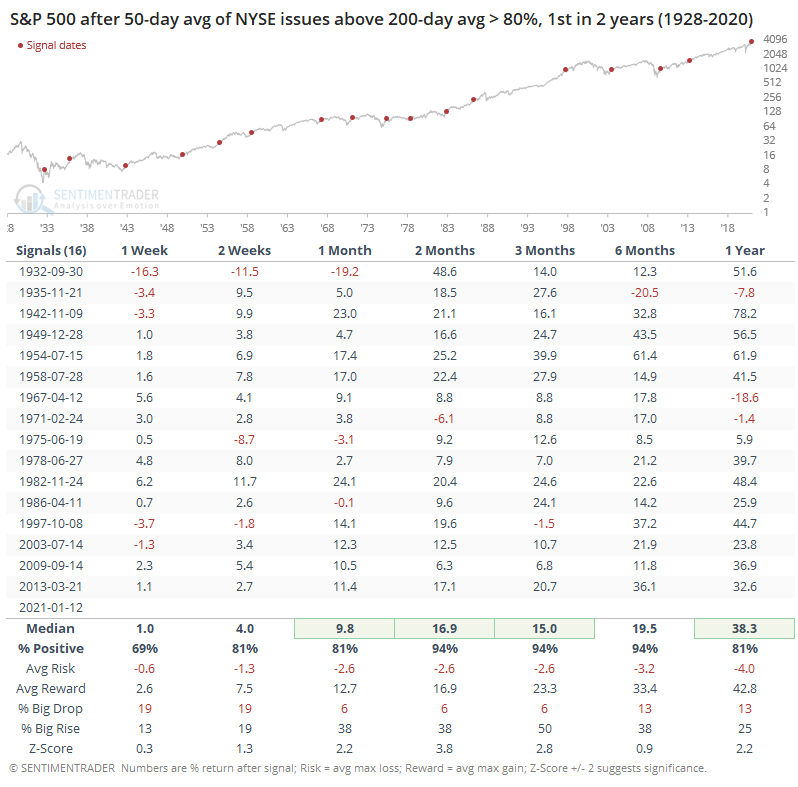
If we go back further and take a longer-term point of view, then this kind of persistent and broad-based thrust remains a remarkably positive development.
There is no good way to square the two primary conflicting aspects of where we are right now.
Sentiment is horrifically extreme and almost all signs are present, screaming at us that we're seeing the kinds of behavior that are almost solely and universally seen at medium-term peaks in stocks. And yet, the types of recoveries we've seen in breadth and momentum have an extremely consistent tendency to occur at the beginning stages of longer-term recoveries, with few historical losses over a 6-12 month time frame.
While breadth / momentum and sentiment often give conflicting signals, it's never been to this extreme of a degree. So far, momentum is clearly winning, and we'd continue to give that the benefit of the doubt unless we see more oddities pile up, with underlying divergences and internal deterioration. If and when those start to trigger, it would suggest a high probability of a medium-term correction to rid us of some of these signs of exuberance.
Active Studies
| Time Frame | Bullish | Bearish | | Short-Term | 0 | 0 | | Medium-Term | 2 | 2 | | Long-Term | 15 | 2 |
|
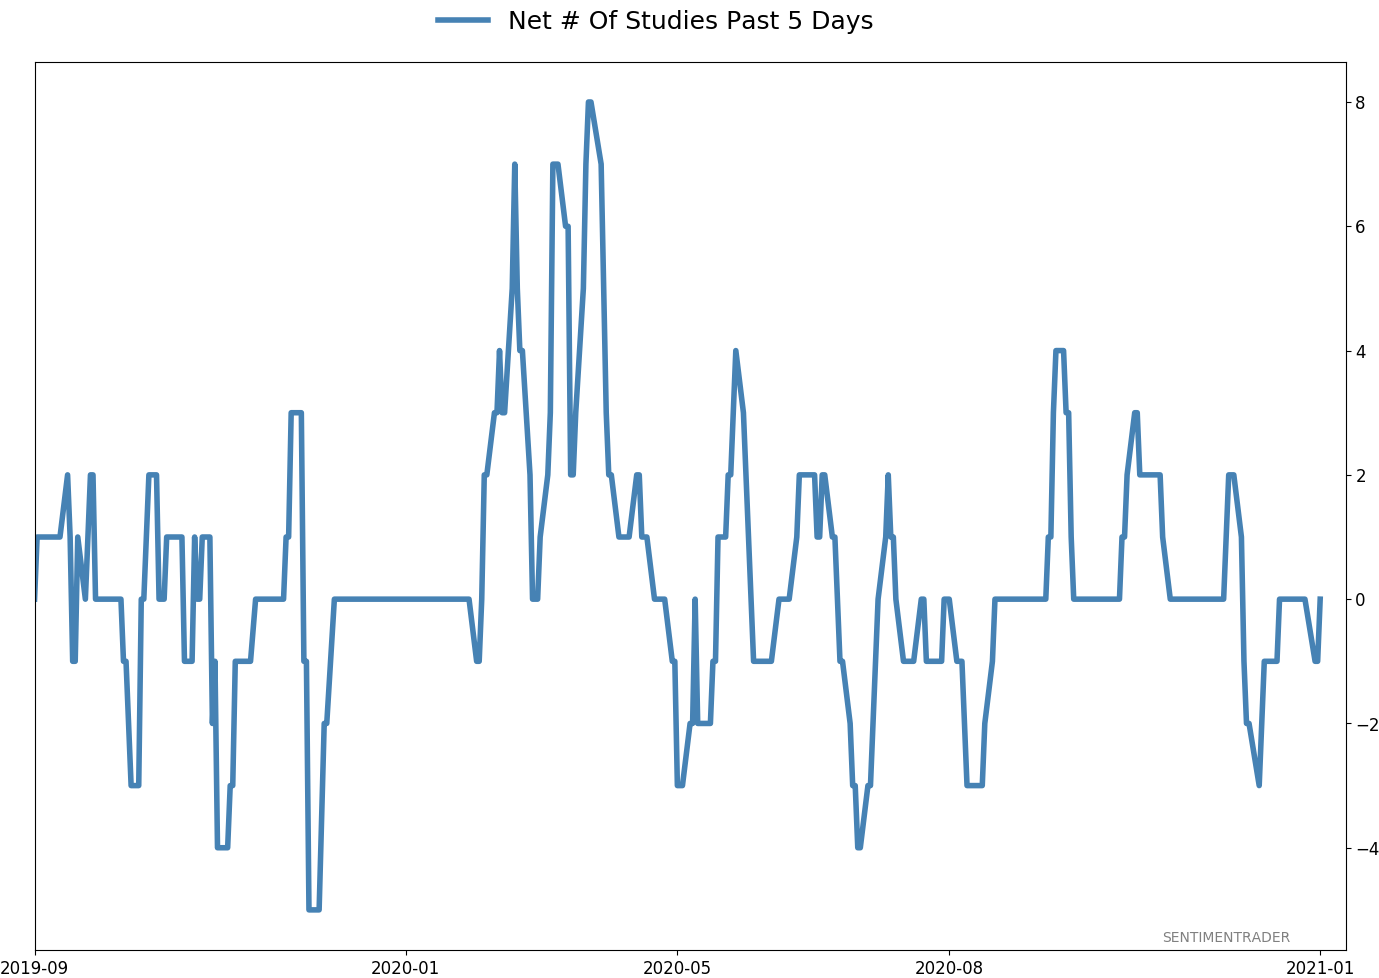
Indicators at Extremes
Portfolio
| Position | Description | Weight % | Added / Reduced | Date | | Stocks | 10.6% VWO, 10.1% XLE, 8.5% RSP, 8.3% PSCE | 37.5 | Added 3% | 2021-01-05 | | Bonds | 10% BND, 10% SCHP, 10% ANGL | 27.8 | Reduced 0.1% | 2020-10-02 | | Commodities | GCC | 2.3 | Reduced 2.1%
| 2020-09-04 | | Precious Metals | GDX | 9.8 | Added 4.8% | 2020-12-01 | | Special Situations | | 0.0 | Reduced 5% | 2020-10-02 | | Cash | | 22.6 | | |
|
Updates (Changes made today are underlined)
There hasn't been much that changed in recent weeks, with sky-high sentiment on many measures receding a bit, but that's not necessarily a good sign, just ask February 2020. We still have the lingering positives from all the breadth thrust last year, as late as October and November. Those have a very good historical record at preceding higher prices over a longer time frame. Of more immediate concern is the explosion in speculation in the most leveraged parts of the market. So far, that hasn't translated to price troubles, though there have been more oddities n the latter half of December than we'd seen since August, like the major indexes rising but on very poor breadth. I continue to avoid tech- and cap-heavy indexes, and don't see that changing any time soon. Energy stocks are doing what they should, and I added a bit more there. I'm not a momentum trader and do not focus on pyramiding positions in this account - it's more about protecting capital - but I like the setup on a long-term time frame. RETURN YTD: 3.7% 2020: 8.1%, 2019: 12.6%, 2018: 0.6%, 2017: 3.8%, 2016: 17.1%, 2015: 9.2%, 2014: 14.5%, 2013: 2.2%, 2012: 10.8%, 2011: 16.5%, 2010: 15.3%, 2009: 23.9%, 2008: 16.2%, 2007: 7.8%
|
|
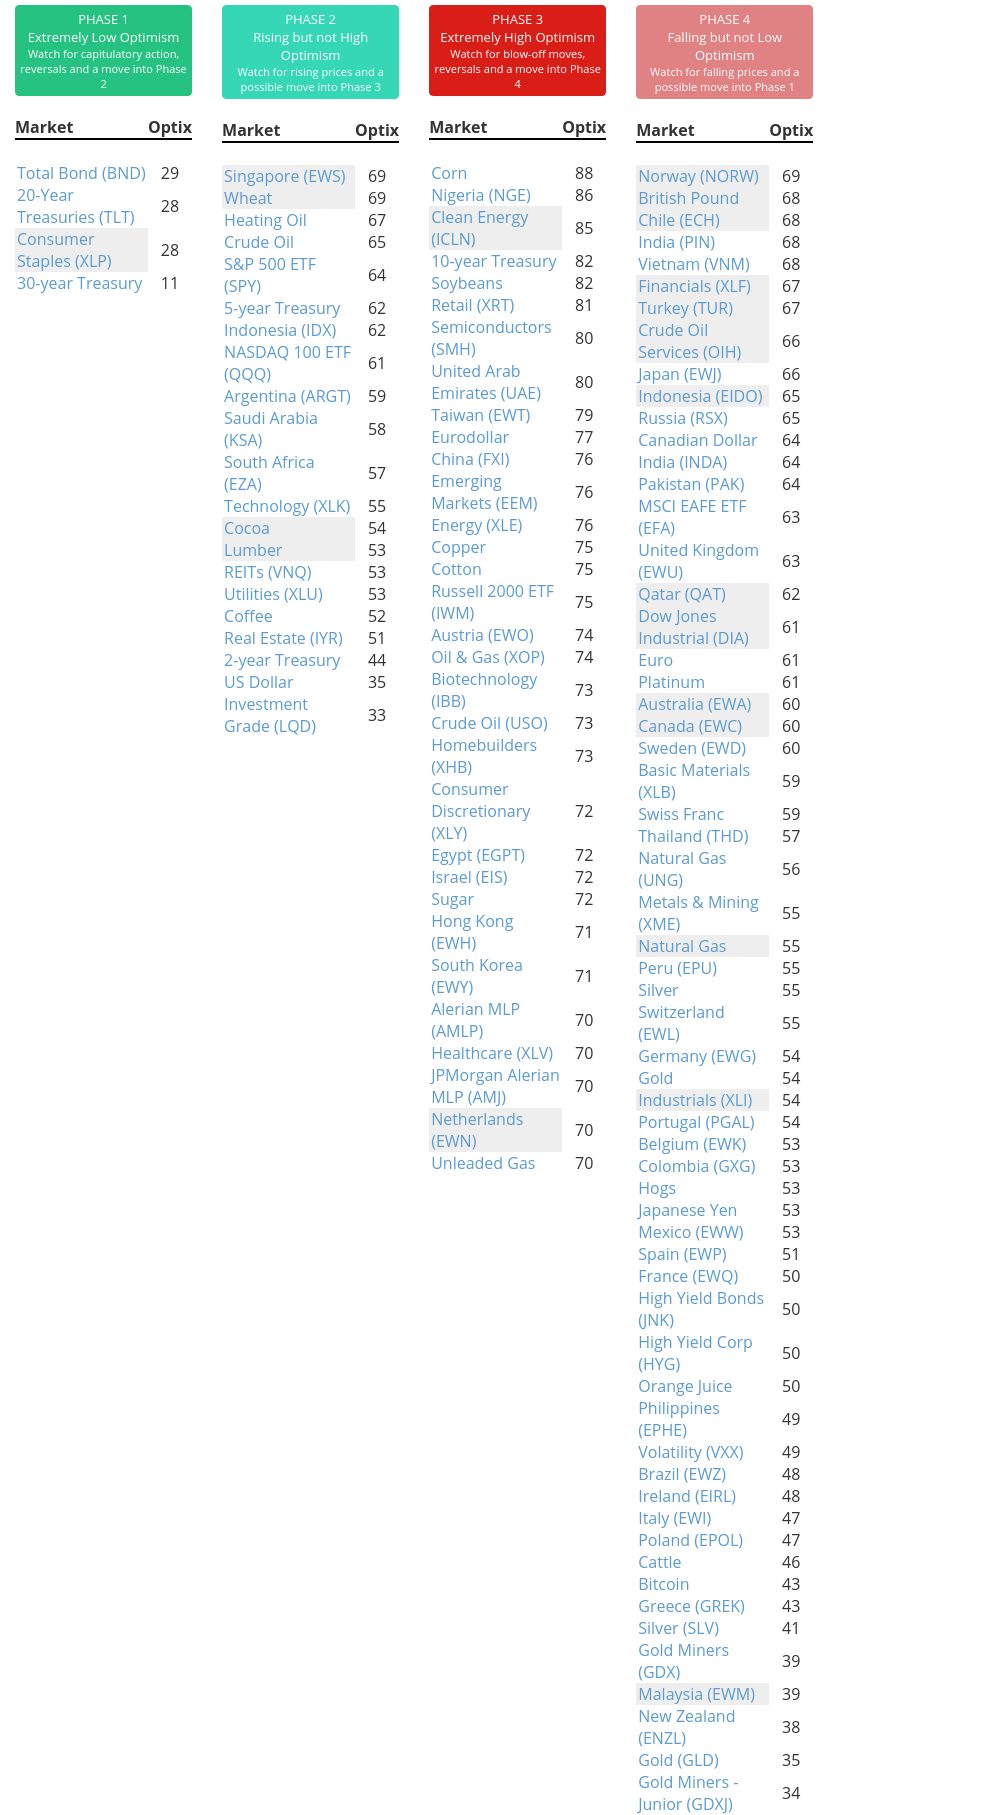
Phase Table
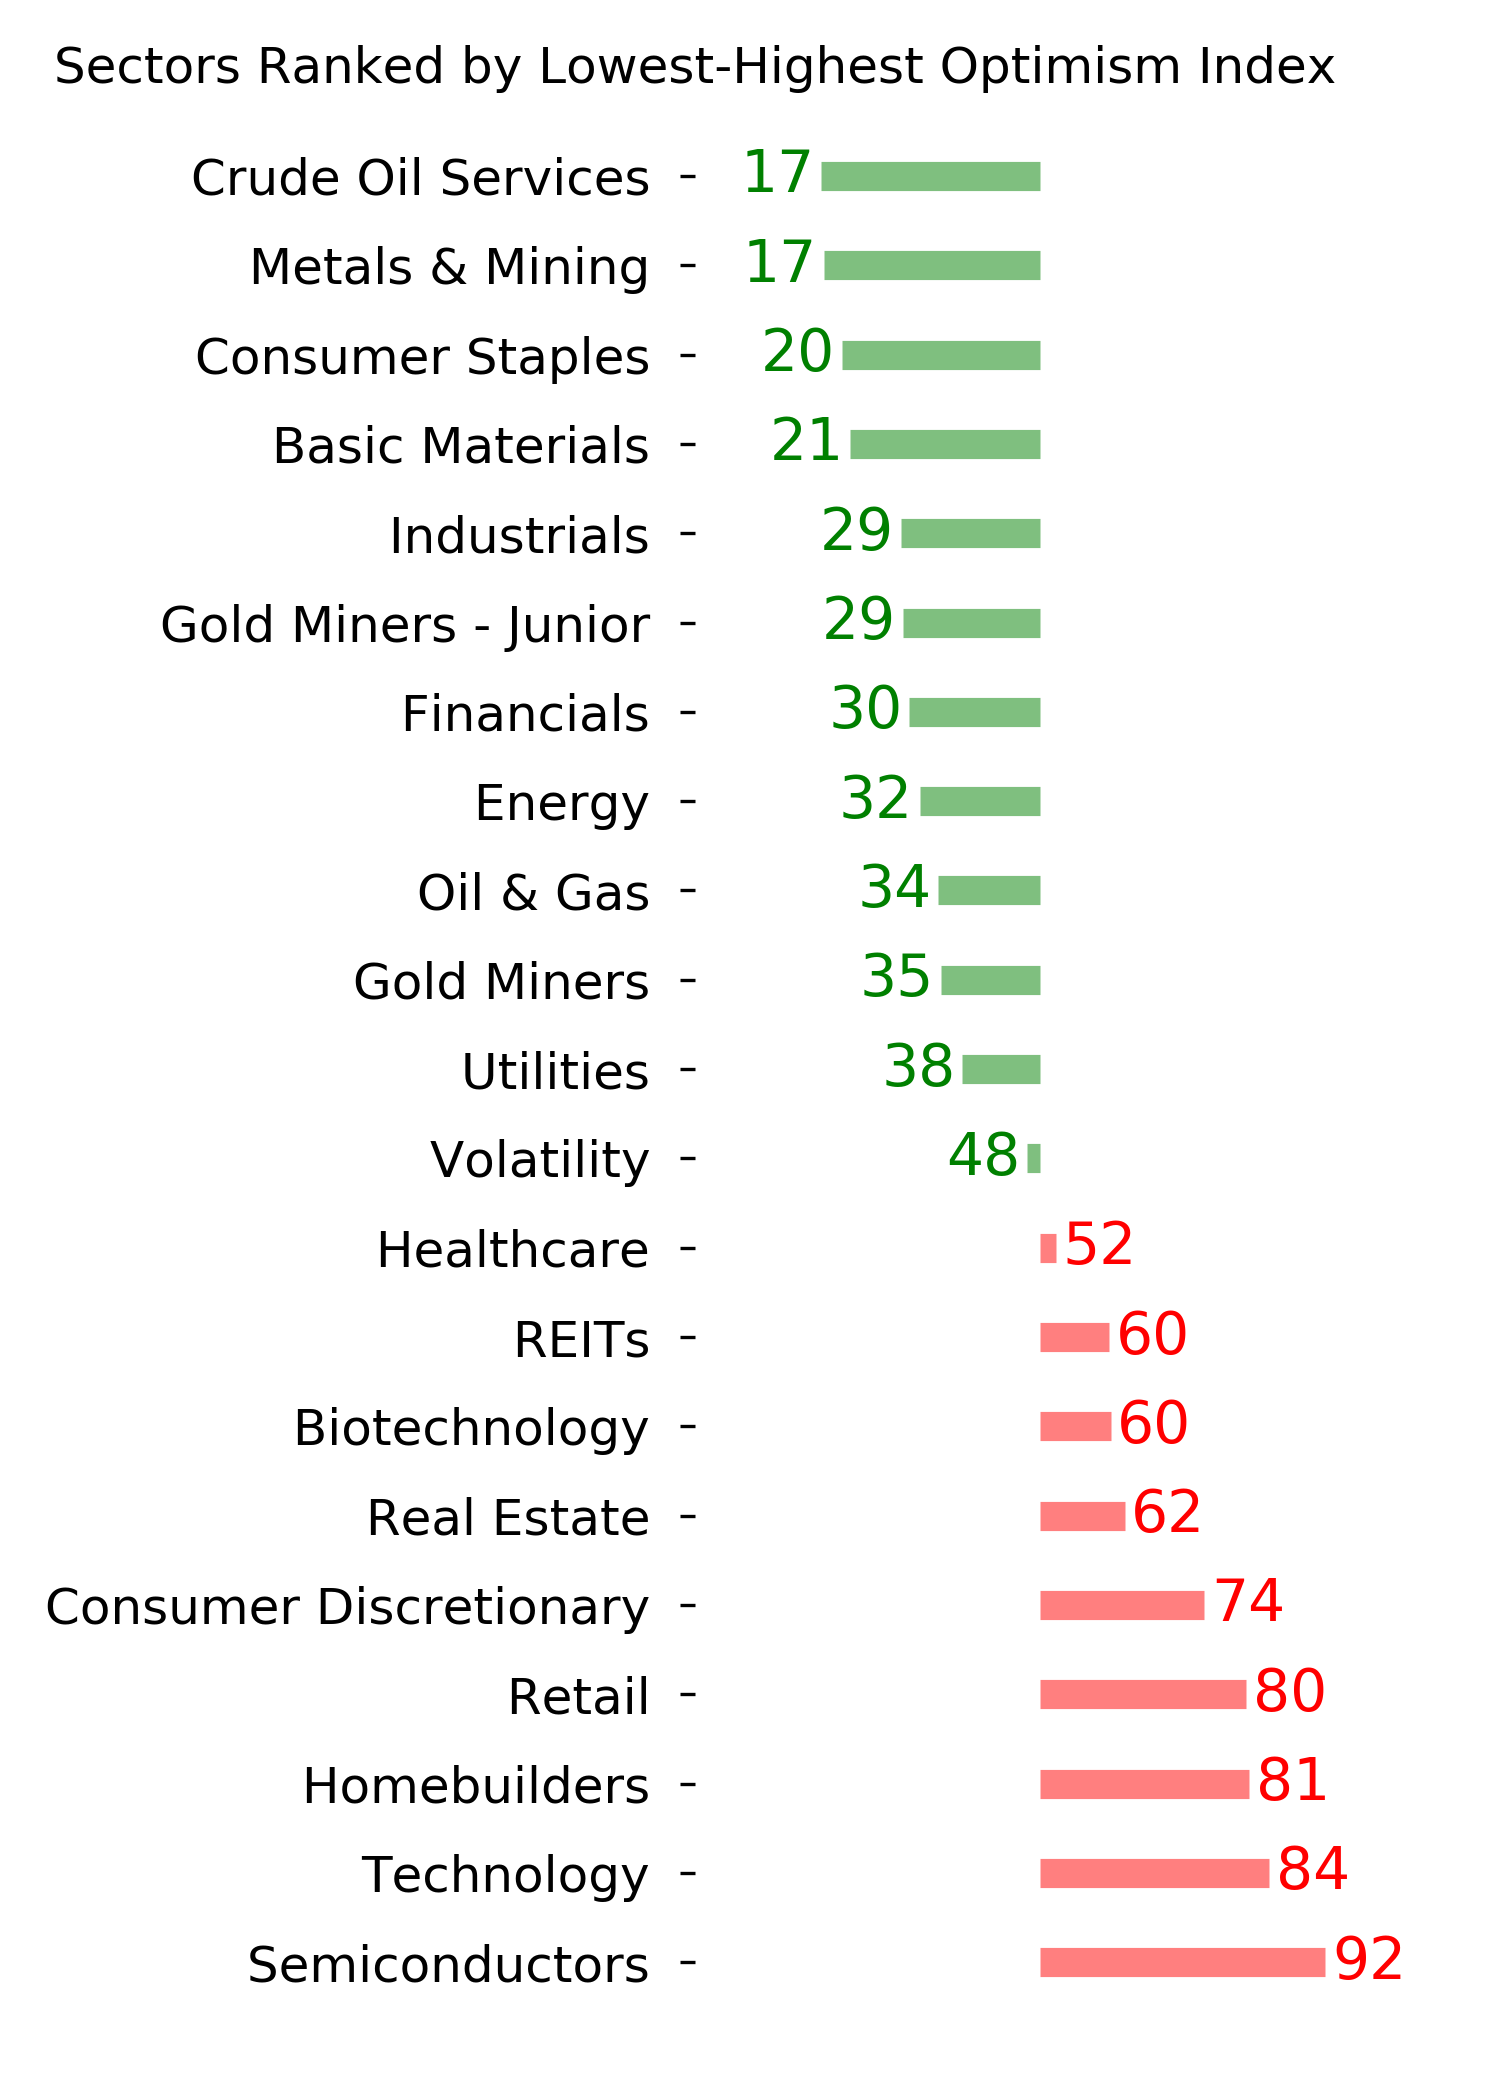
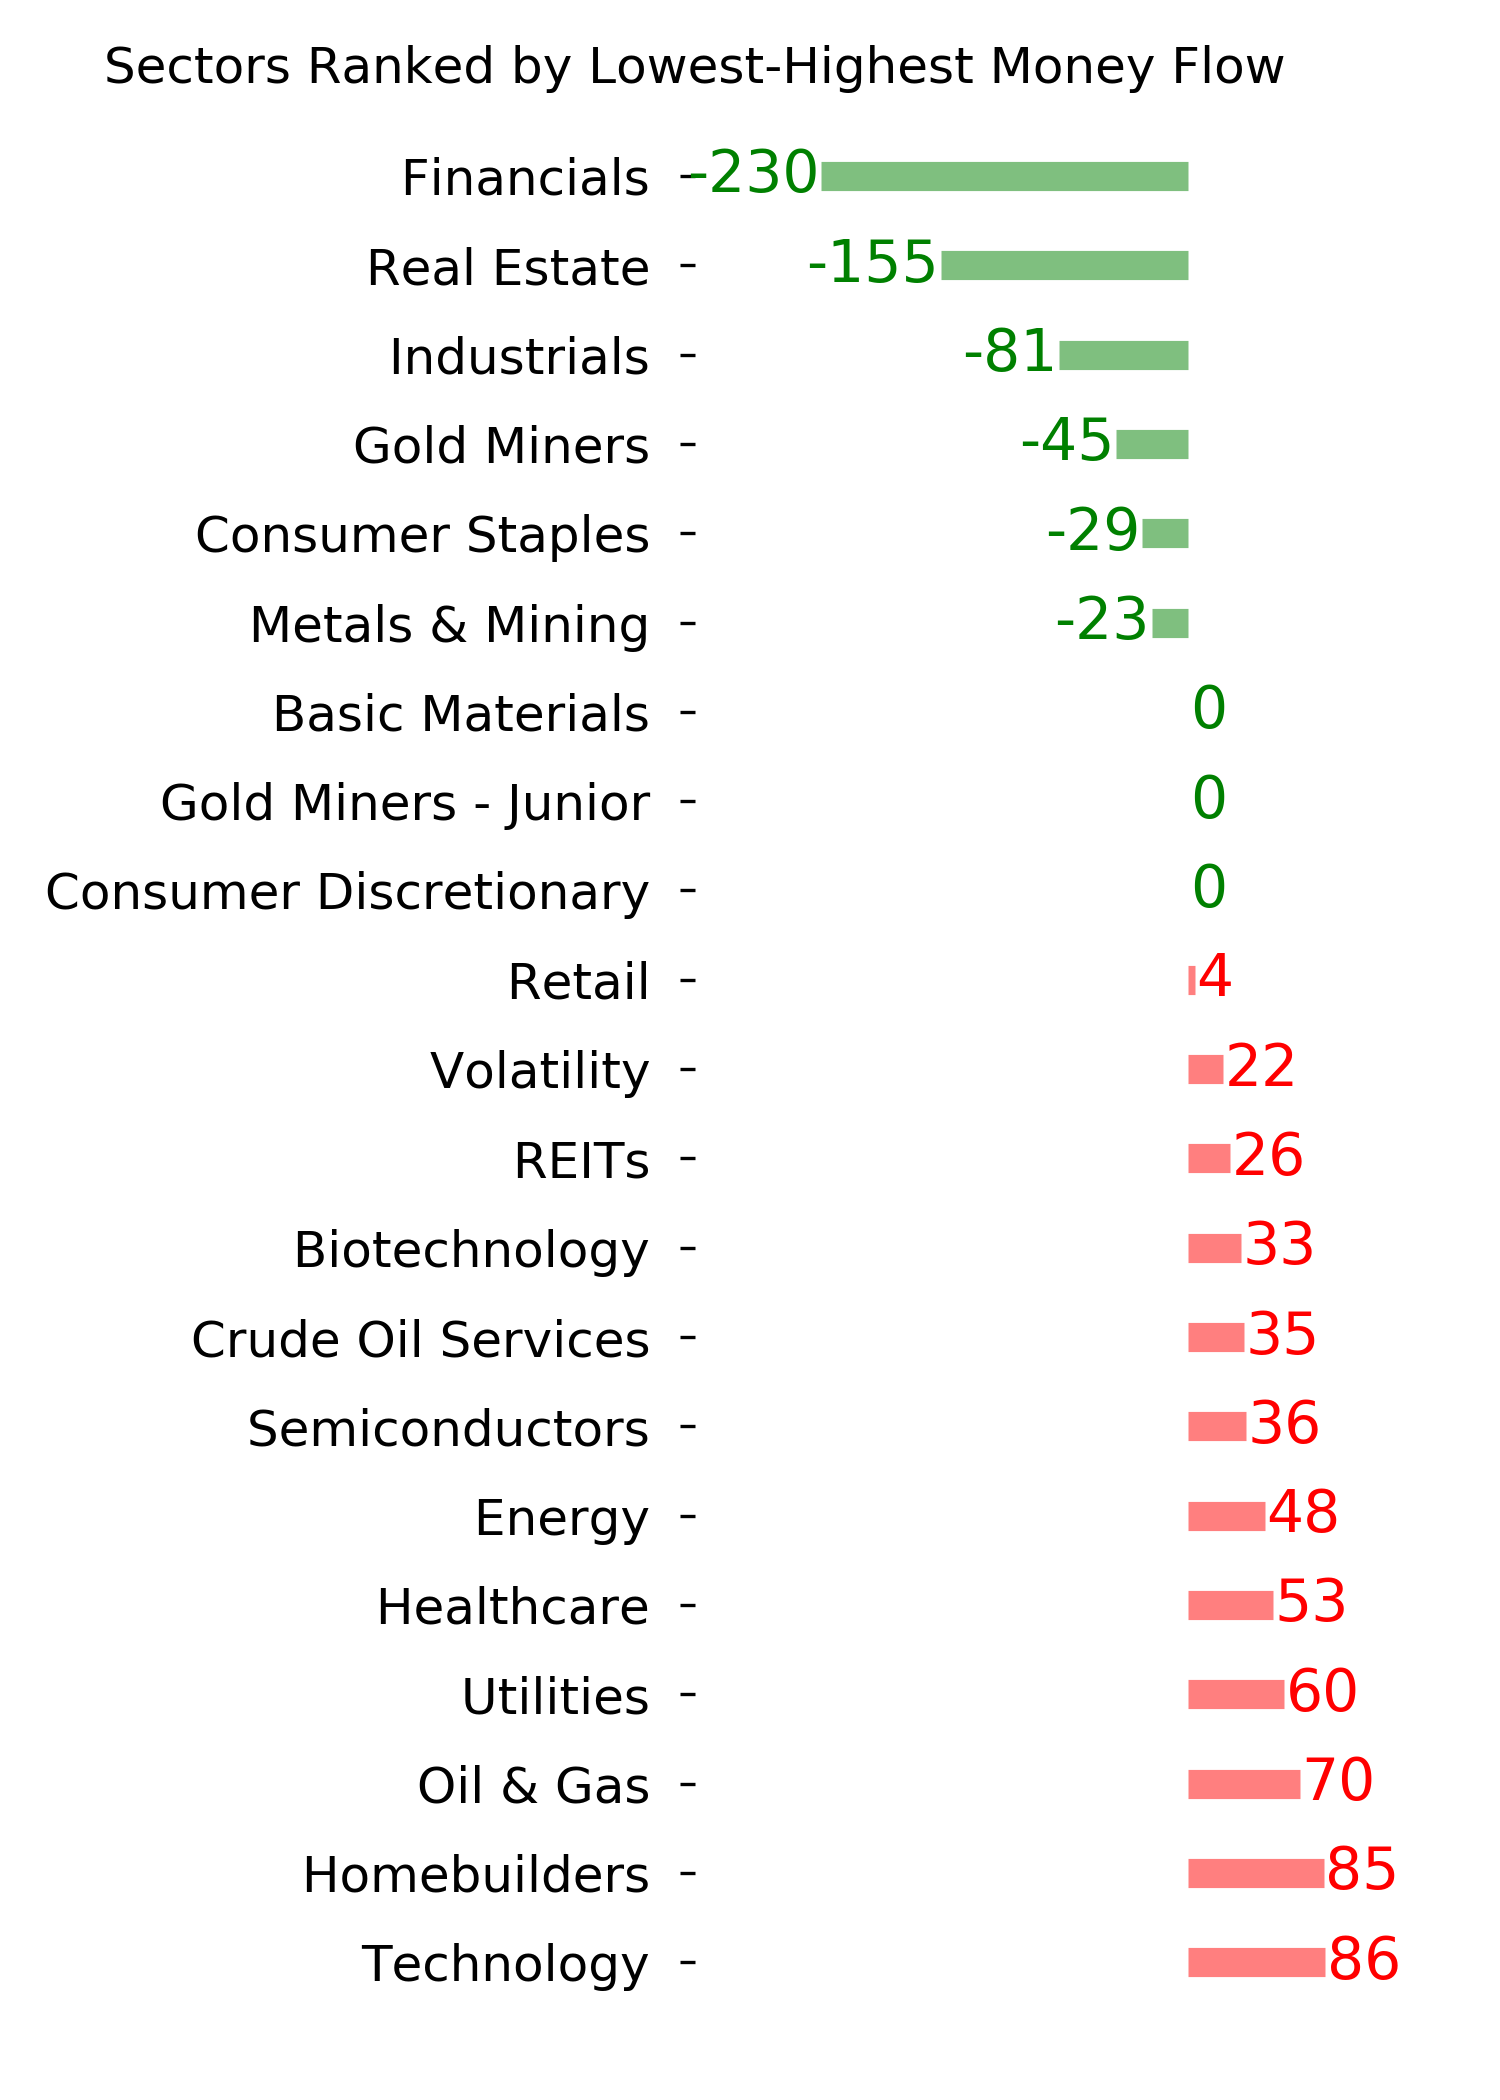
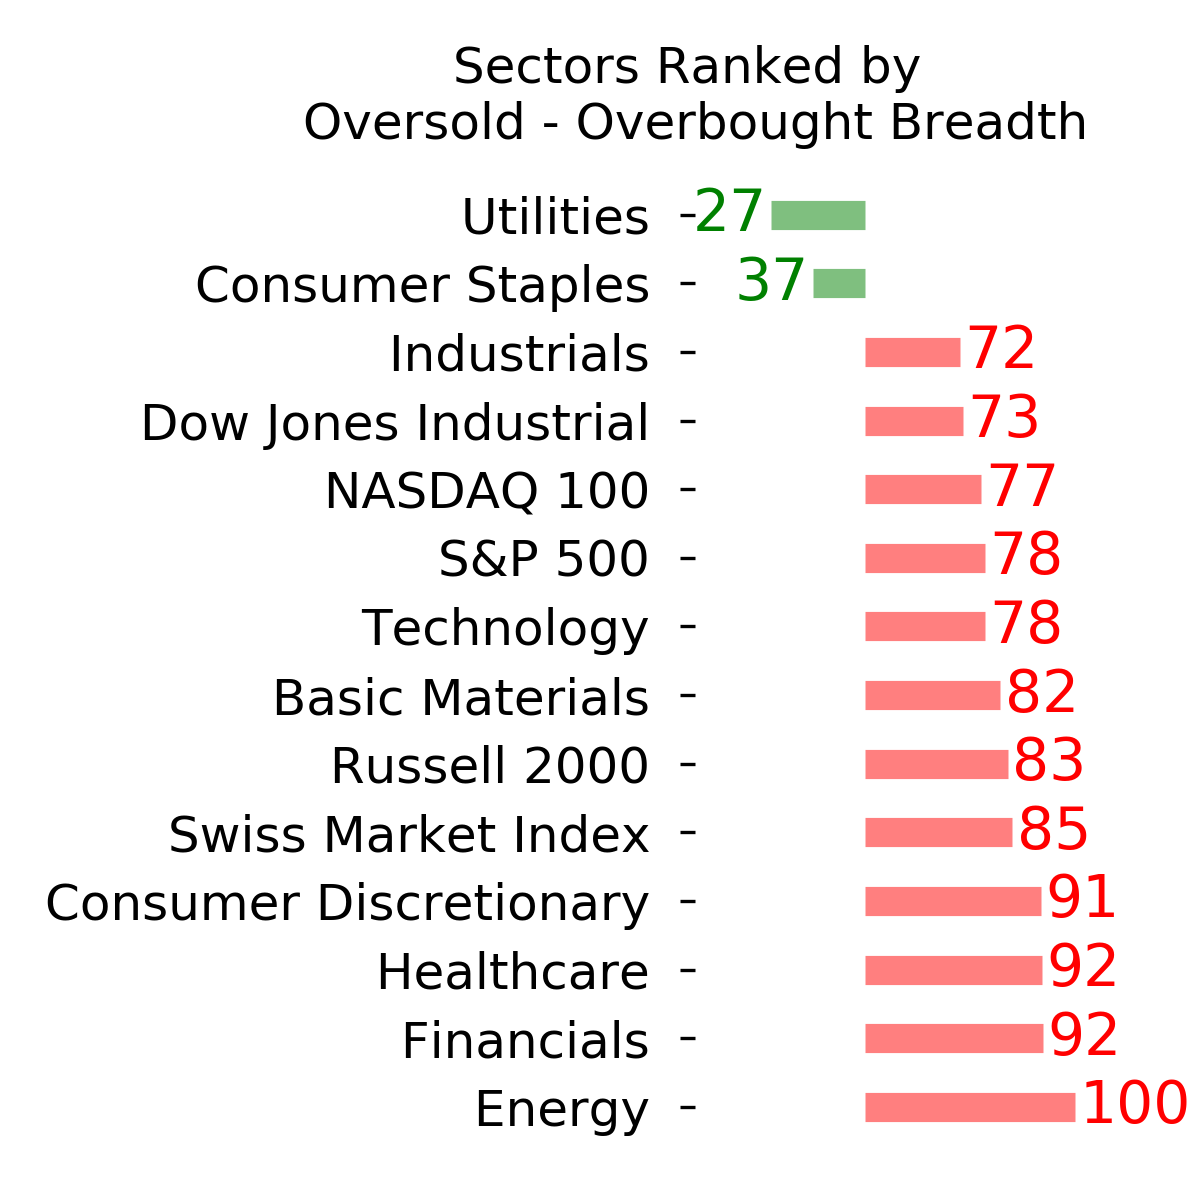
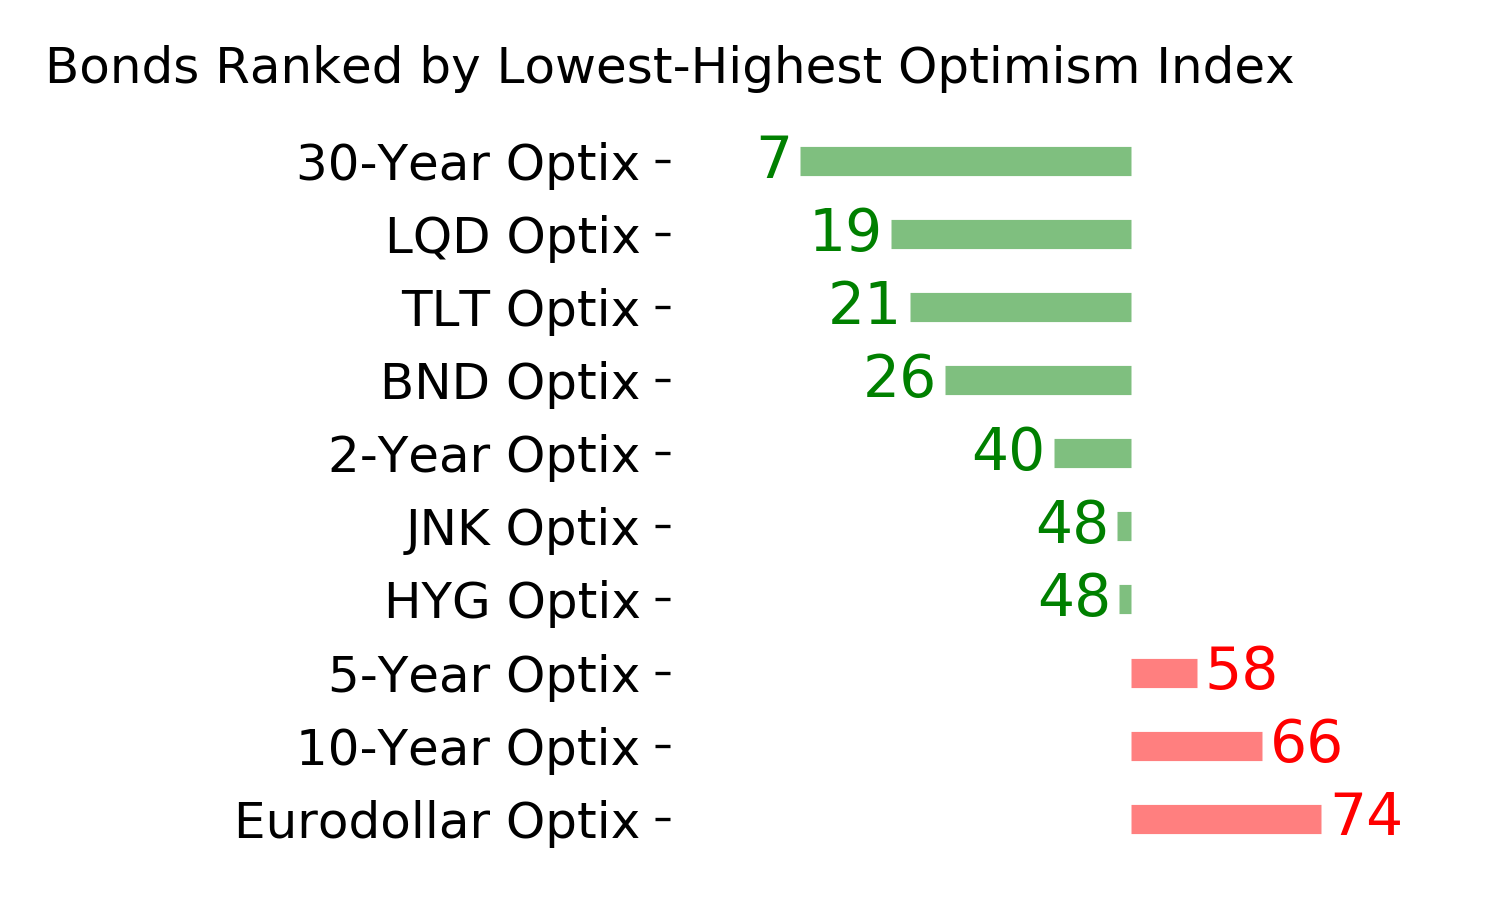
Ranks
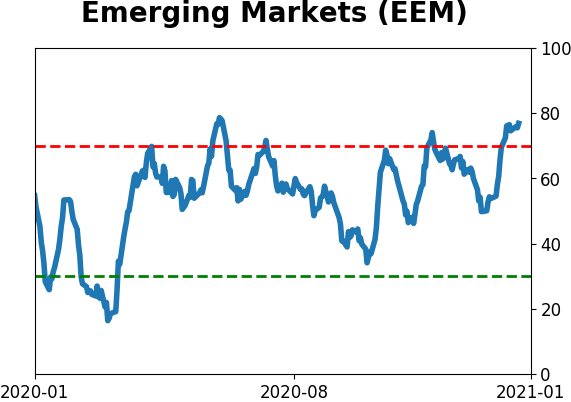
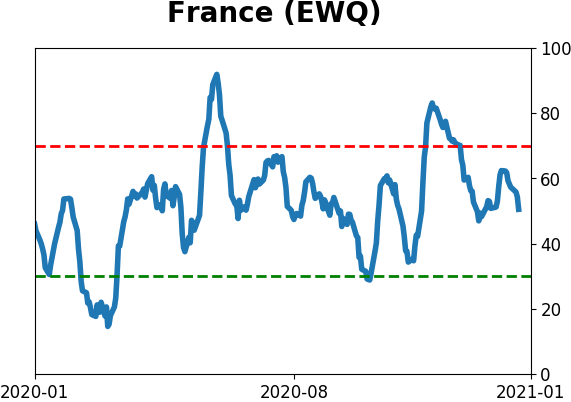
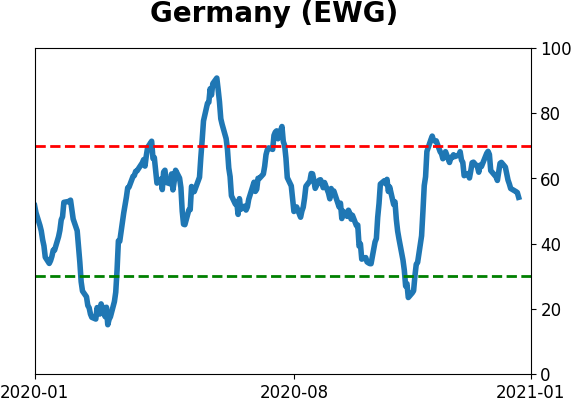
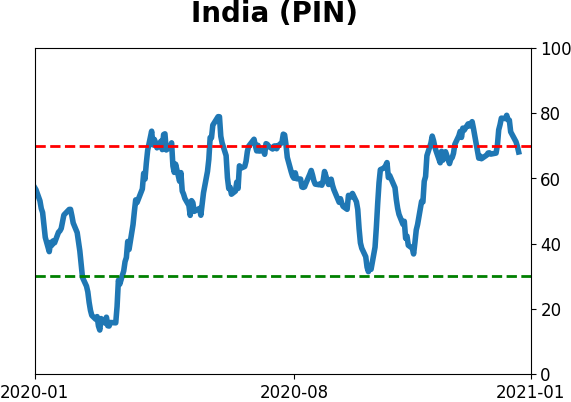
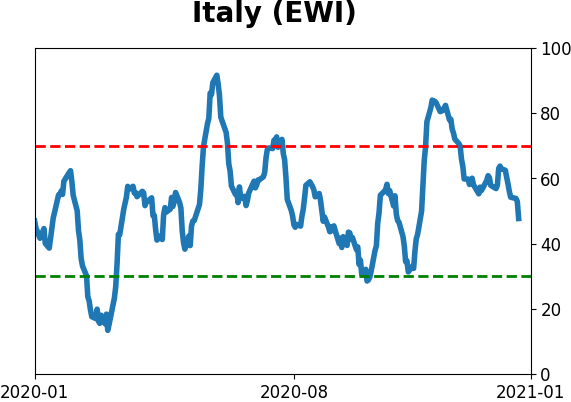
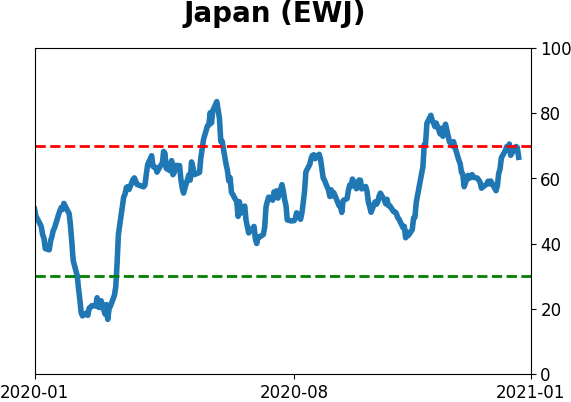
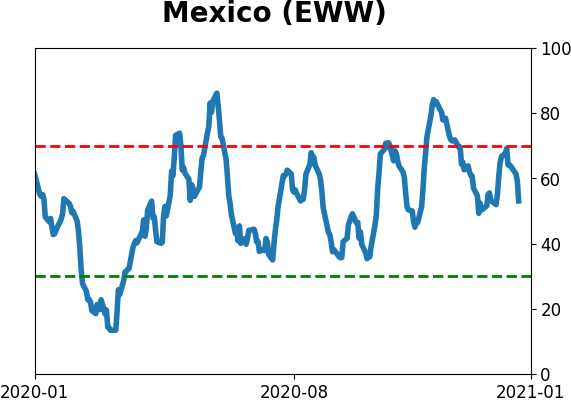
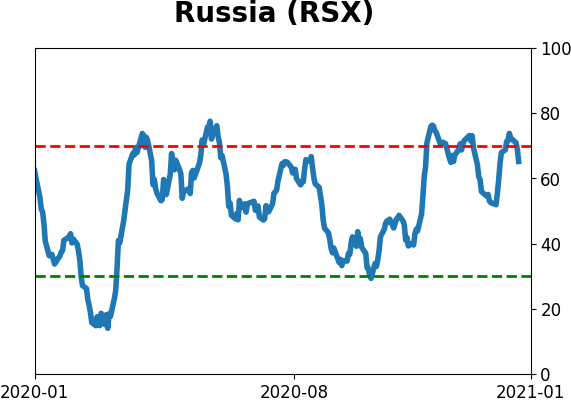
Sentiment Around The World
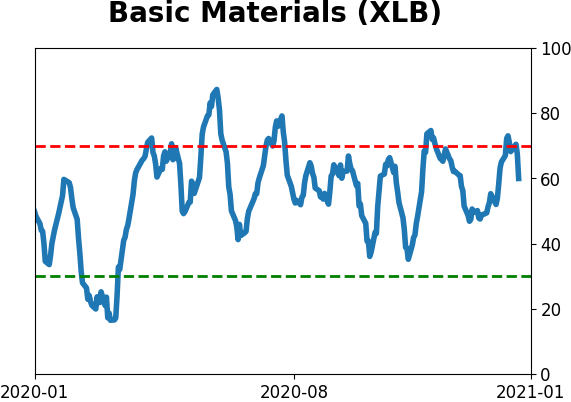
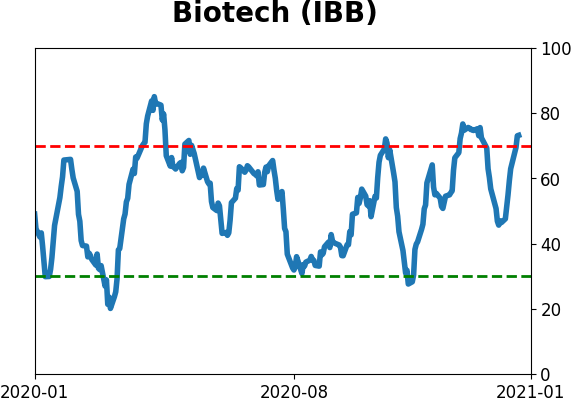
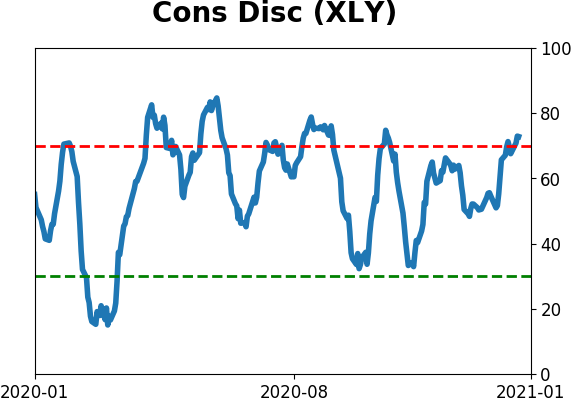
Optimism Index Thumbnails
|
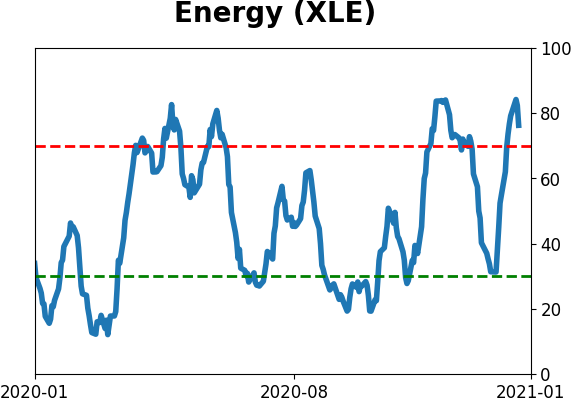
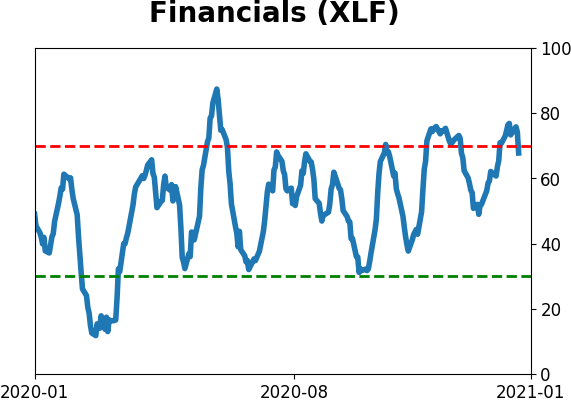
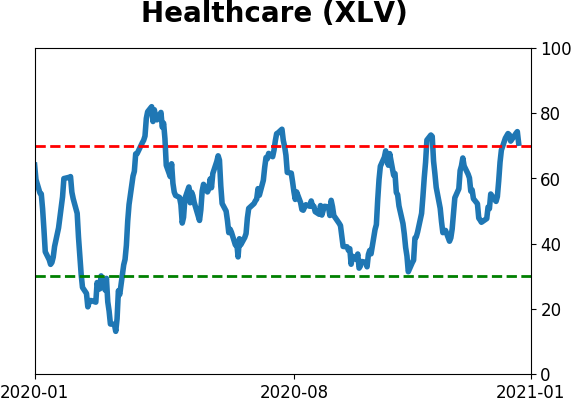
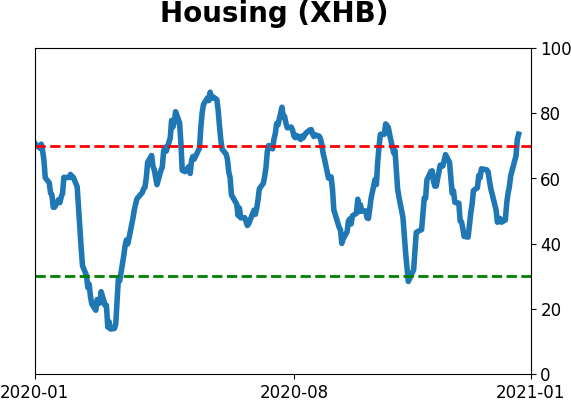
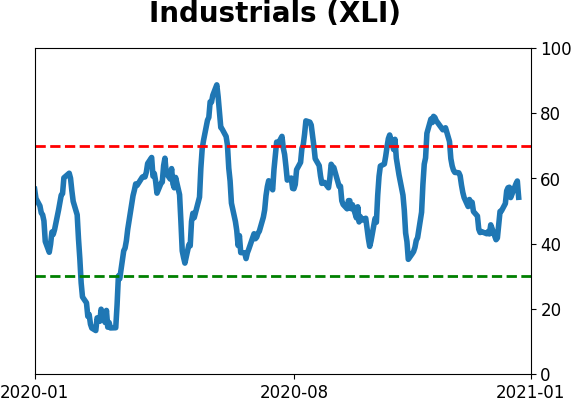
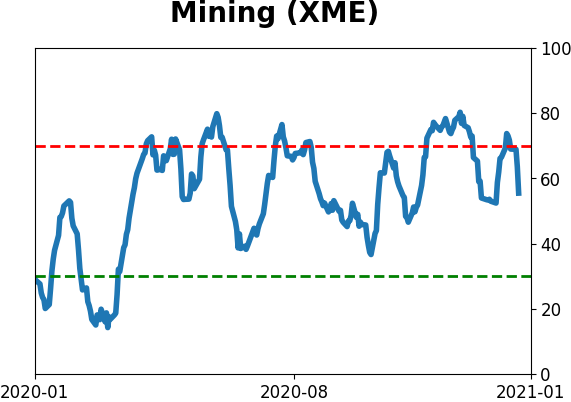
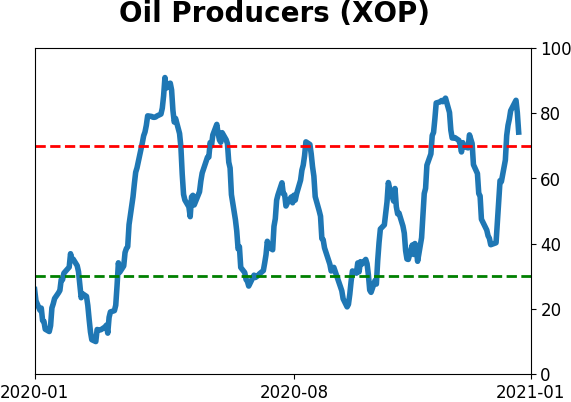
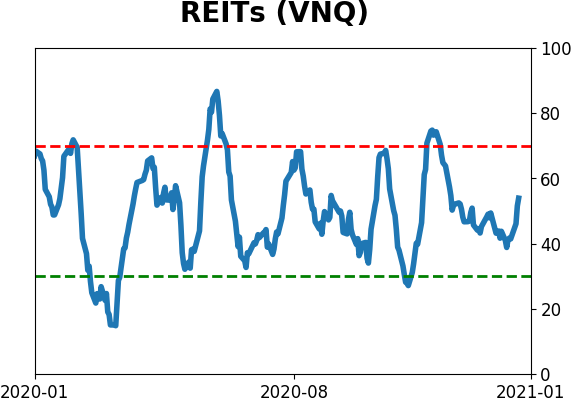
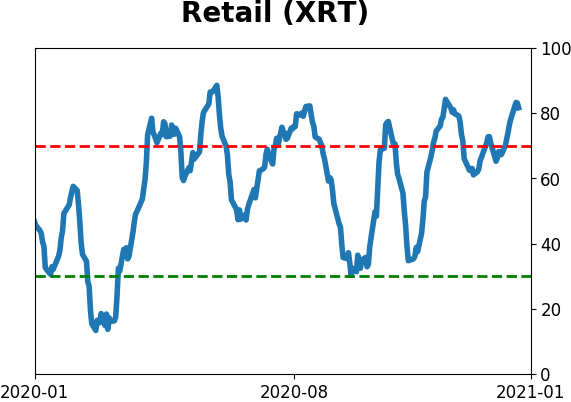
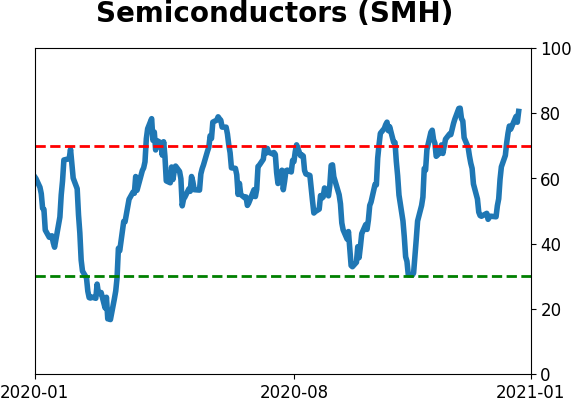
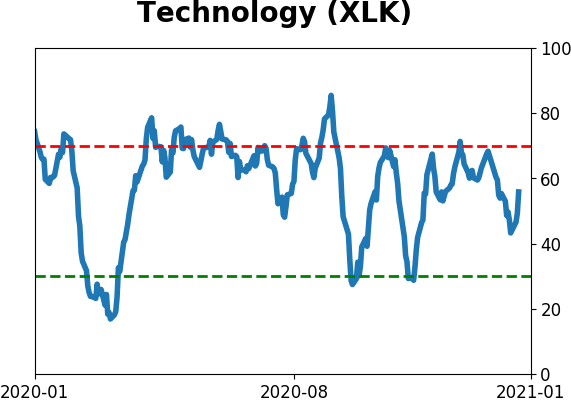
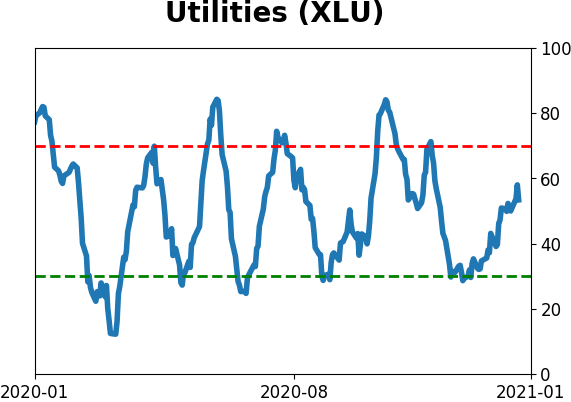
Sector ETF's - 10-Day Moving Average
|
|
|
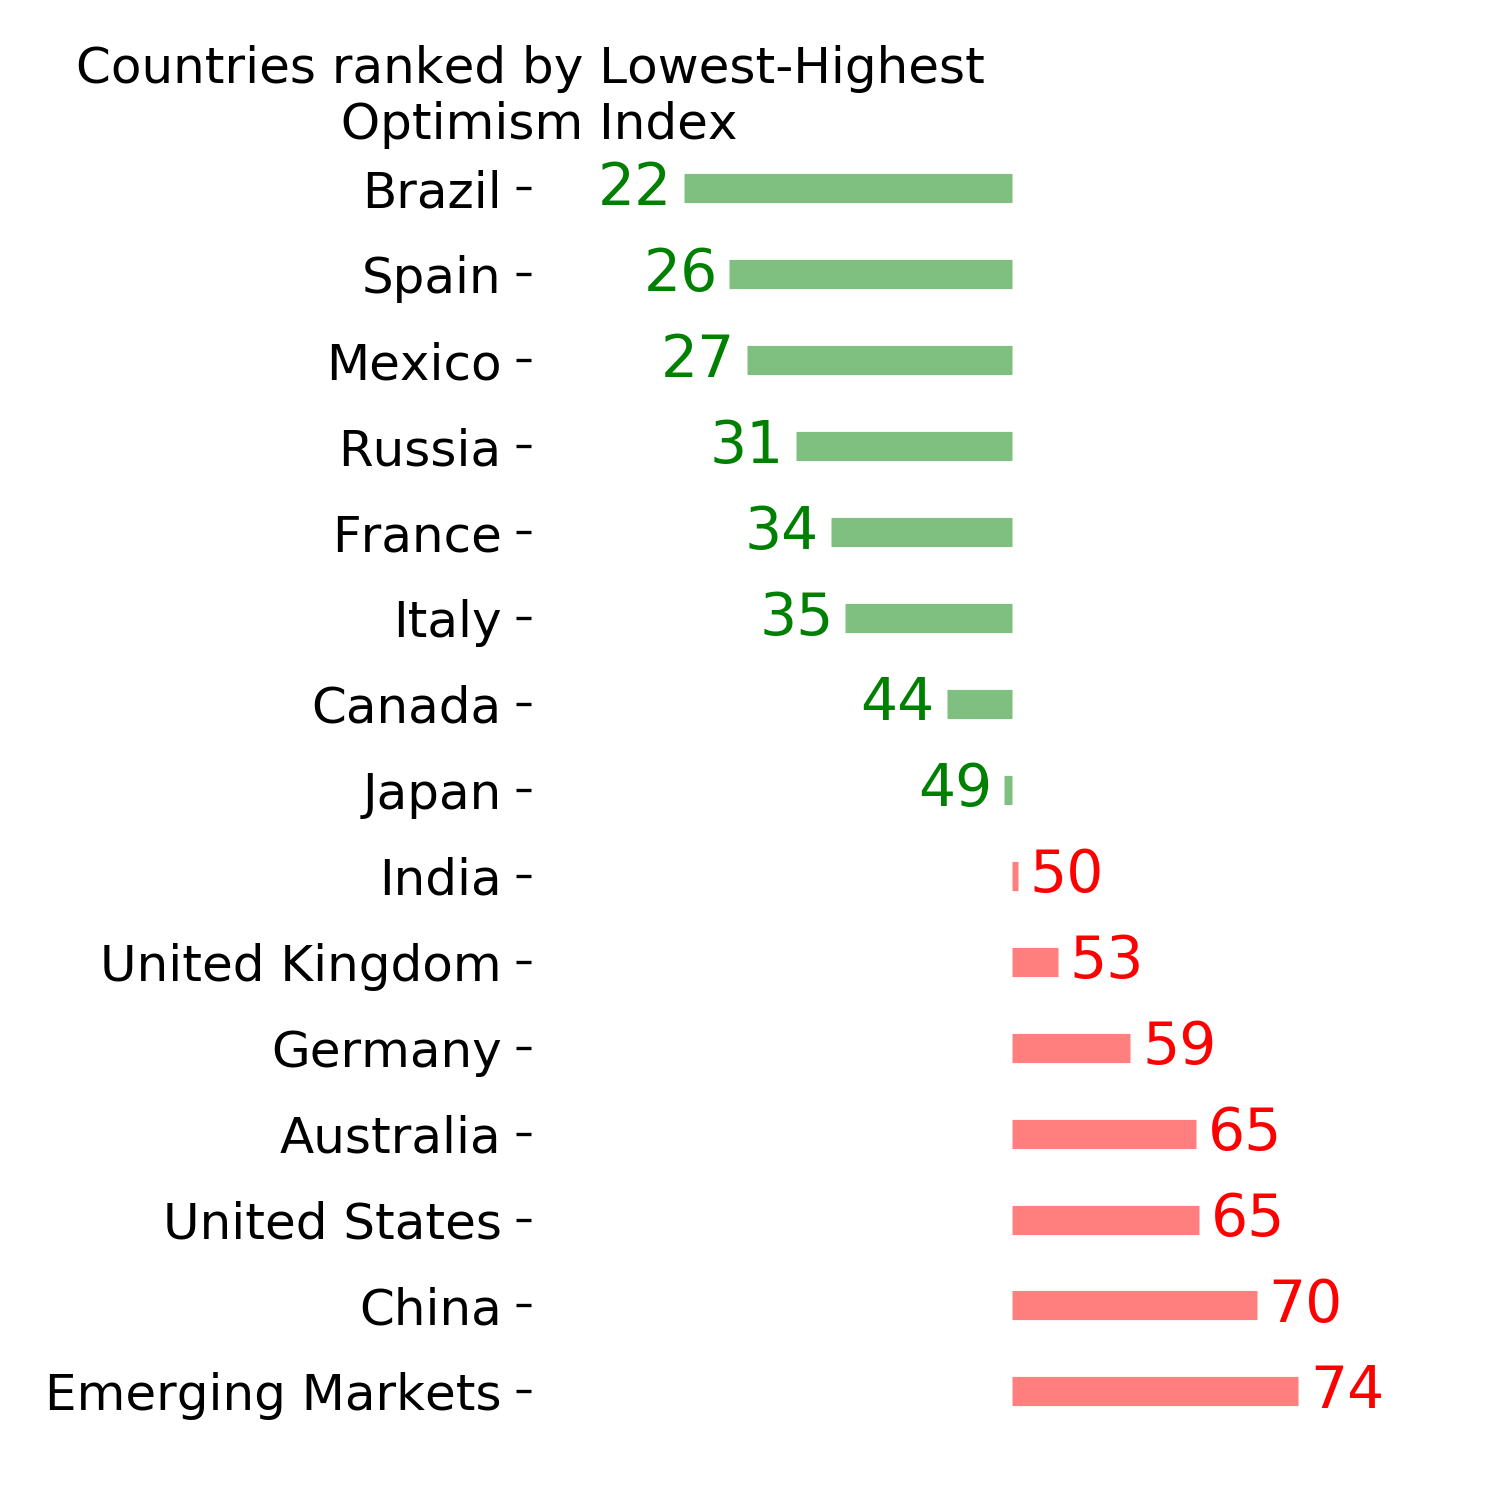
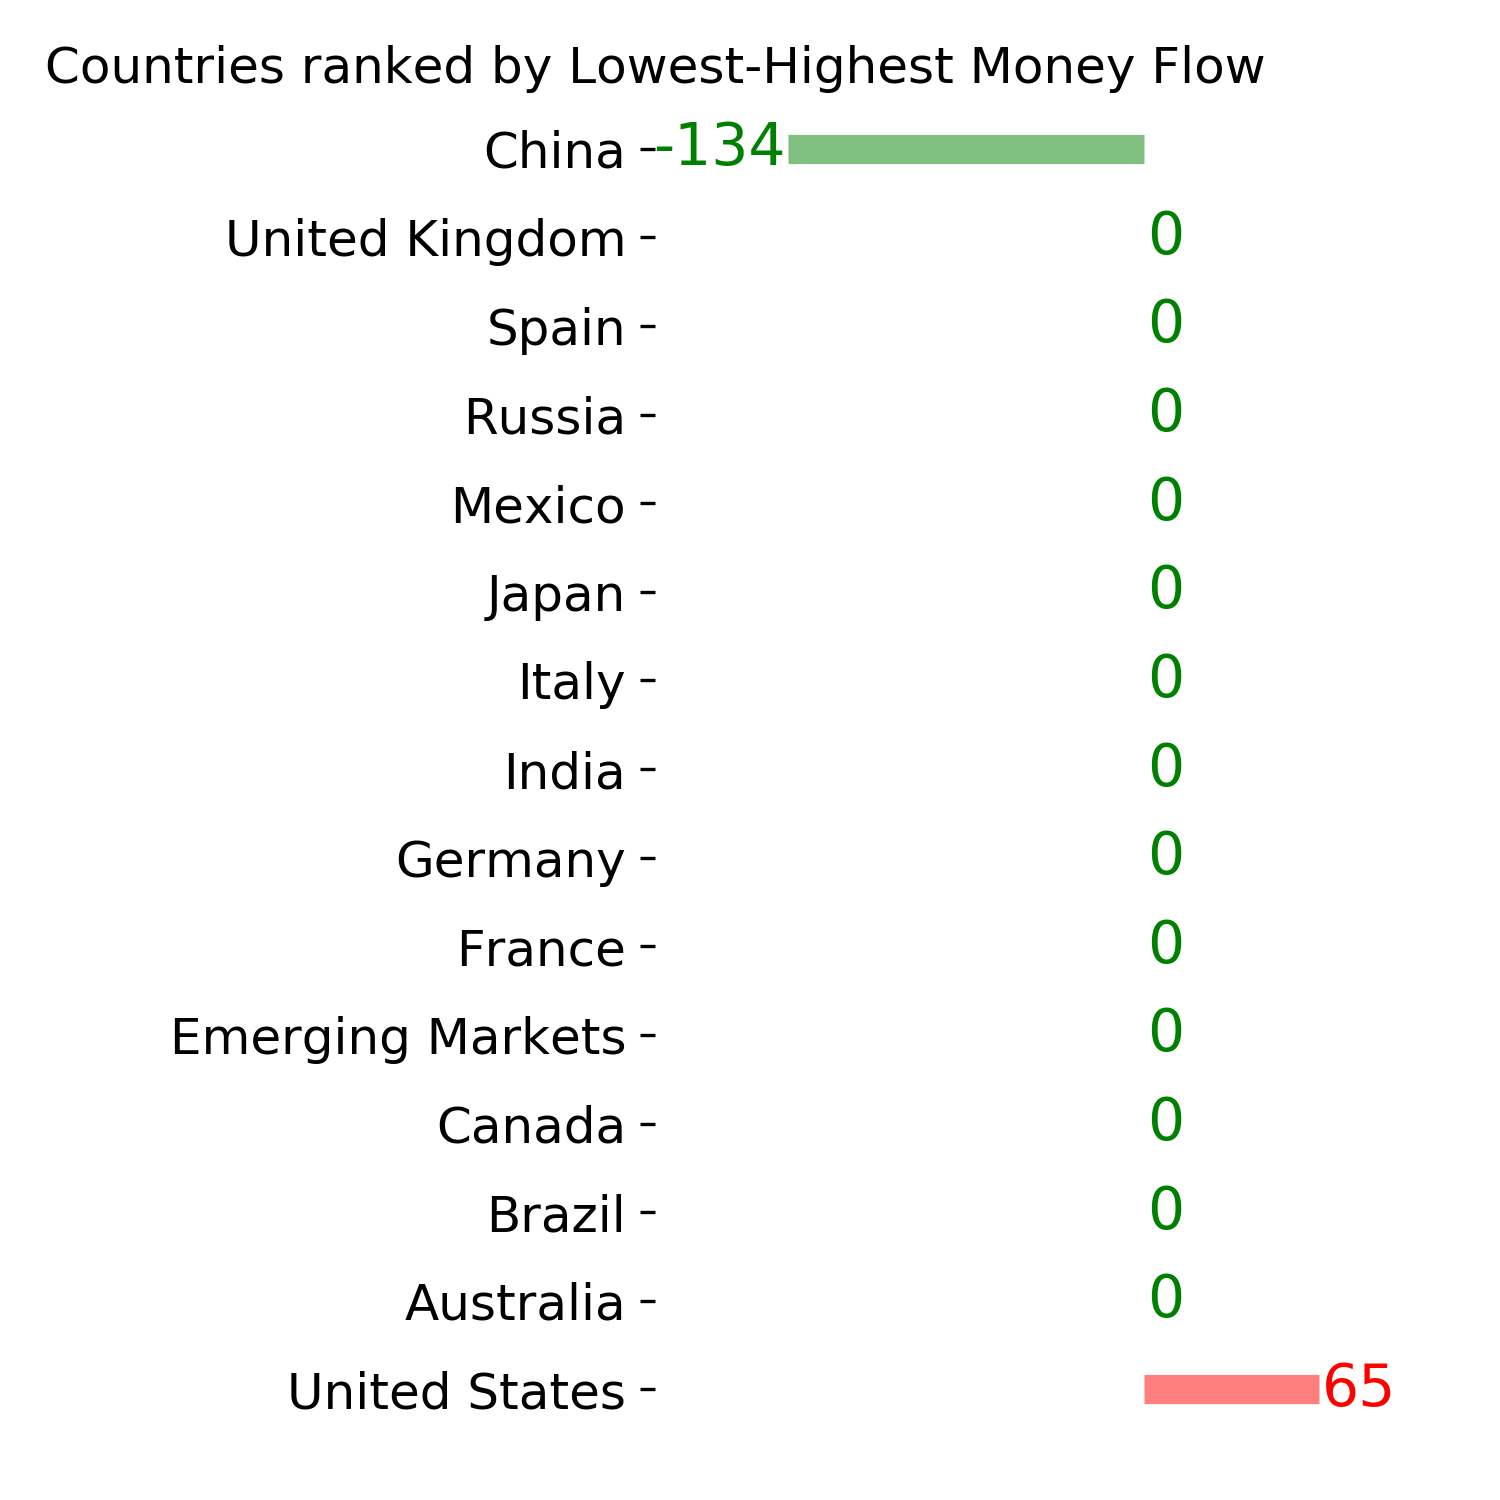
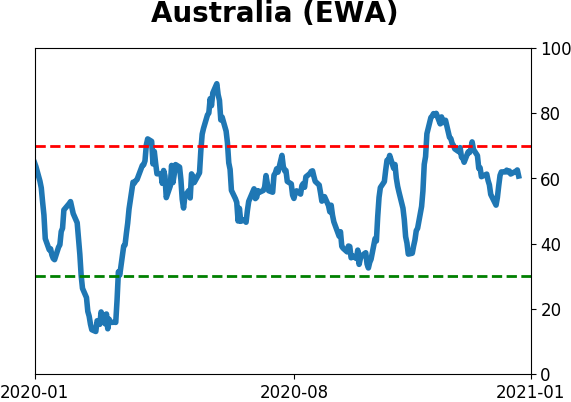
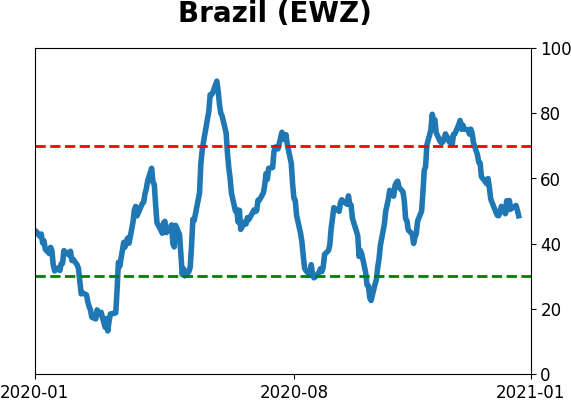
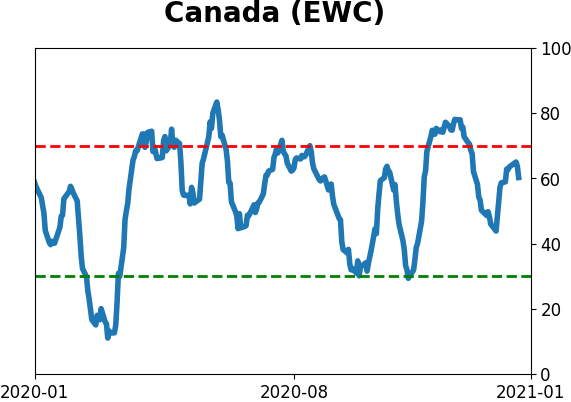
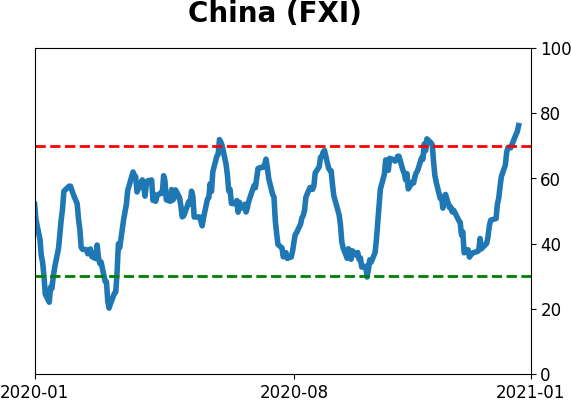
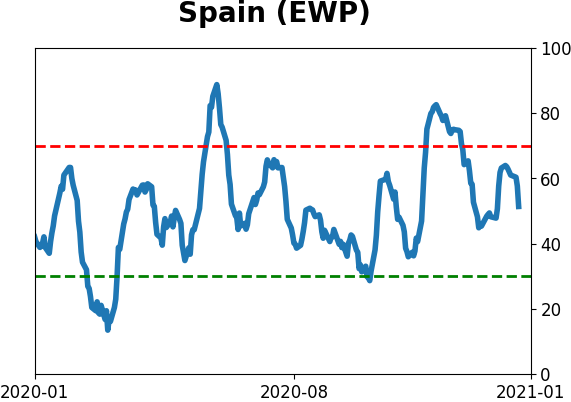
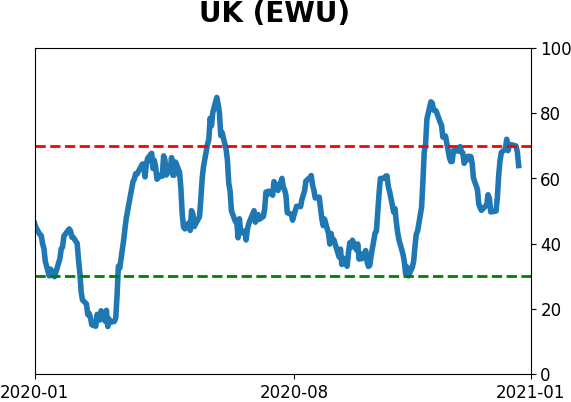
Country ETF's - 10-Day Moving Average
|
|
|
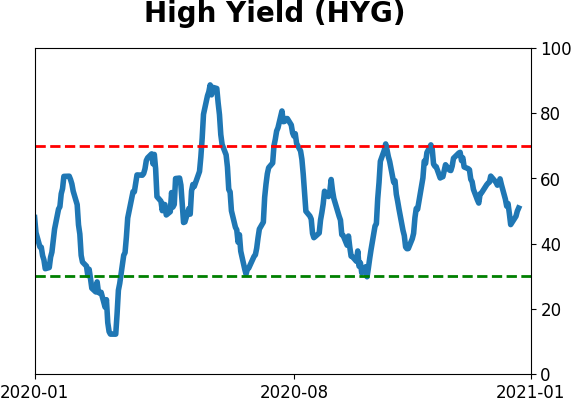
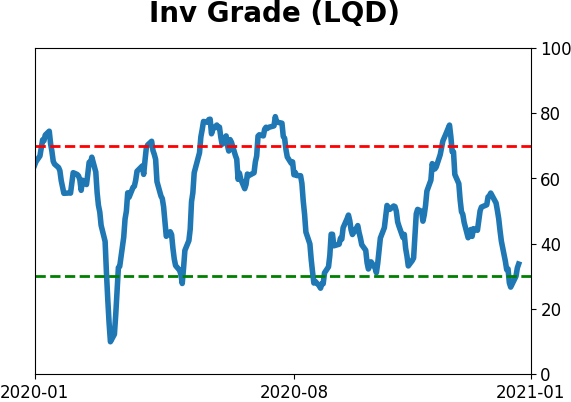
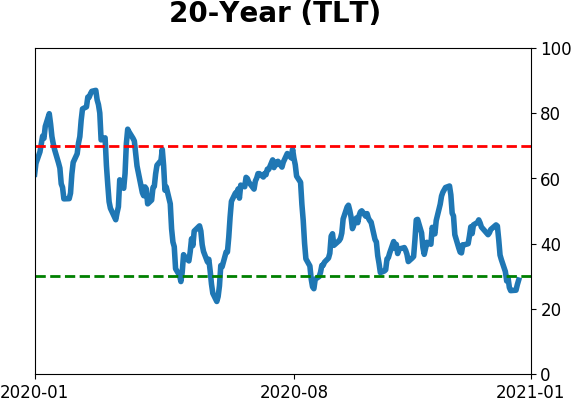
Bond ETF's - 10-Day Moving Average
|
|
|
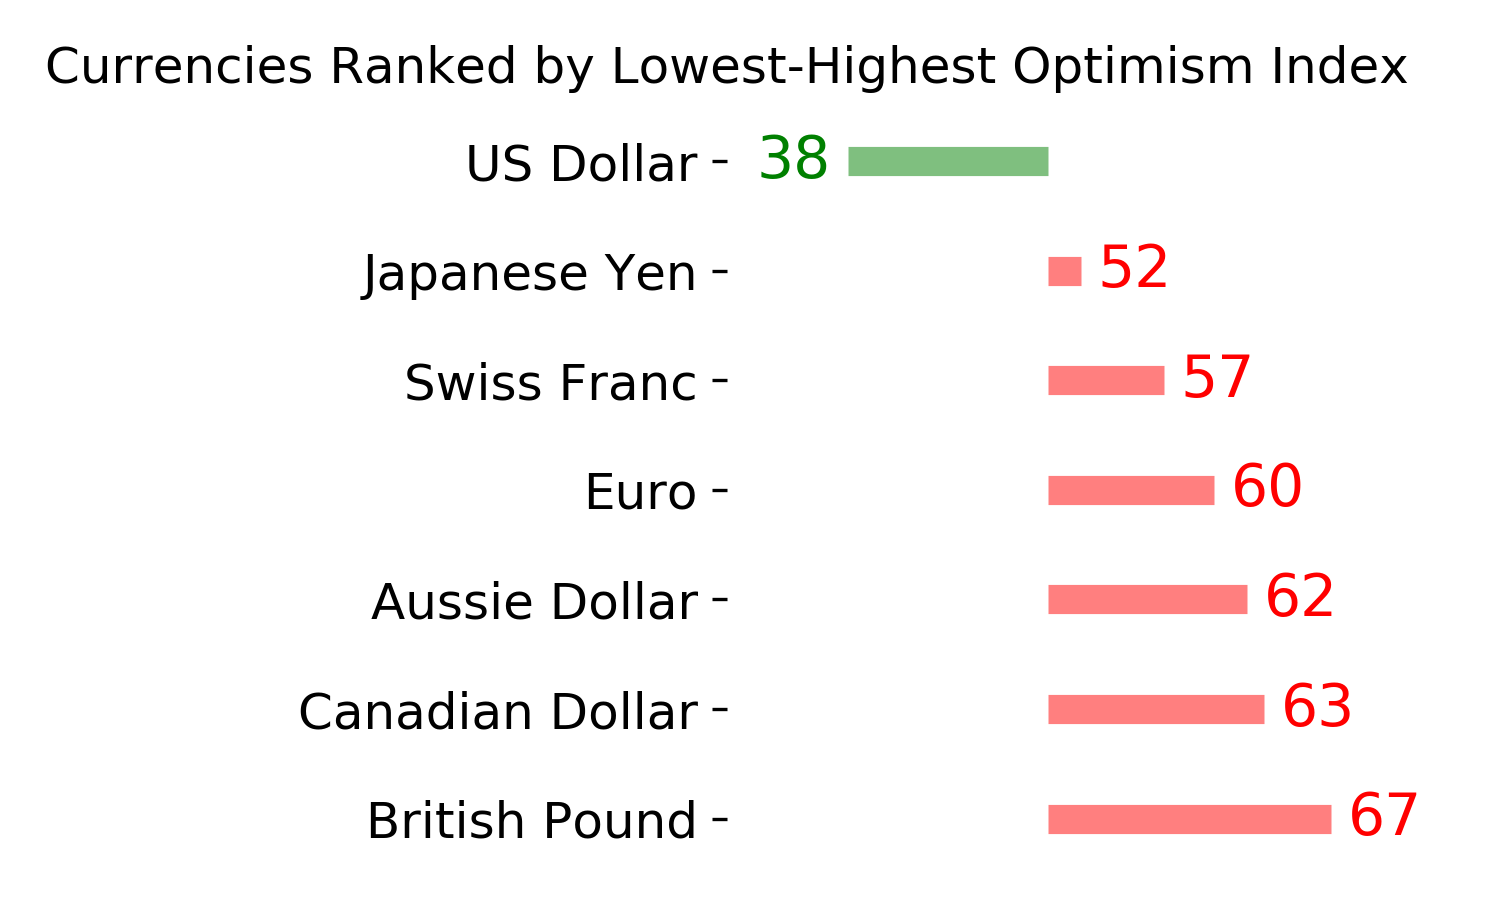
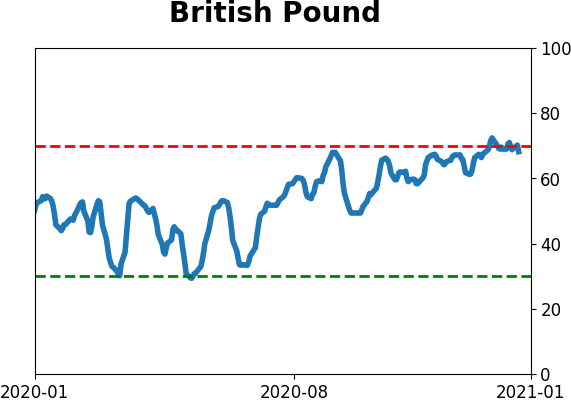
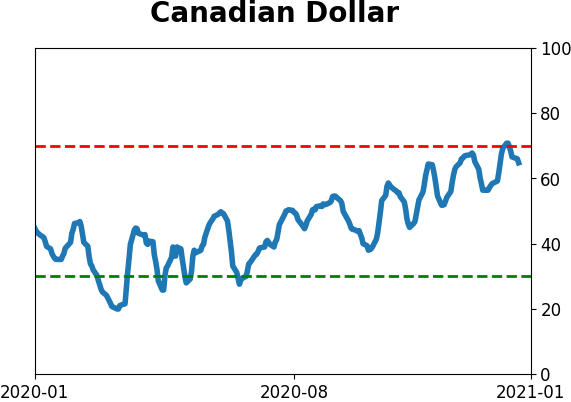
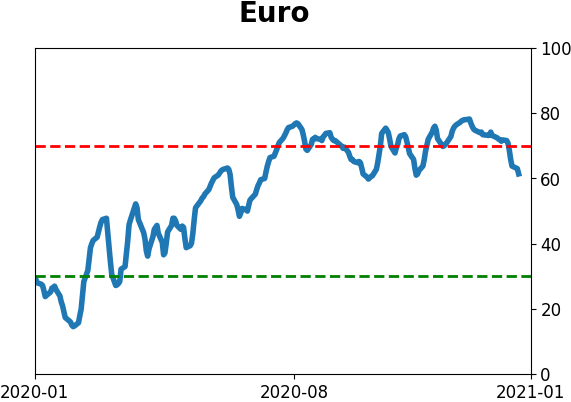
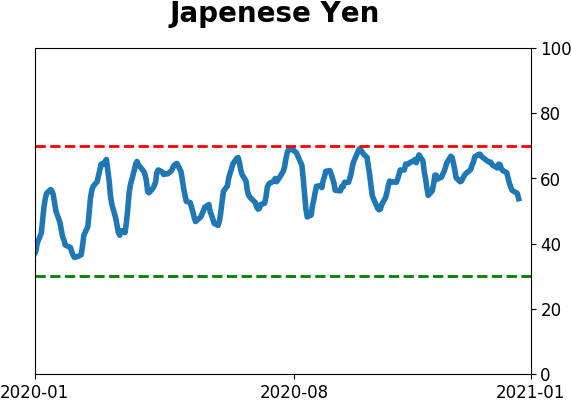
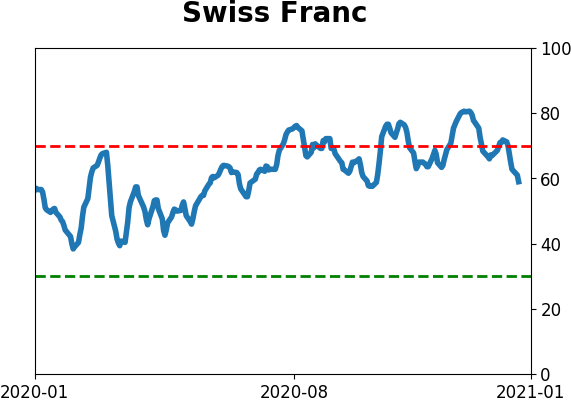
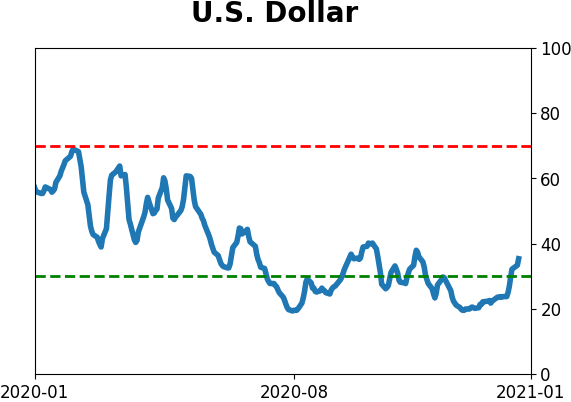
Currency ETF's - 5-Day Moving Average
|
|
|
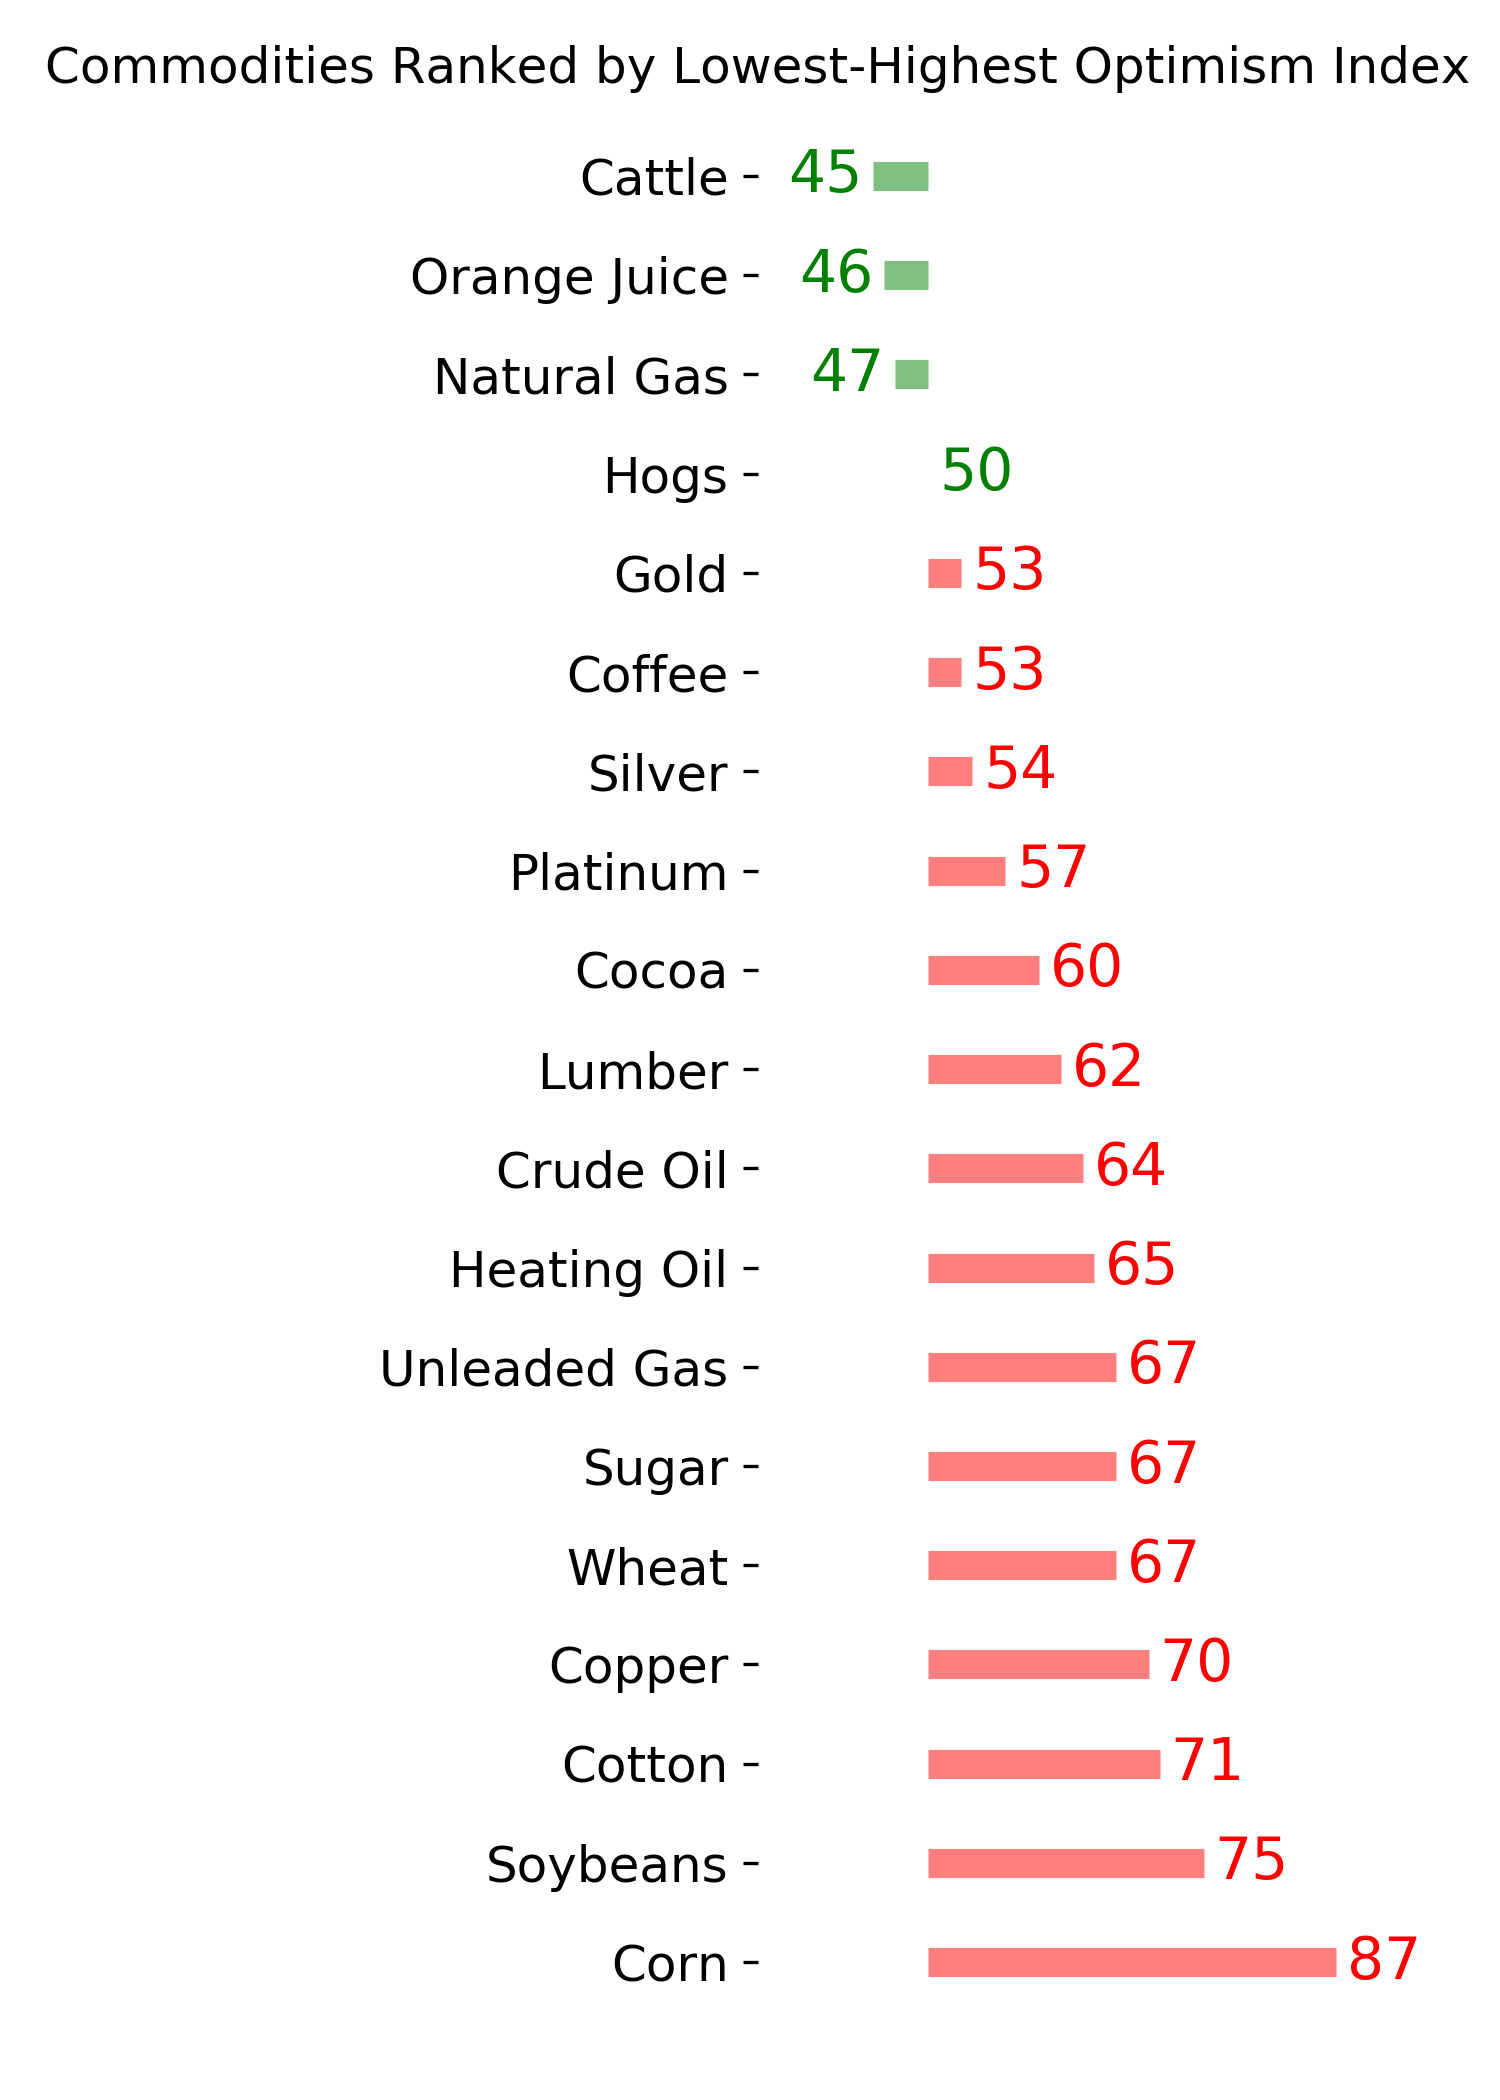
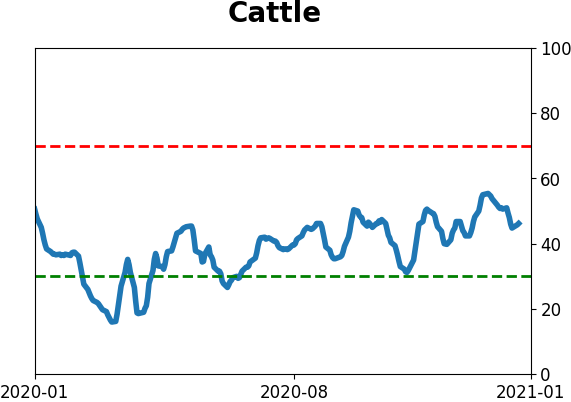
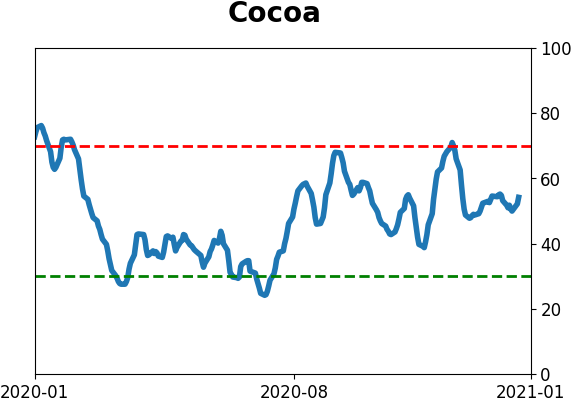
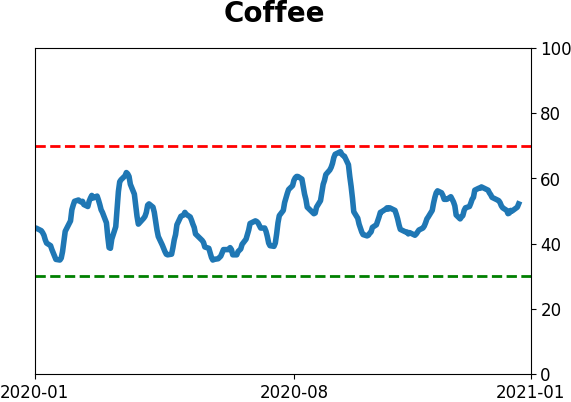
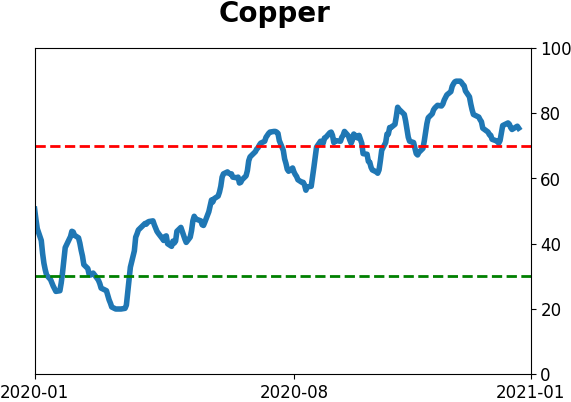
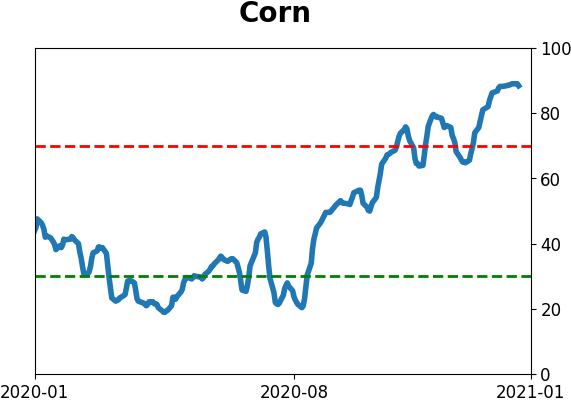
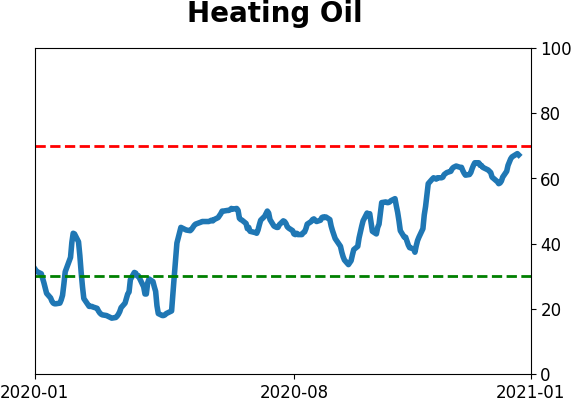
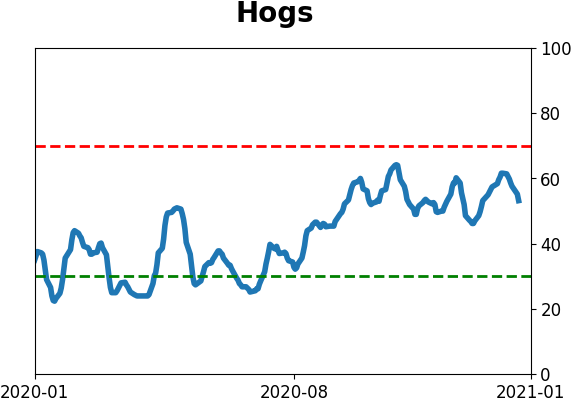
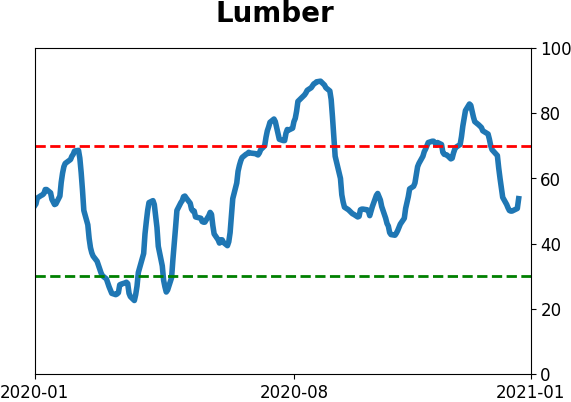
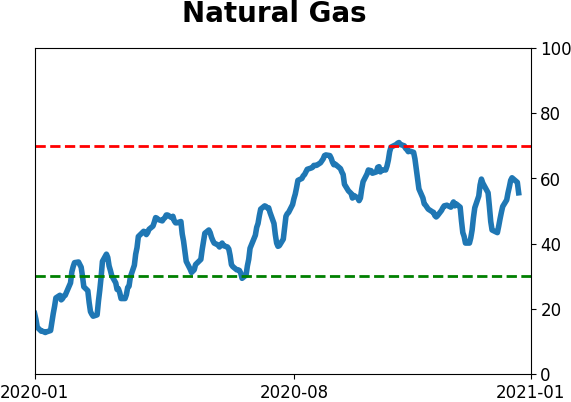
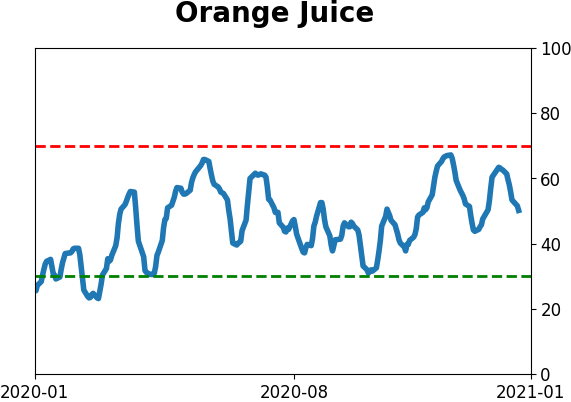
Commodity ETF's - 5-Day Moving Average
|
|