Headlines
|
|
Fund managers are taking a record level of risk:
A monthly survey of fund managers from Bank of America shows a consensus forming around long emerging markets and bitcoin. More troubling, there is a record number of managers currently taking a higher than normal amount of risk.
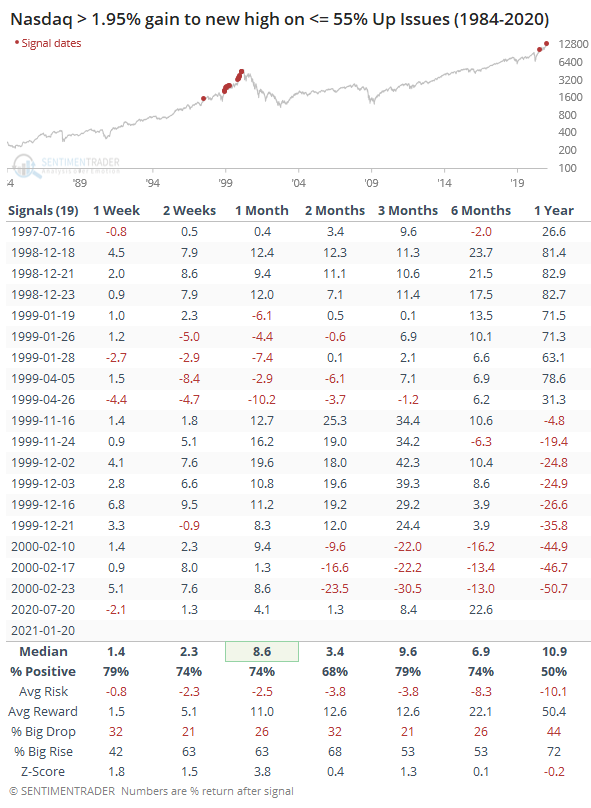
A little issue: Right now, there is an almost perfect dichotomy between market environment and sentiment. The environment has been pristine, with very few cracks under the surface. That type of activity consistently leads to higher prices. Sentiment is almost universally extreme, the type of activity that consistently leads to lower prices. The outlook for stocks will shift decidedly negative if and when there are cracks in the environment, such as the major indexes masking deterioration under the surface. This is a very minor issue, but the Nasdaq's big gain on Wednesday occurred with some of the fewest advancing stocks in 35 years for a similar move. Not enough to be a worry yet, but this is the kind of thing that will make all of those sentiment extremes suddenly a major issue.
Bottom Line:
The market environment is pristine, with only sporadic signs of internal deterioration, but with near-historic optimism, gains tend to be muted, with a high probability of being reversed at some point over the ensuing weeks. | Other Sectors and Assets |
| | Positives | Negatives | | 1. Energy (here, here, and here) | 1. Skewed tech (here and here) |
|
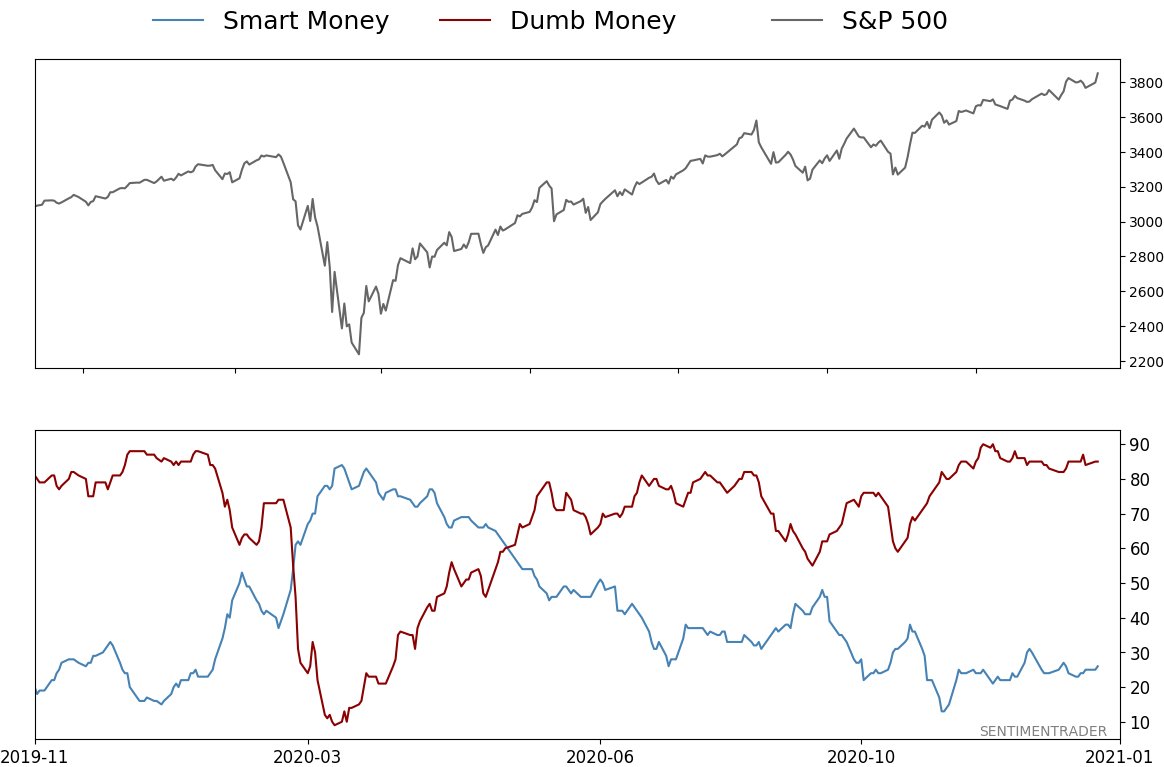
Smart / Dumb Money Confidence
|
Smart Money Confidence: 26%
Dumb Money Confidence: 85%
|
|
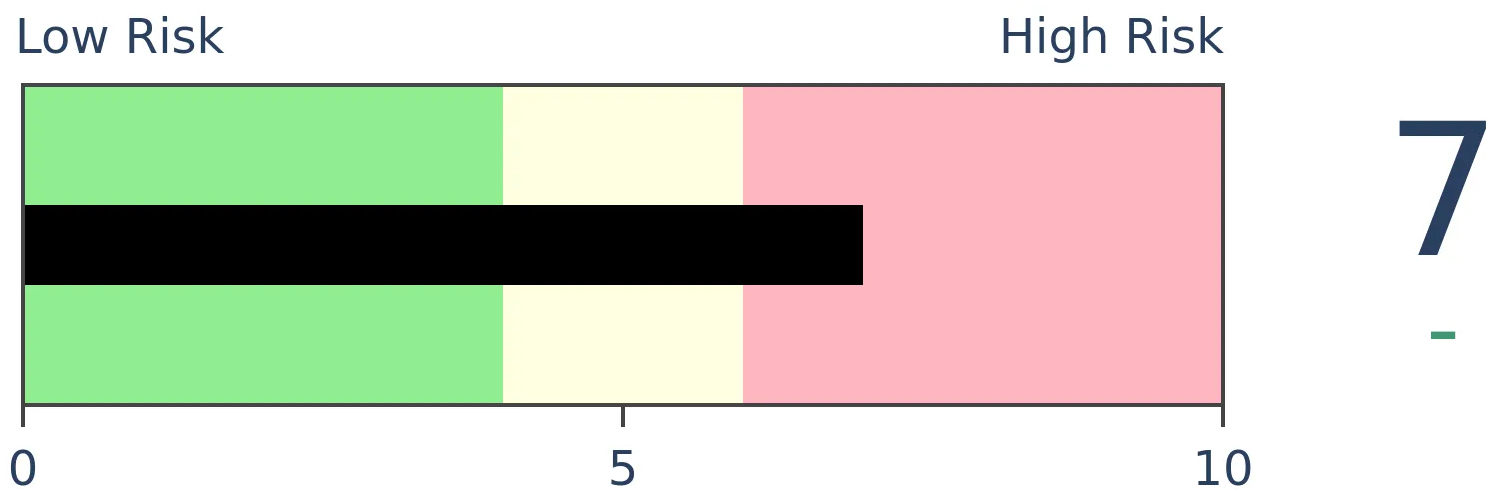
Risk Levels
Stocks Short-Term
|
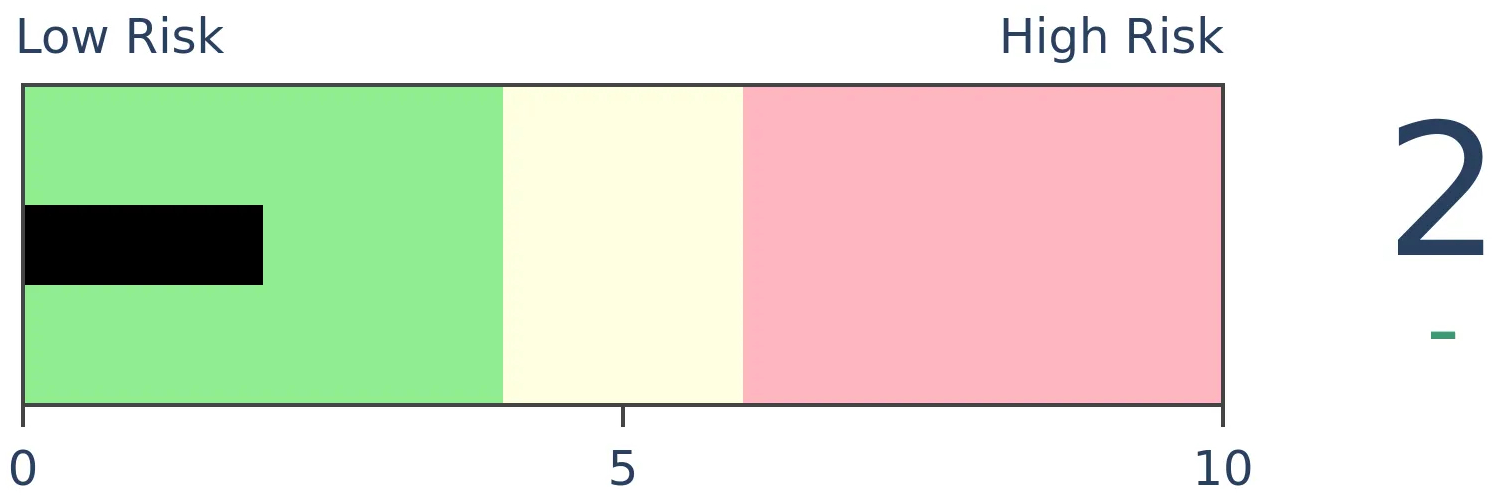
Stocks Medium-Term

|
|
Bonds
|
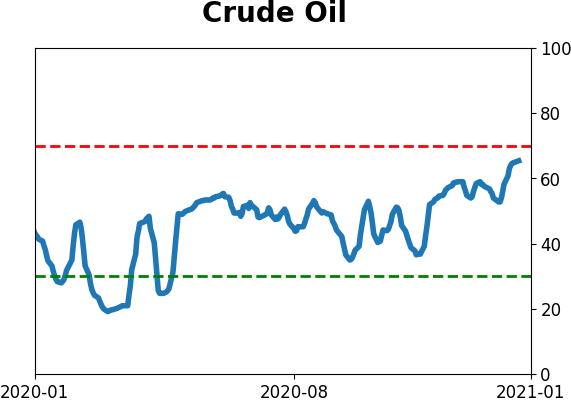
Crude Oil

|
|
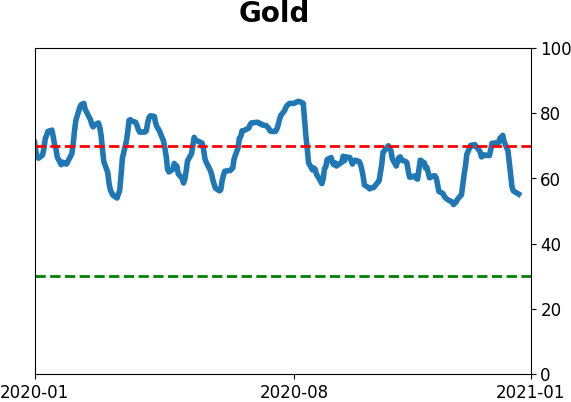
Gold

|
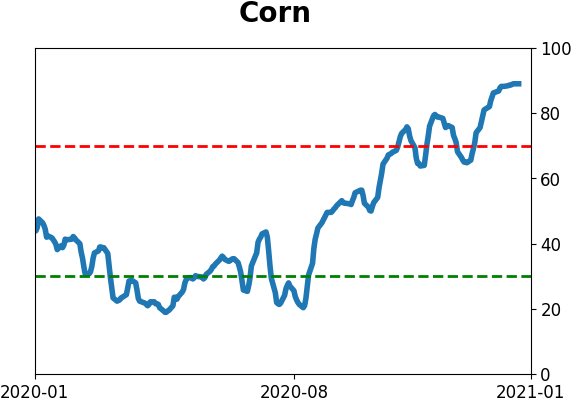
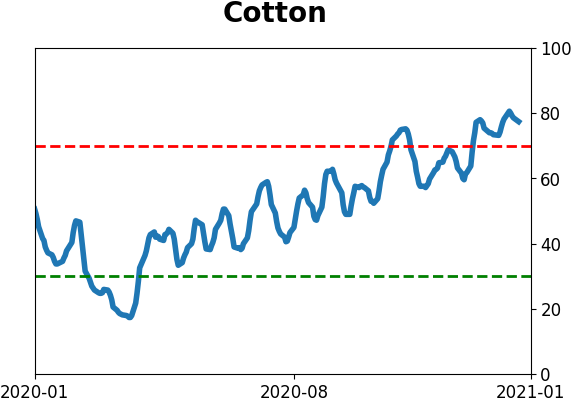
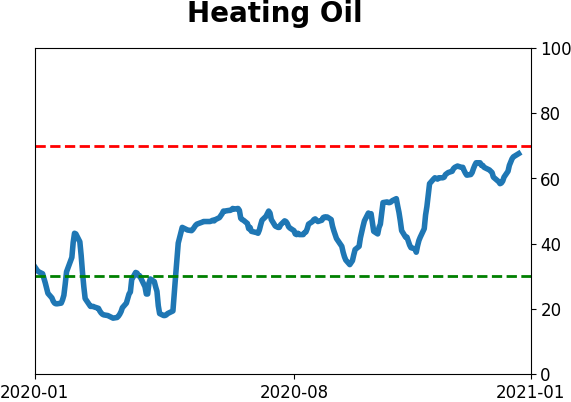
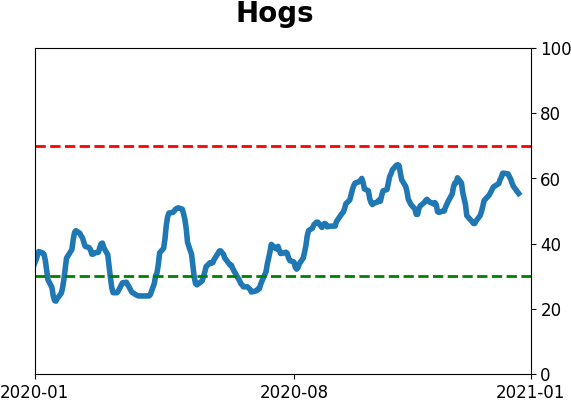
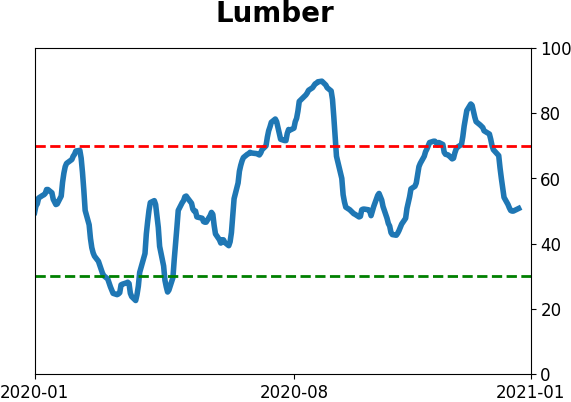
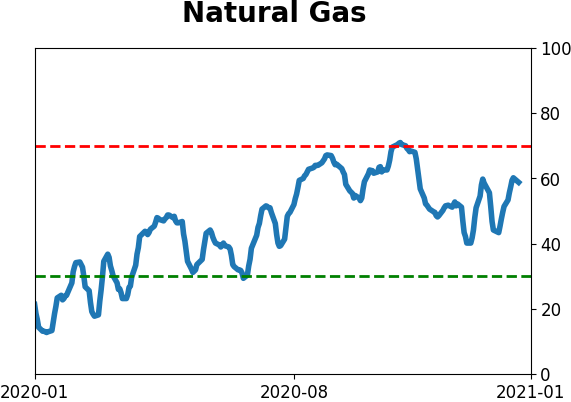
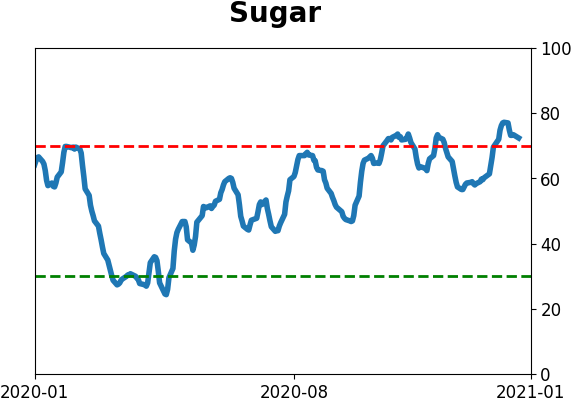
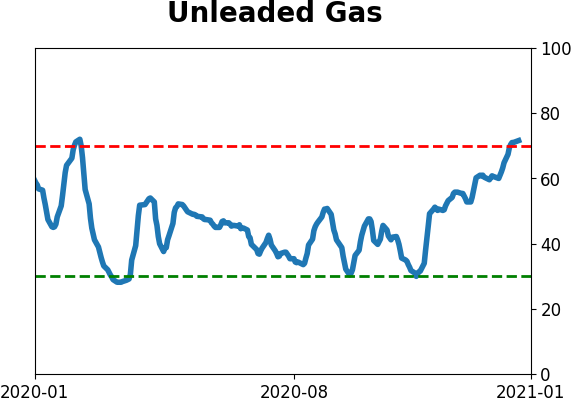
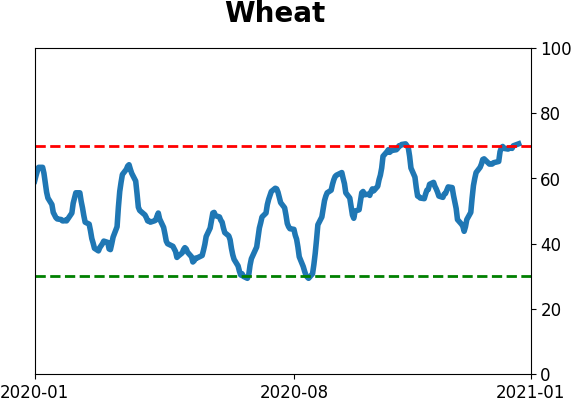
Agriculture
|
|
Research
BOTTOM LINE
A monthly survey of fund managers from Bank of America shows a consensus forming around long emerging markets and bitcoin. More troubling, there is a record number of managers currently taking a higher than normal amount of risk.
FORECAST / TIMEFRAME
None
|
Each month, Bank of America posts a survey to its clients, covering around $560 billion under management.
We've looked at the survey many times in the past, with the conclusion that it tends to have a slight, and inconsistent, contrary bias. This may be very smartest of money, but extremes in group-think among any population can be an issue.
Through the month ended January 14, managers were the most overweight emerging markets in at least 13 years. At the same time, they dropped their overweight allocation to the U.S., so the spread between them is unusually wide.
Below, we can see the spread in the percentage of managers who are overweight the two markets, along with the ratio of the MSCI Emerging Markets Index to the S&P 500. The red dots highlight those months when the spread was 50% or more like now.
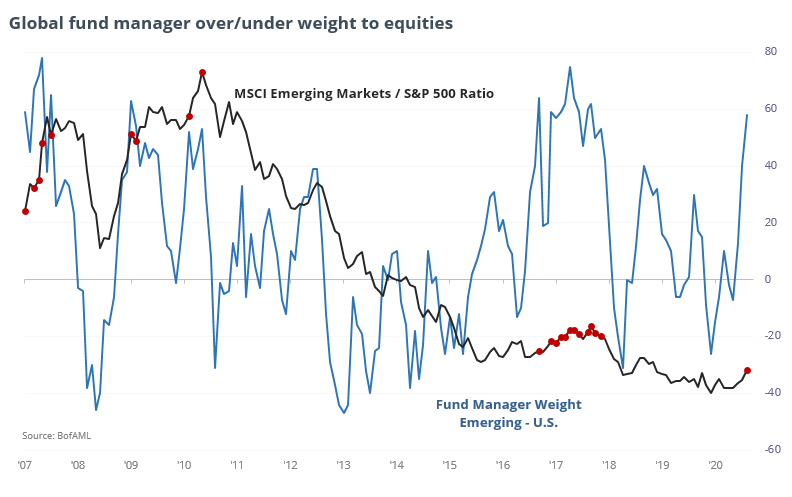
There hasn't been much of a consistent pattern, other than managers tended to increase their overweight toward emerging markets when they had better relative success against the S&P. That's to be expected. The only thing we really care about is whether these extremes led to any consistent pattern going forward, which they didn't. Sometimes emerging markets continued to be a better relative performer, and a few times it preceded a peak in the ratio. Doesn't tell us much, except maybe it's not a good reason to sell emerging markets.
Another notable takeaway from the survey was another jump in risk appetite. About 20% of respondents said they were taking a higher than normal risk, a 20-year high.
We've superimposed that measure against a chart of the S&P 500. It's not perfect but is enough to give us a sense of whether we should be concerned about this level of confidence.
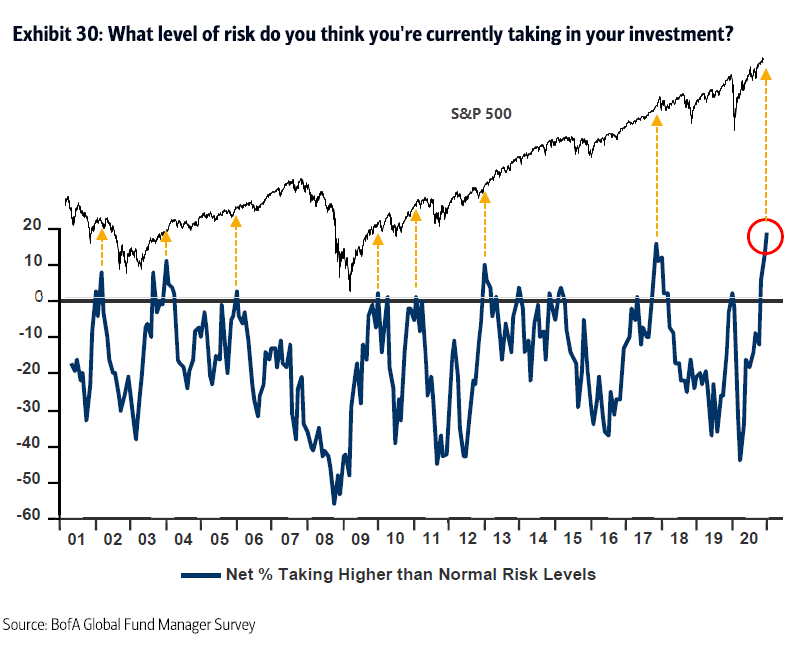
From the chart, the conclusion seems to be, "kind of." Many of the forays into higher-than-normal risk preceded times when the S&P was near a peak or at least a multi-month plateau. It was a complete fail in 2013 as stocks entered a creeper uptrend, but other than that was a pretty effective warning sign.
Another one of their popular visuals is which market these managers feel is the most crowded trade. This month, it was being long bitcoin.
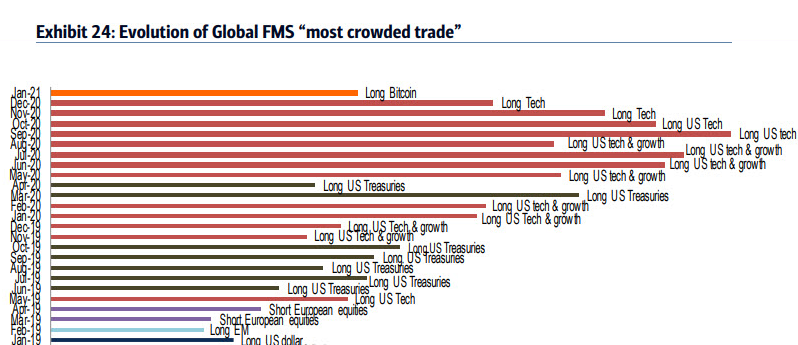
That market was chosen as the most crowded twice before, in September and December 2017. NOTE: This was edited after initial publication to add the September 2017 date.
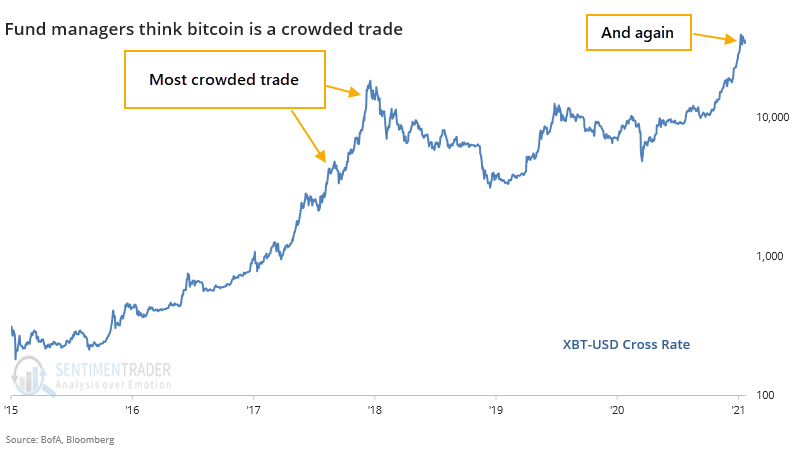
In September, we looked at how effective it would have been to take the opposite side of the most crowded trade every month, going back about 8 years. The conclusion was "not very," as there was a modest tendency for the most crowded trade to get even more crowded in the months ahead. That previous pick of bitcoin stands out as the all-time best fade among all the picks, but overall it has not been profitable to fade a market just because these managers thought it was the most one-sided market.
Overall, the survey is a minor cause for worry. The confidence expressed by how many managers are taking higher than normal risk is the biggest culprit, as it has a decent track record of being a contrary indicator. There was also another drop in cash levels to a historically low level, so there isn't much of a cushion if things turn south. If losses mount and clients start to redeem, then without much cash as a buffer, ostensibly the managers would have to sell existing positions, potentially triggering a cascade of selling pressure.
There are plentiful signs of speculation in stocks right now, the setup for a coming fall. We're just not yet seeing the kinds of internal deterioration within indexes or high-yield bonds, or a turn in risk appetite, that typically act as imminent warning signs.
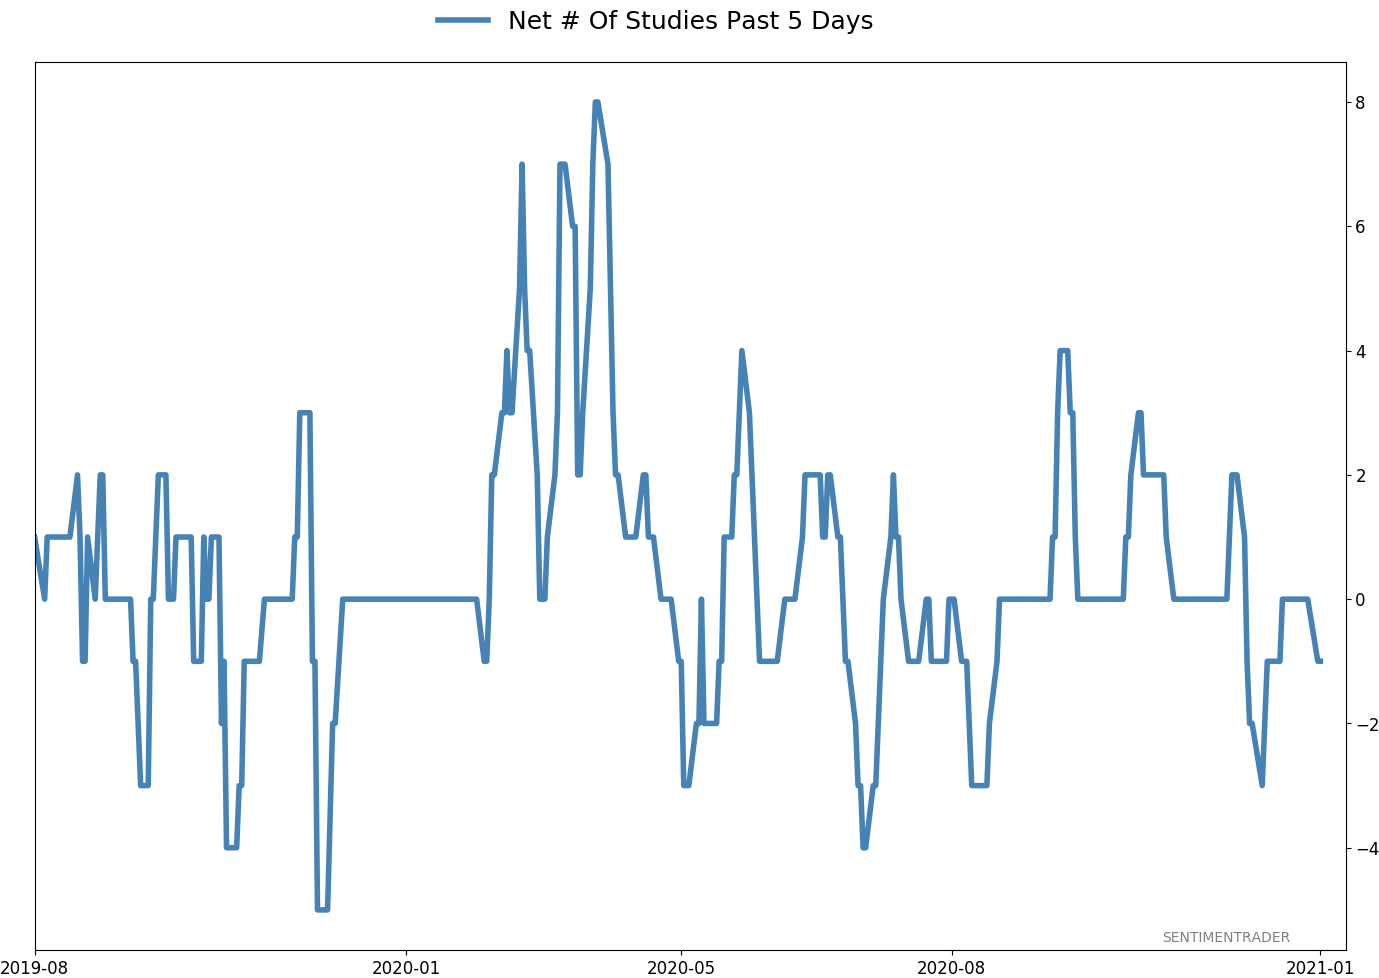
Active Studies
| Time Frame | Bullish | Bearish | | Short-Term | 0 | 0 | | Medium-Term | 2 | 2 | | Long-Term | 14 | 2 |
|
Indicators at Extremes
Portfolio
| Position | Description | Weight % | Added / Reduced | Date | | Stocks | 10.6% VWO, 10.1% XLE, 8.5% RSP, 8.3% PSCE | 37.5 | Added 3% | 2021-01-05 | | Bonds | 10% BND, 10% SCHP, 10% ANGL | 27.8 | Reduced 0.1% | 2020-10-02 | | Commodities | GCC | 2.3 | Reduced 2.1%
| 2020-09-04 | | Precious Metals | GDX | 9.8 | Added 4.8% | 2020-12-01 | | Special Situations | | 0.0 | Reduced 5% | 2020-10-02 | | Cash | | 22.6 | | |
|
Updates (Changes made today are underlined)
There hasn't been much that changed in recent weeks, with sky-high sentiment on many measures receding a bit, but that's not necessarily a good sign, just ask February 2020. We still have the lingering positives from all the breadth thrust last year, as late as October and November. Those have a very good historical record at preceding higher prices over a longer time frame. Of more immediate concern is the explosion in speculation in the most leveraged parts of the market. So far, that hasn't translated to price troubles, though there have been more oddities n the latter half of December than we'd seen since August, like the major indexes rising but on very poor breadth. I continue to avoid tech- and cap-heavy indexes, and don't see that changing any time soon. Energy stocks are doing what they should, and I added a bit more there. I'm not a momentum trader and do not focus on pyramiding positions in this account - it's more about protecting capital - but I like the setup on a long-term time frame. RETURN YTD: 4.6% 2020: 8.1%, 2019: 12.6%, 2018: 0.6%, 2017: 3.8%, 2016: 17.1%, 2015: 9.2%, 2014: 14.5%, 2013: 2.2%, 2012: 10.8%, 2011: 16.5%, 2010: 15.3%, 2009: 23.9%, 2008: 16.2%, 2007: 7.8%
|
|
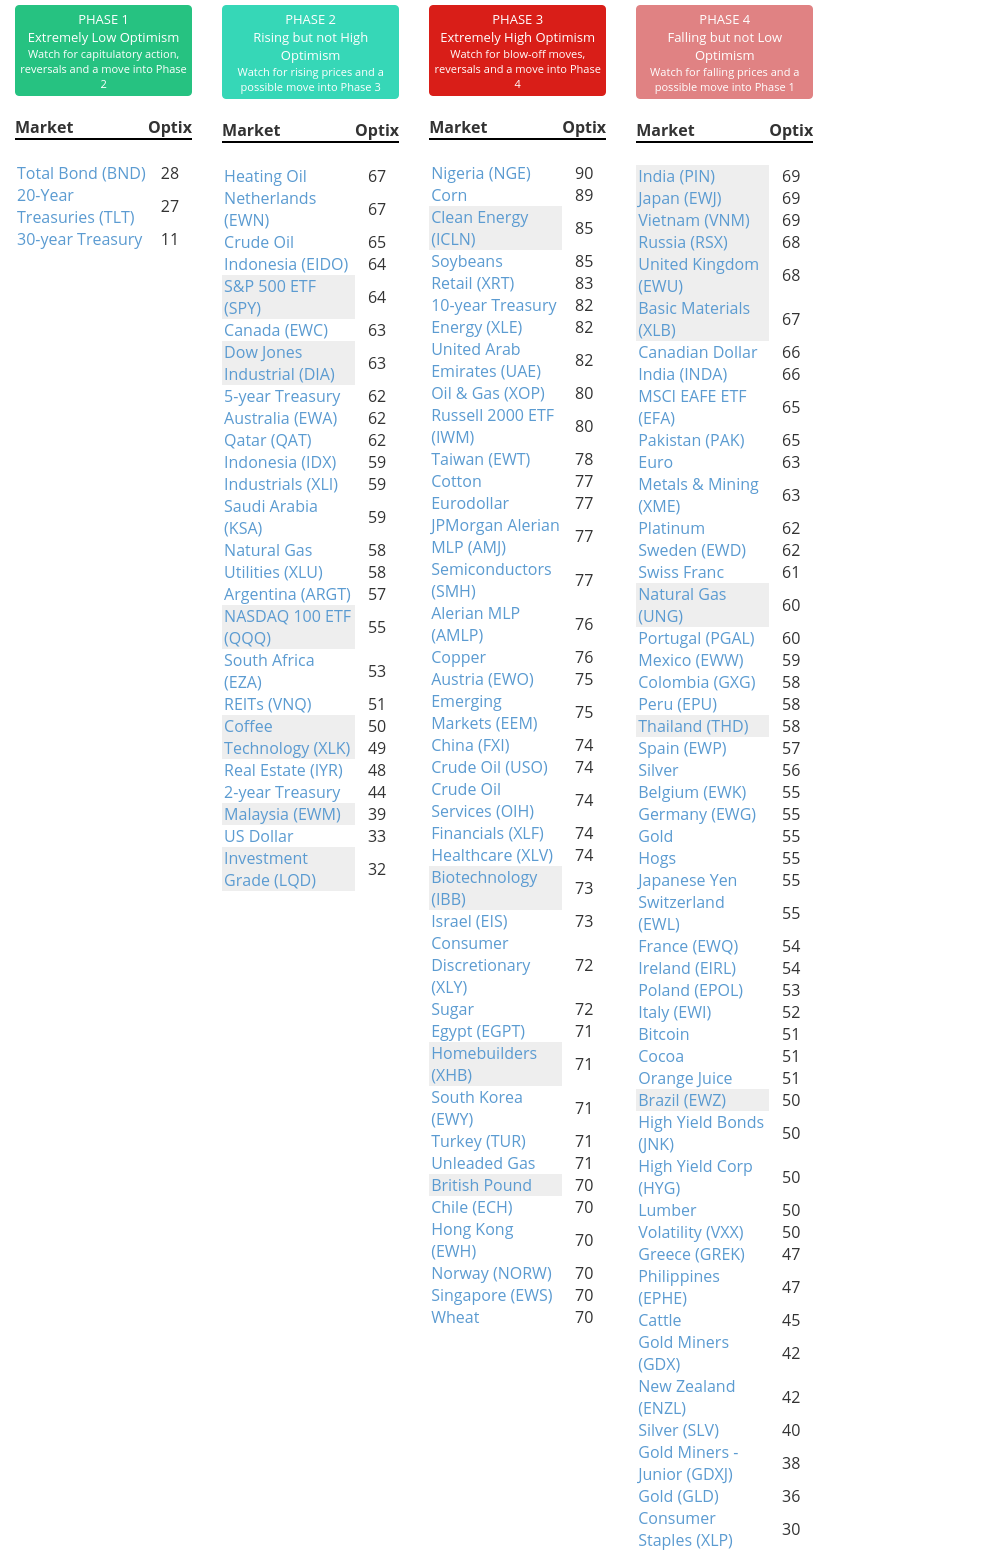
Phase Table
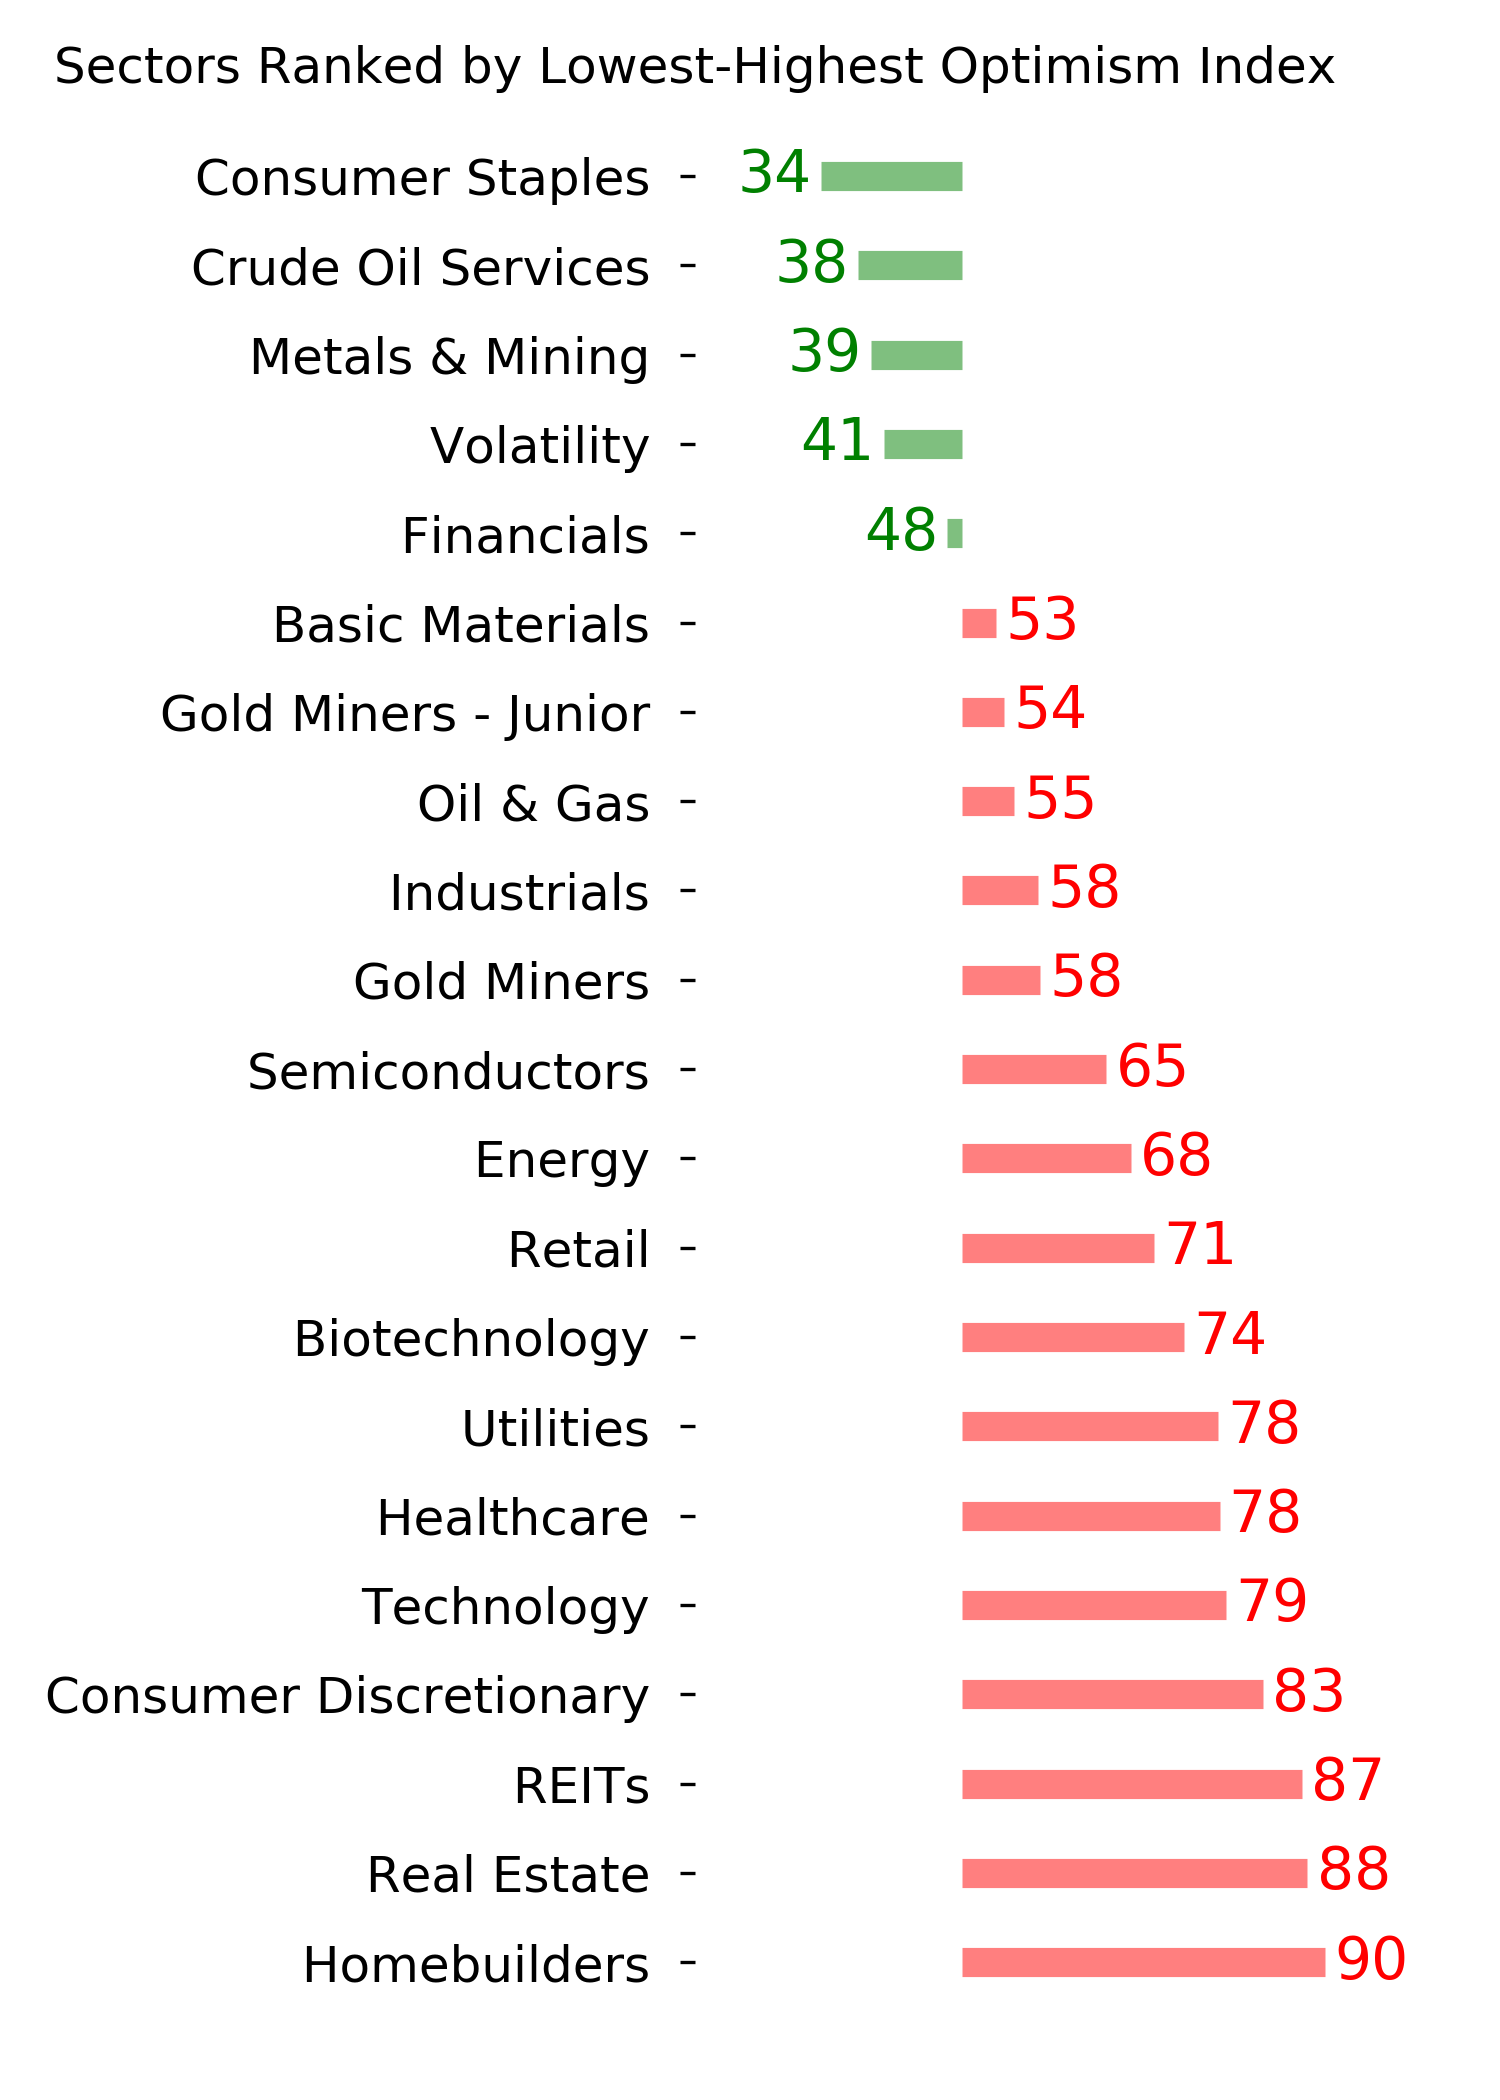
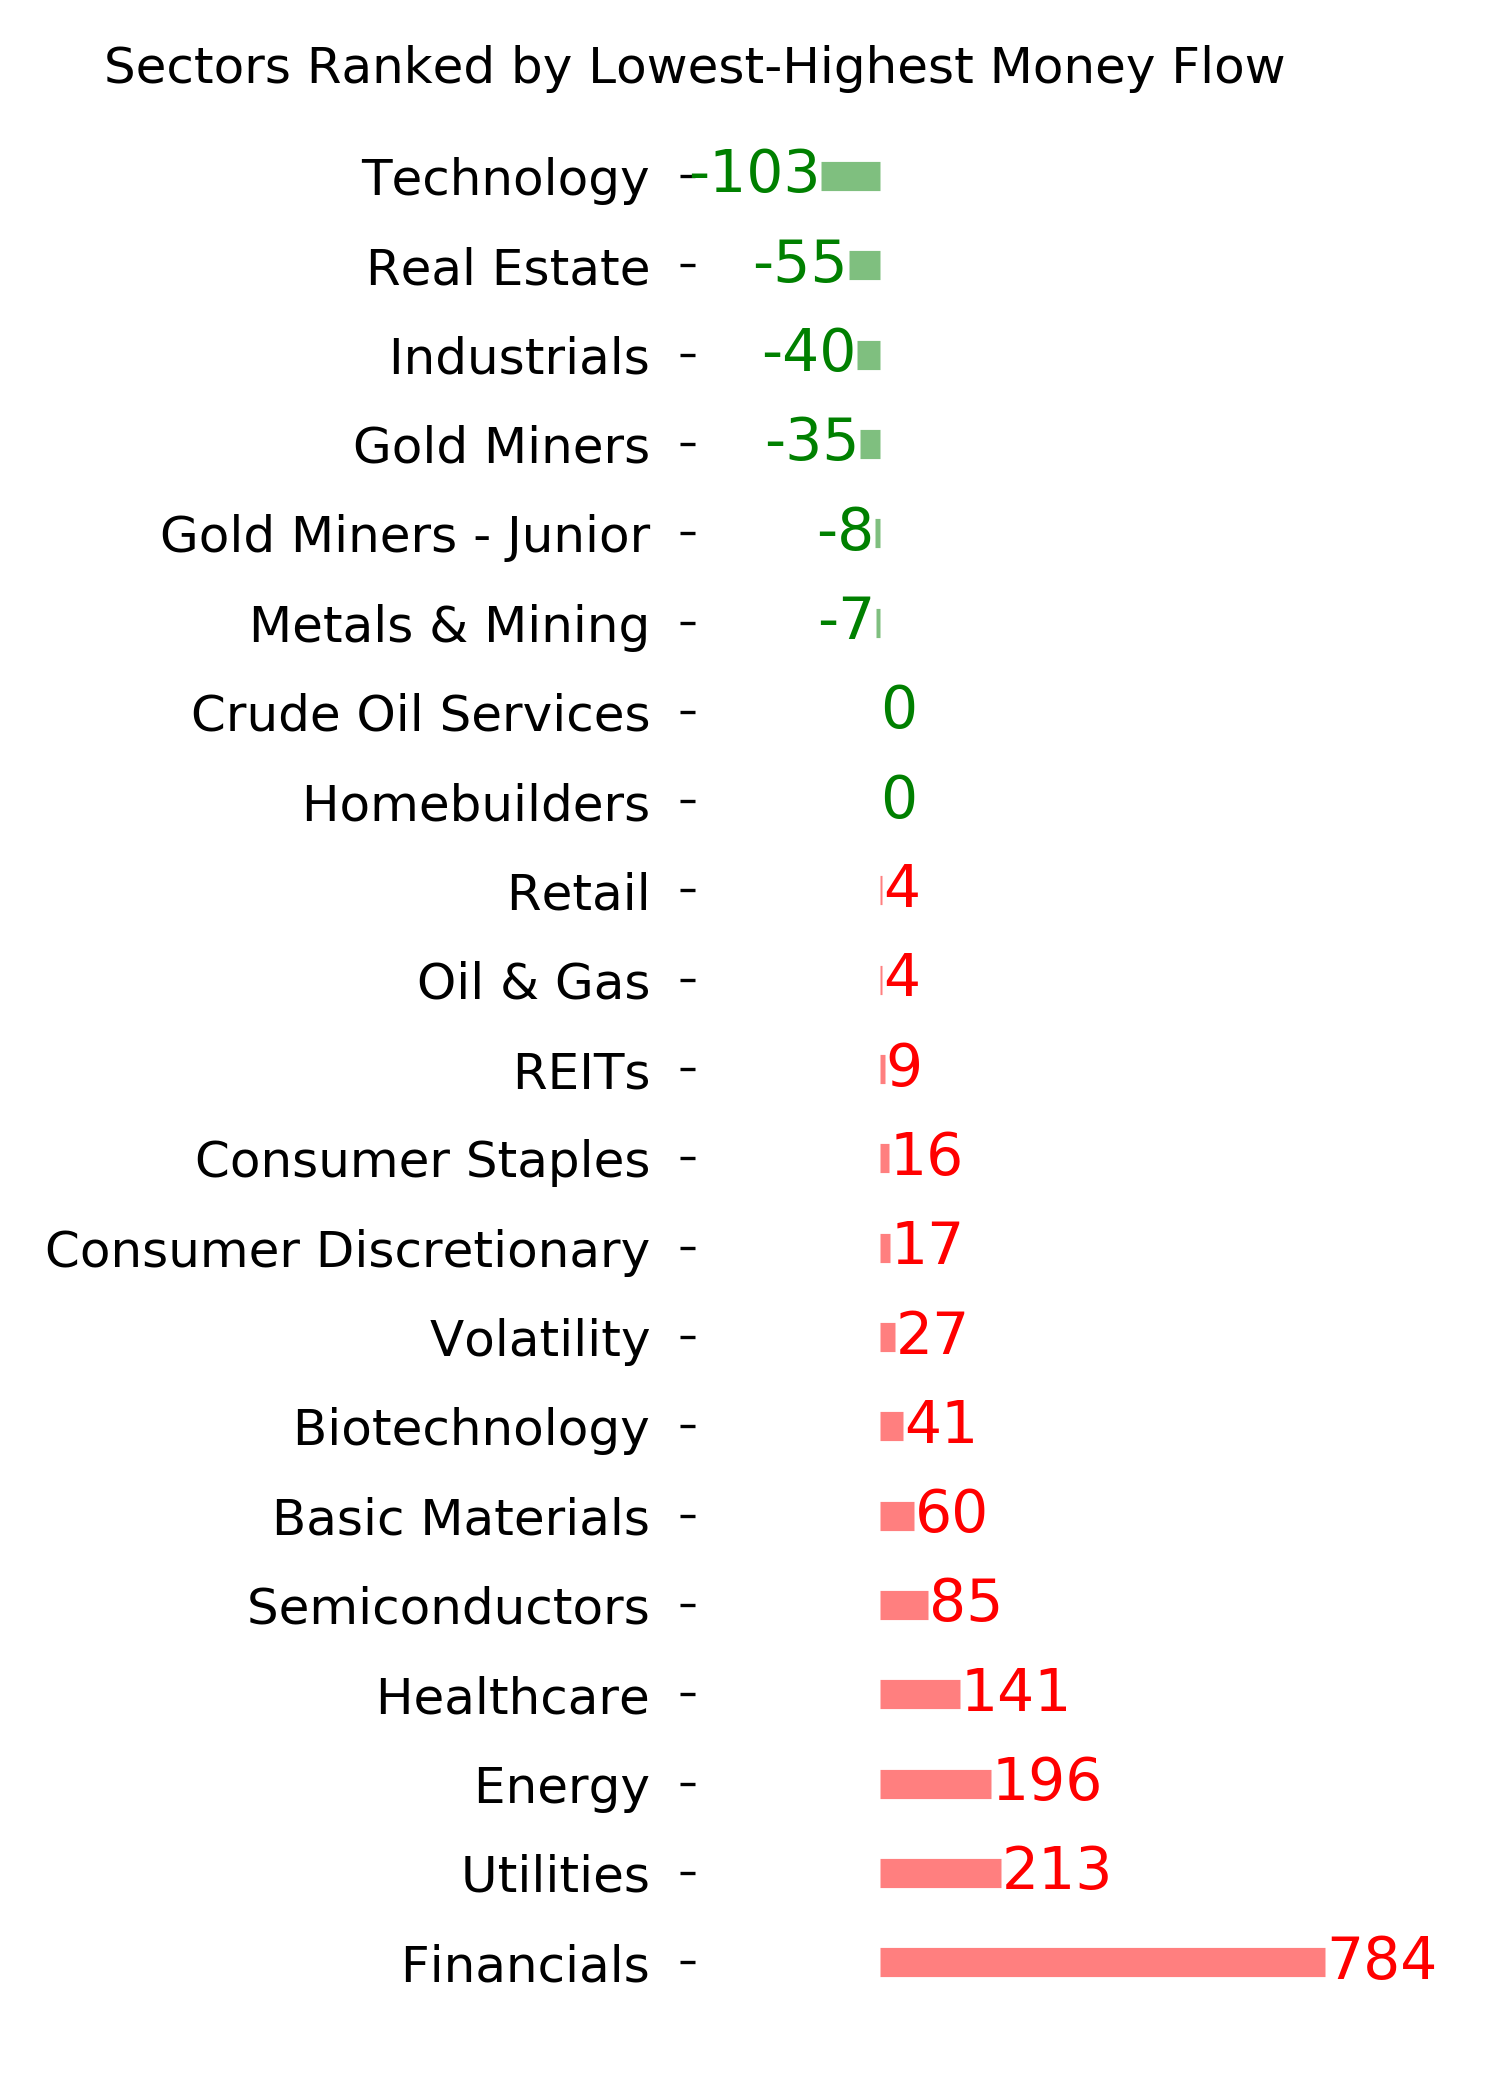
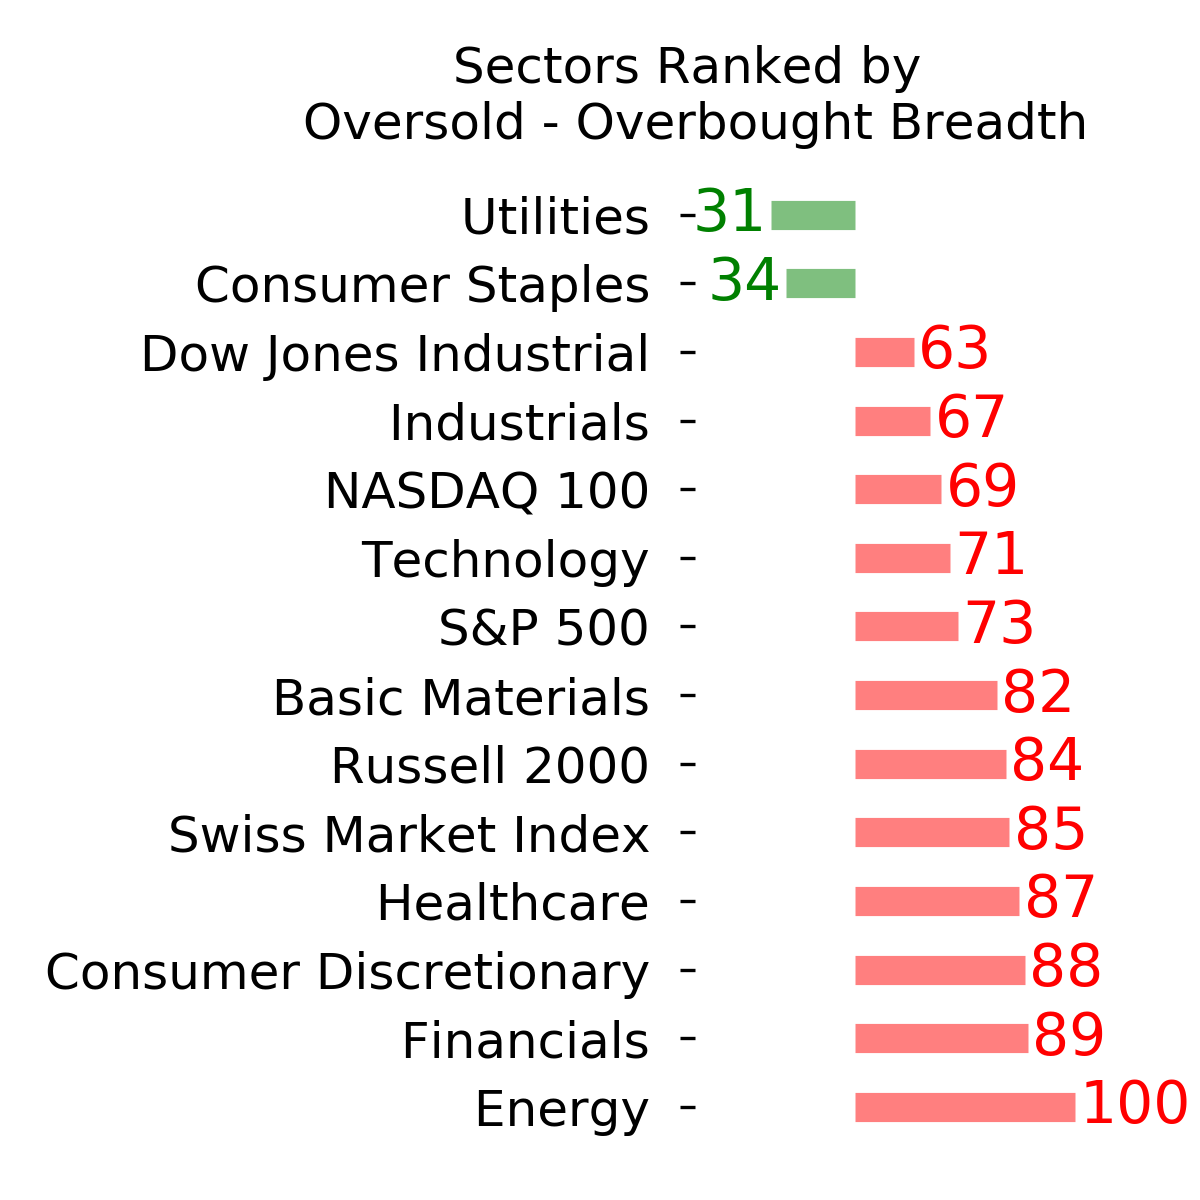
Ranks
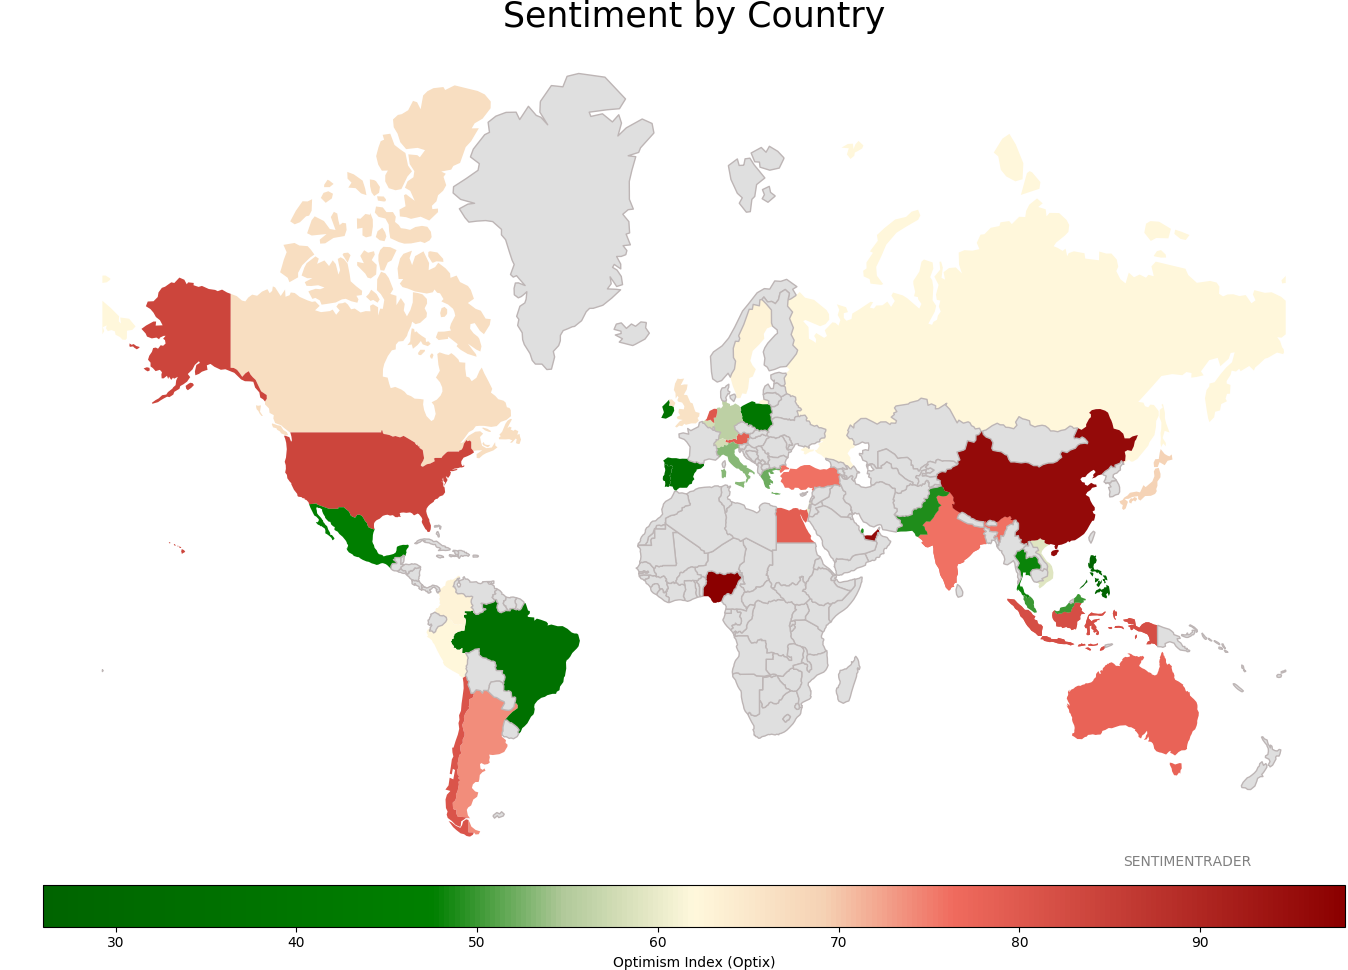
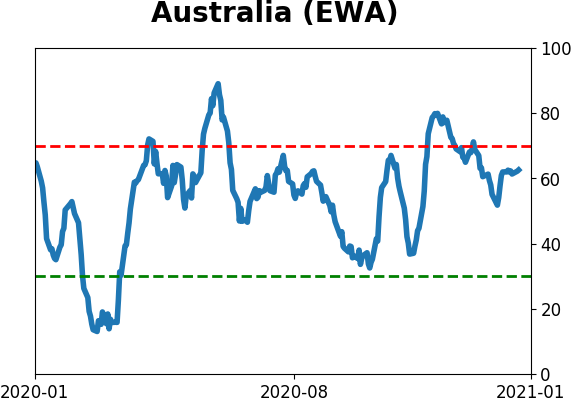
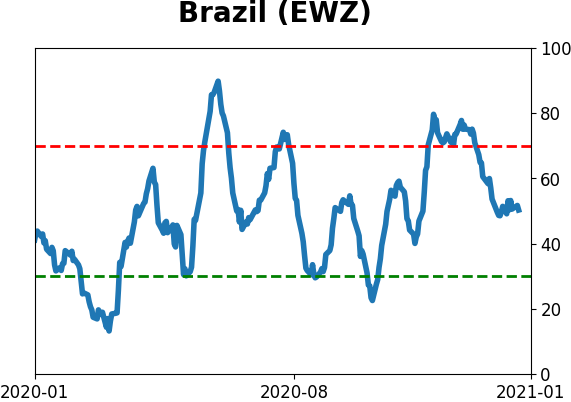
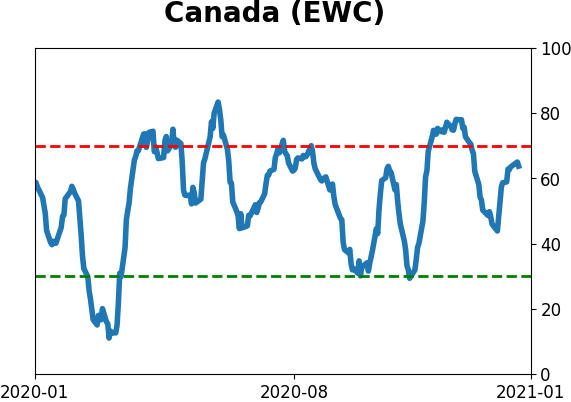
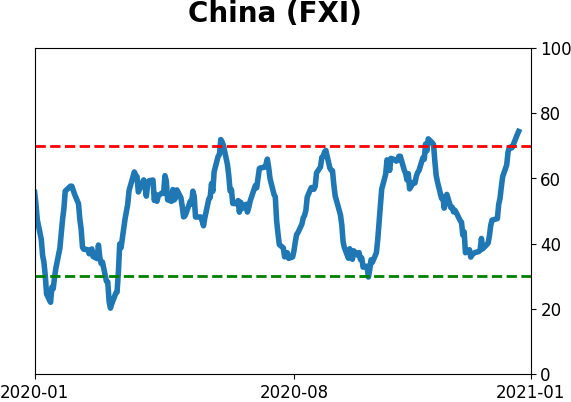
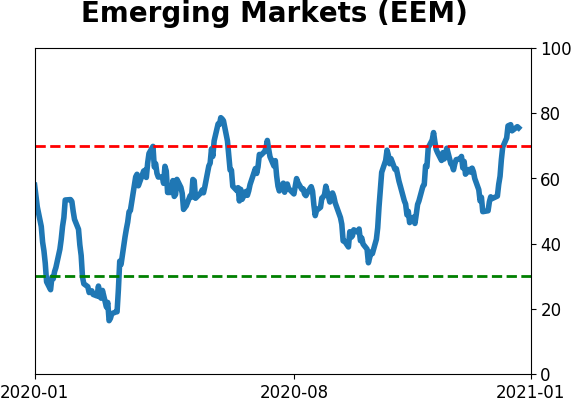
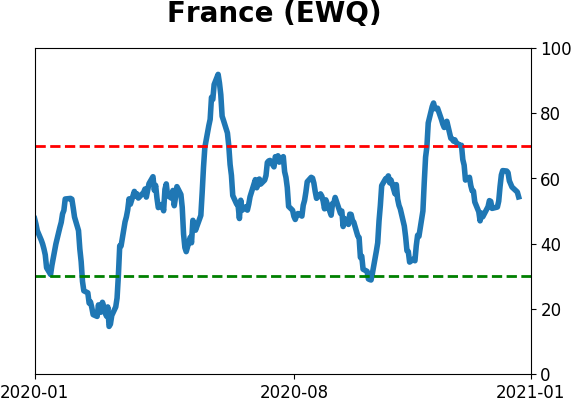
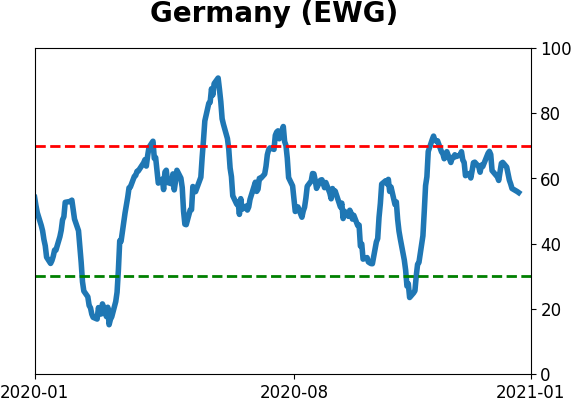
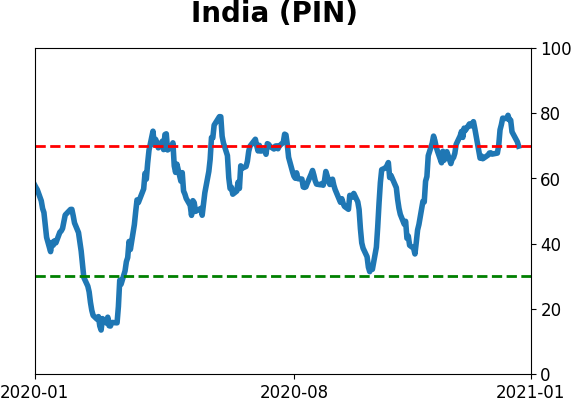
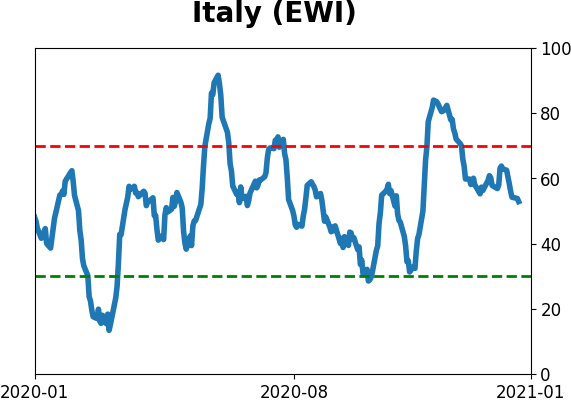
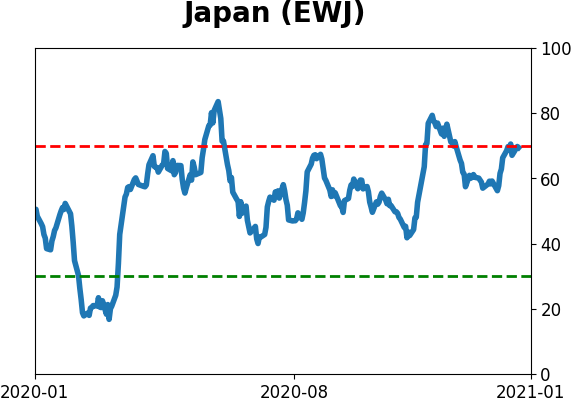
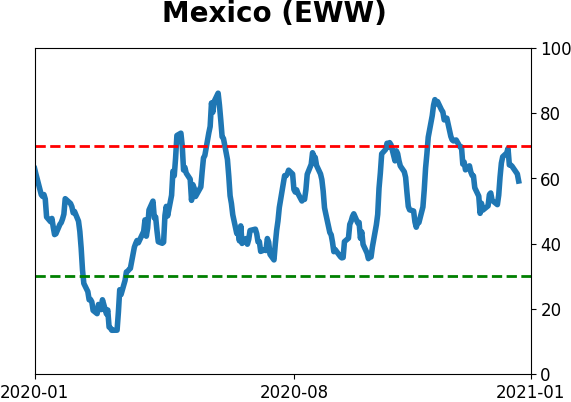
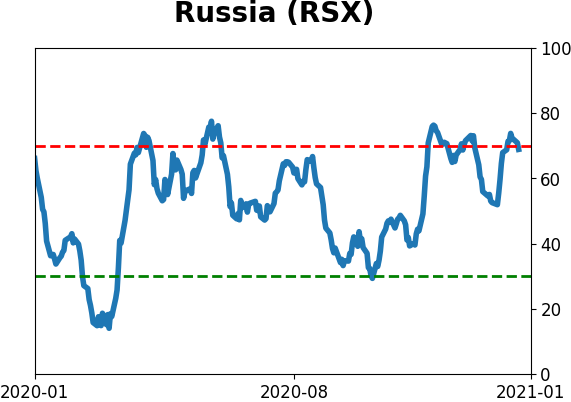
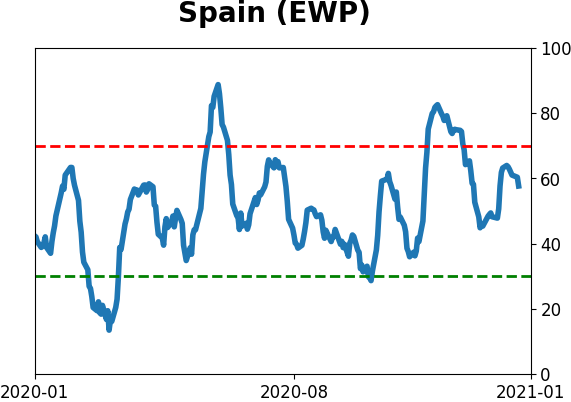
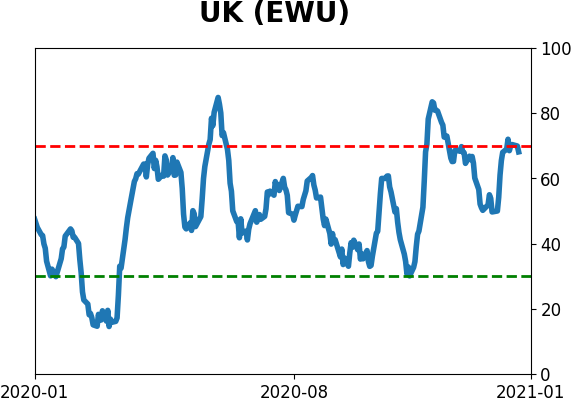
Sentiment Around The World
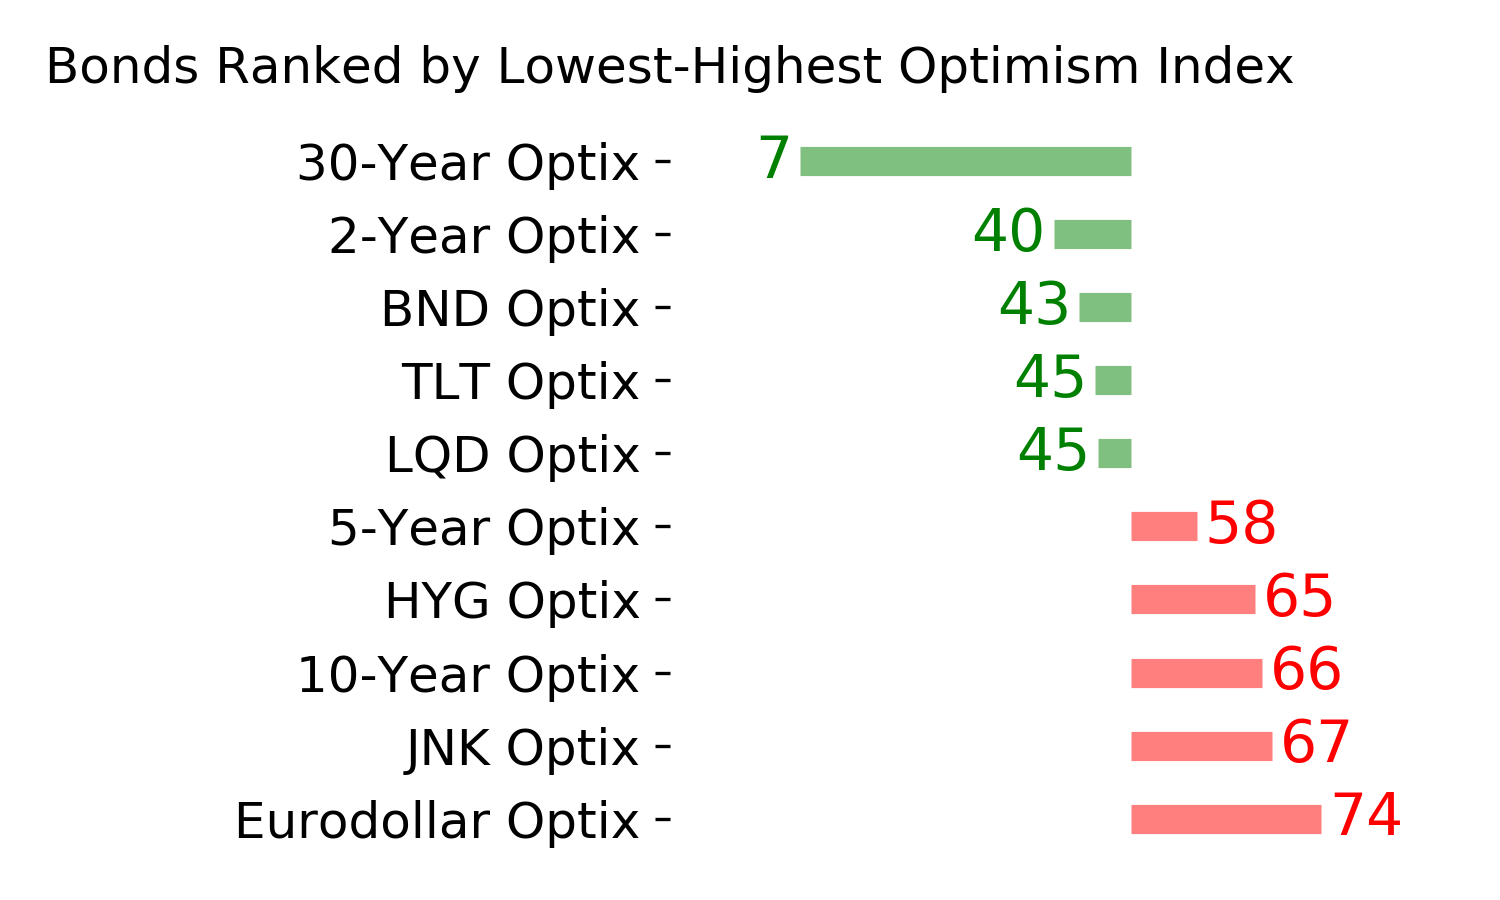
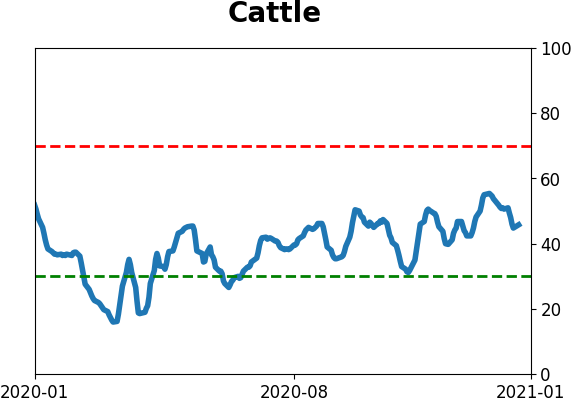
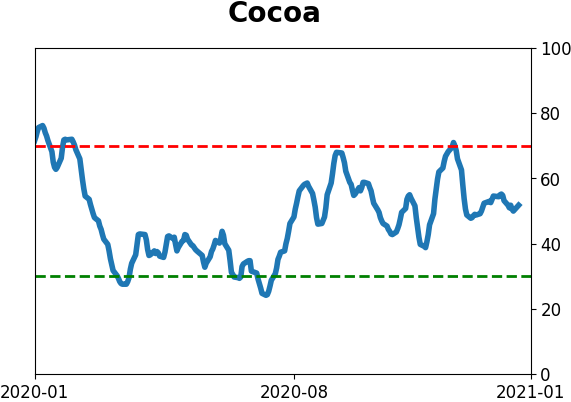
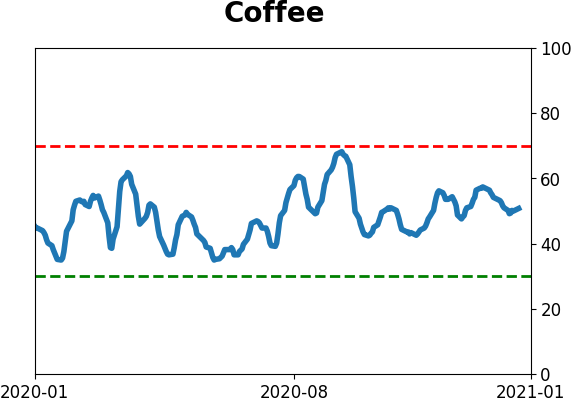
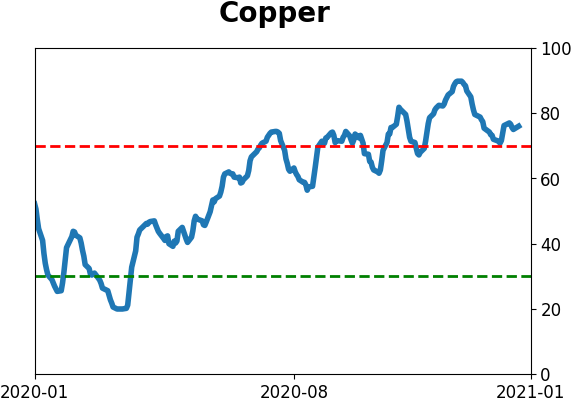
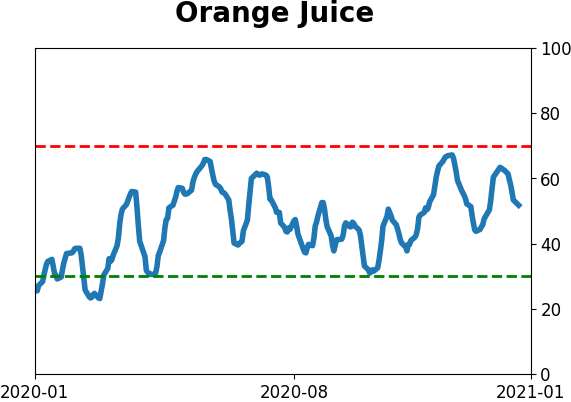
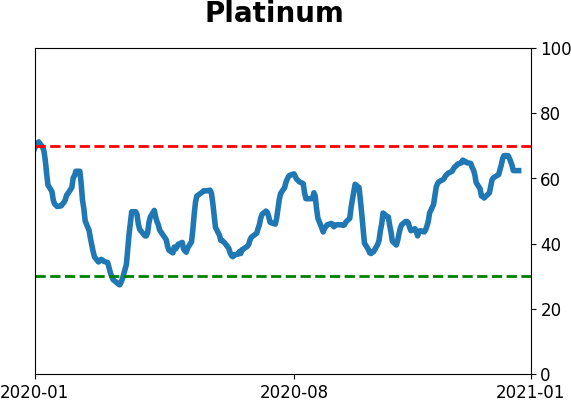
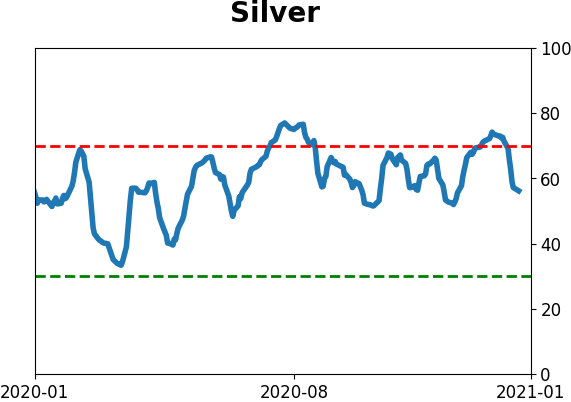
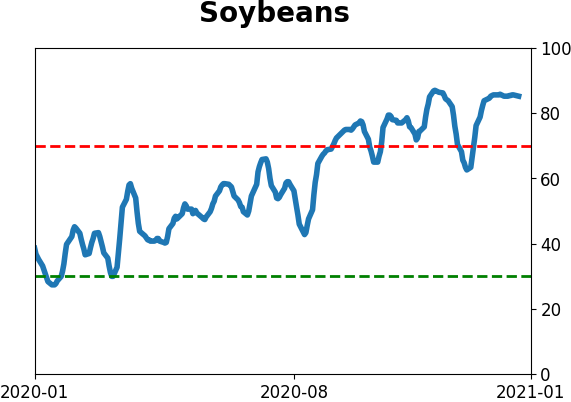
Optimism Index Thumbnails
|
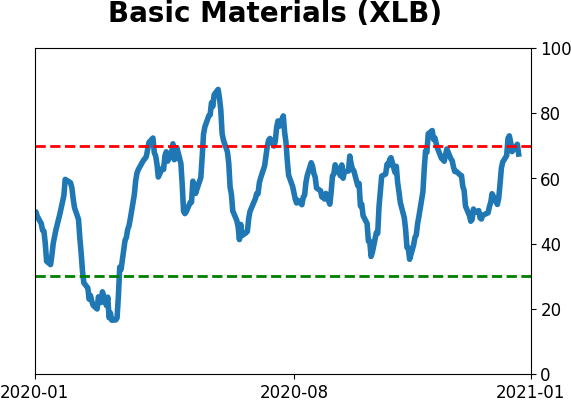
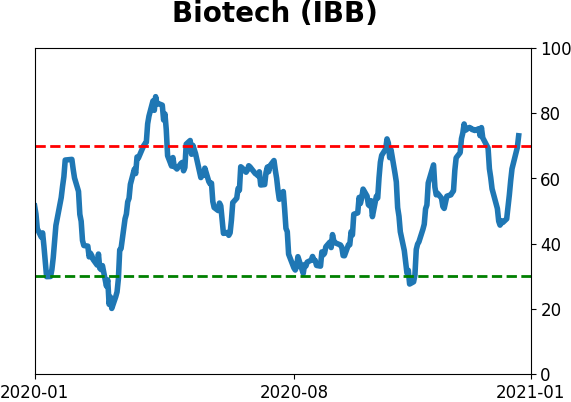
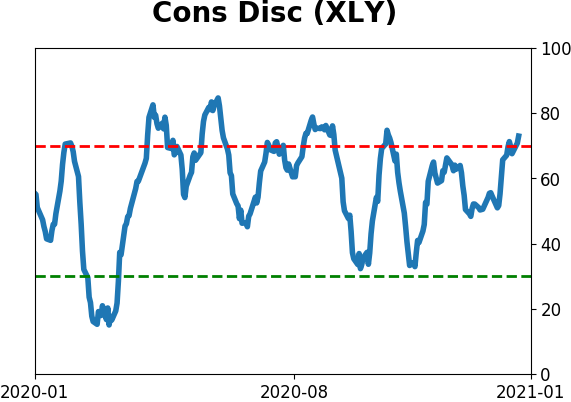
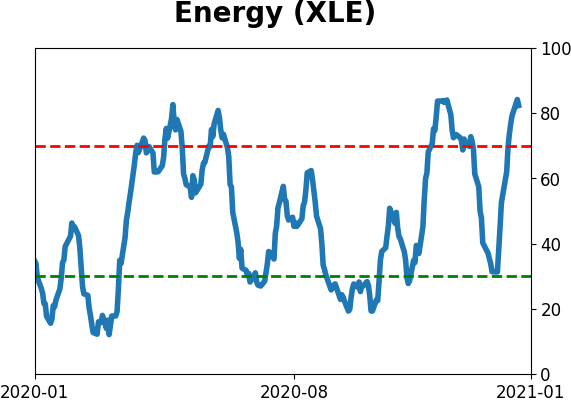
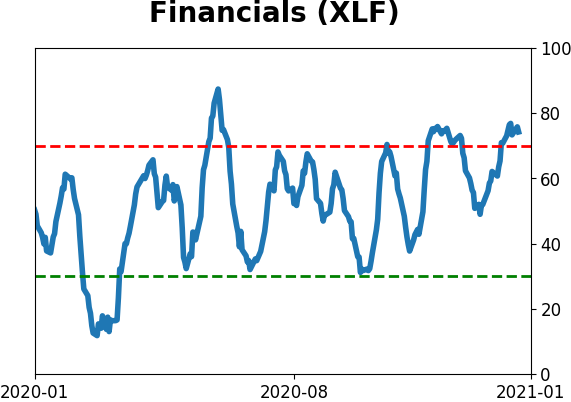
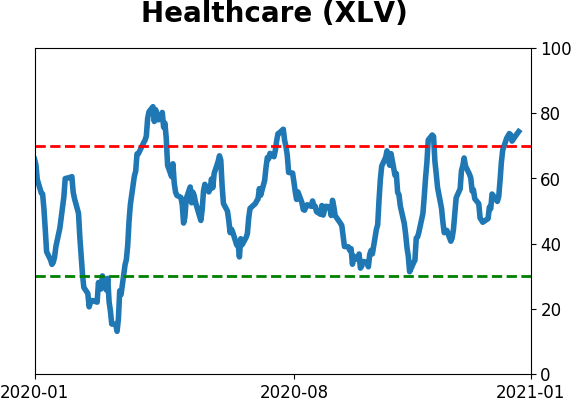
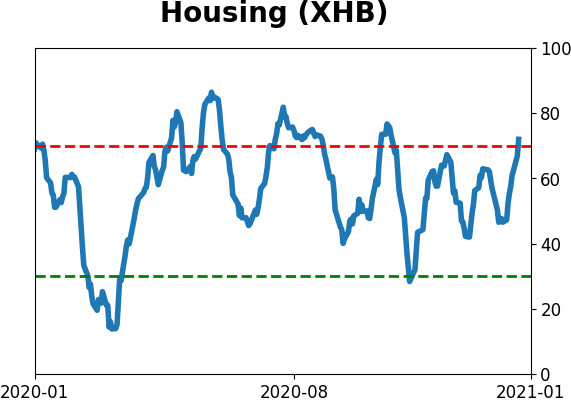
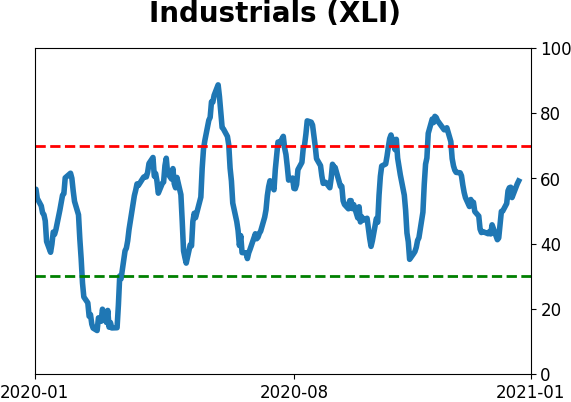
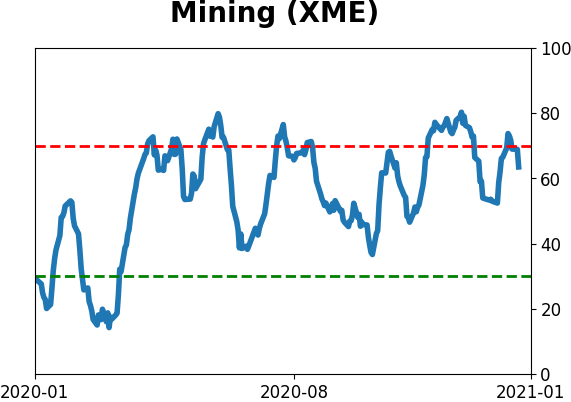
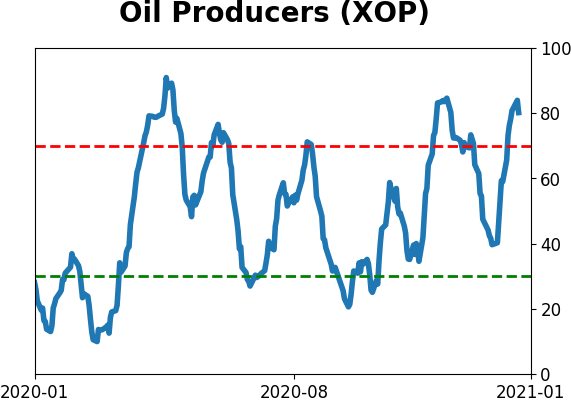
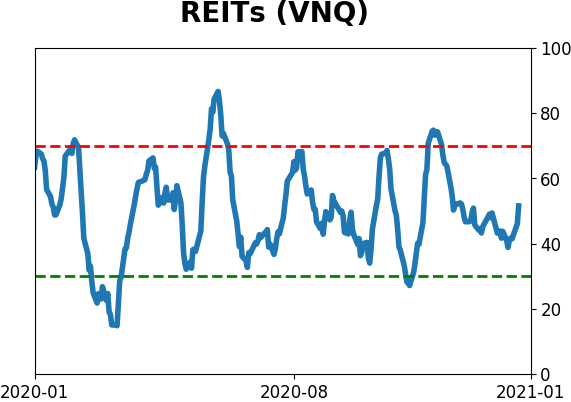
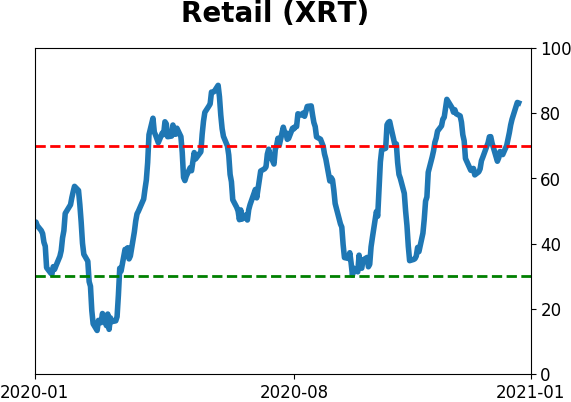
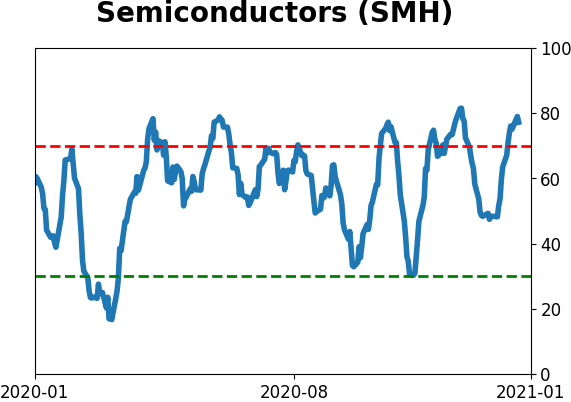
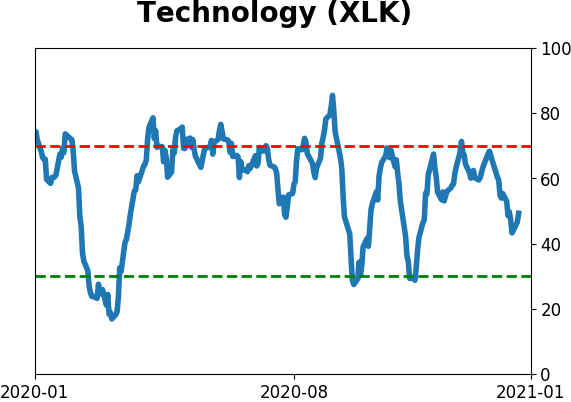
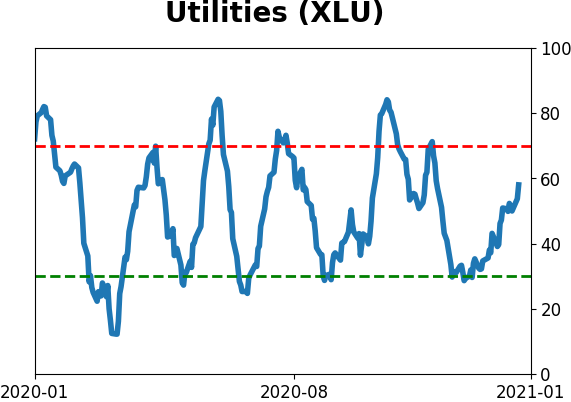
Sector ETF's - 10-Day Moving Average
|
|
|
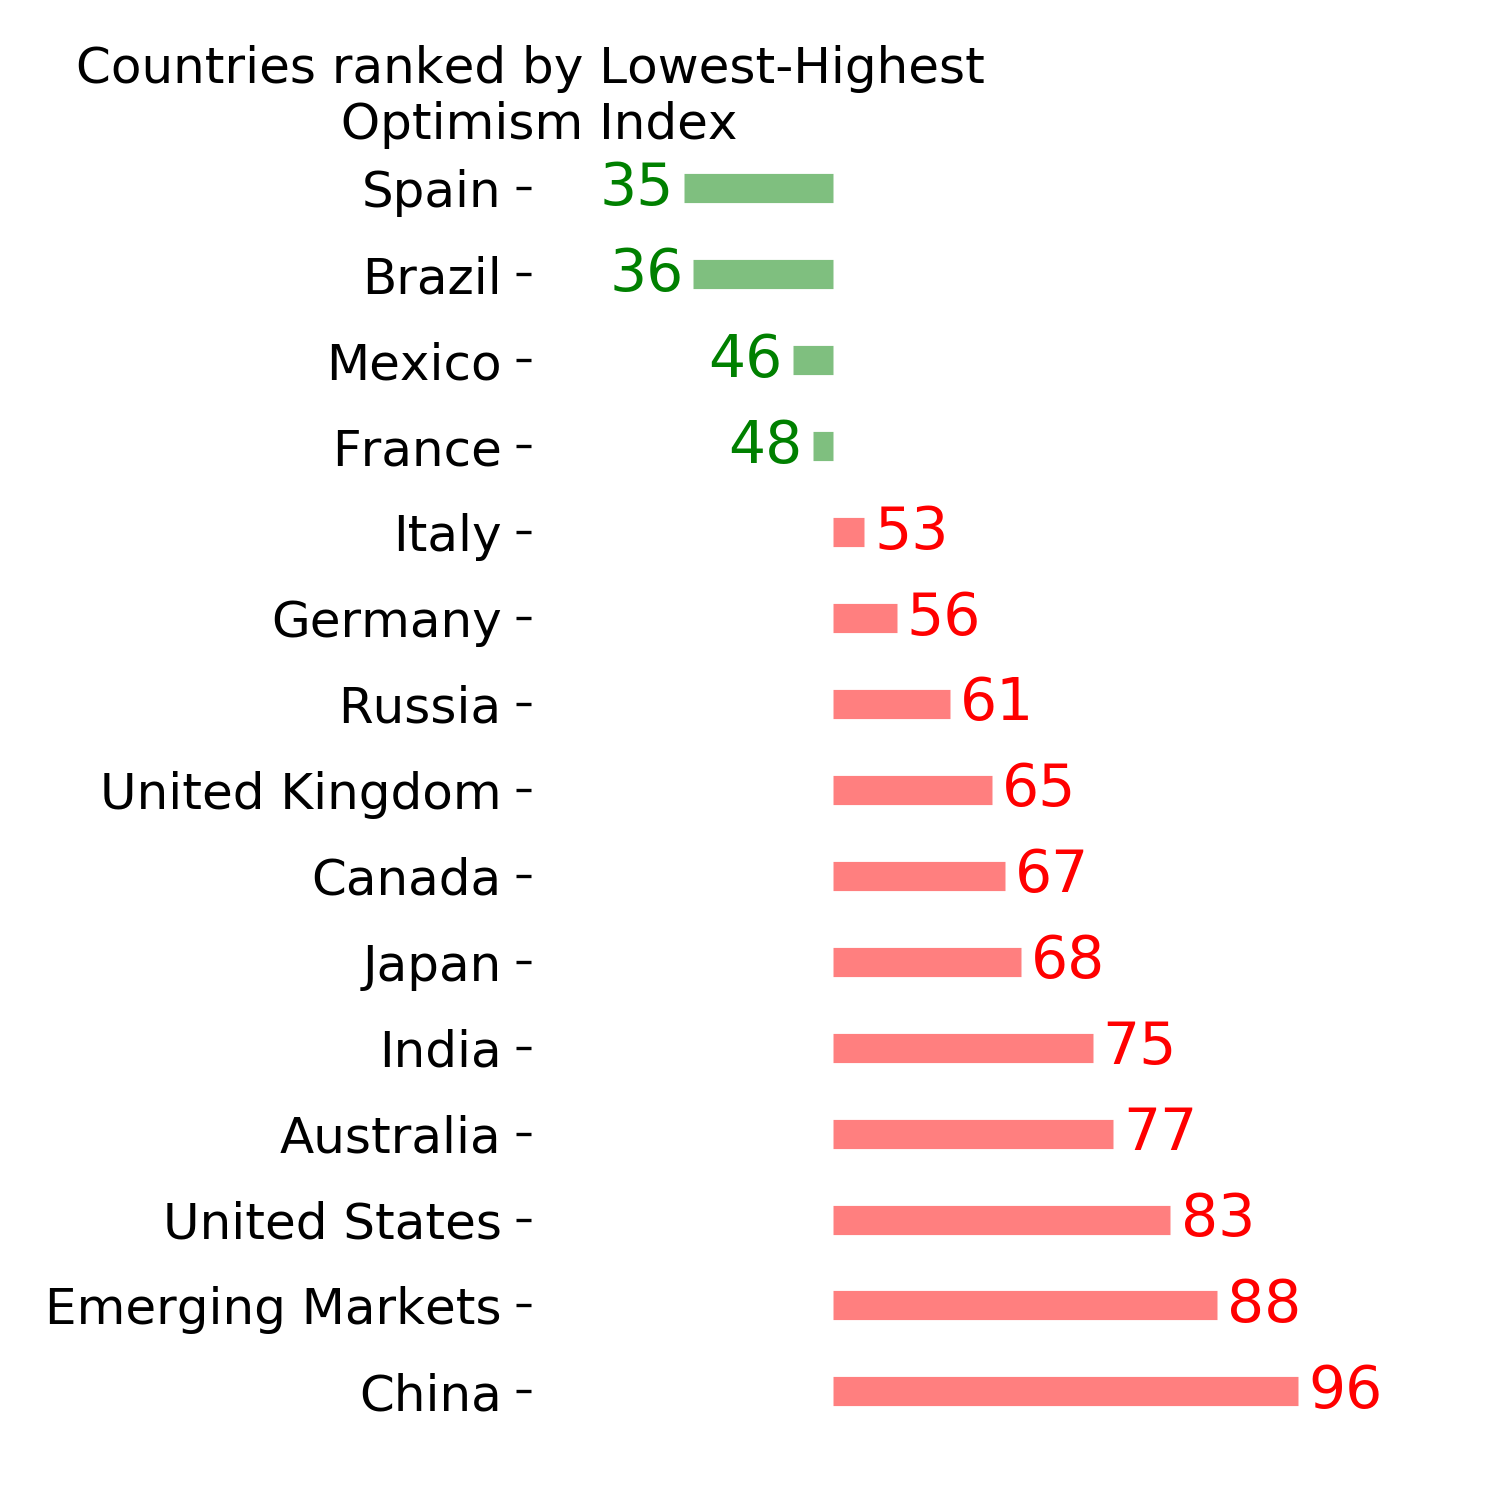
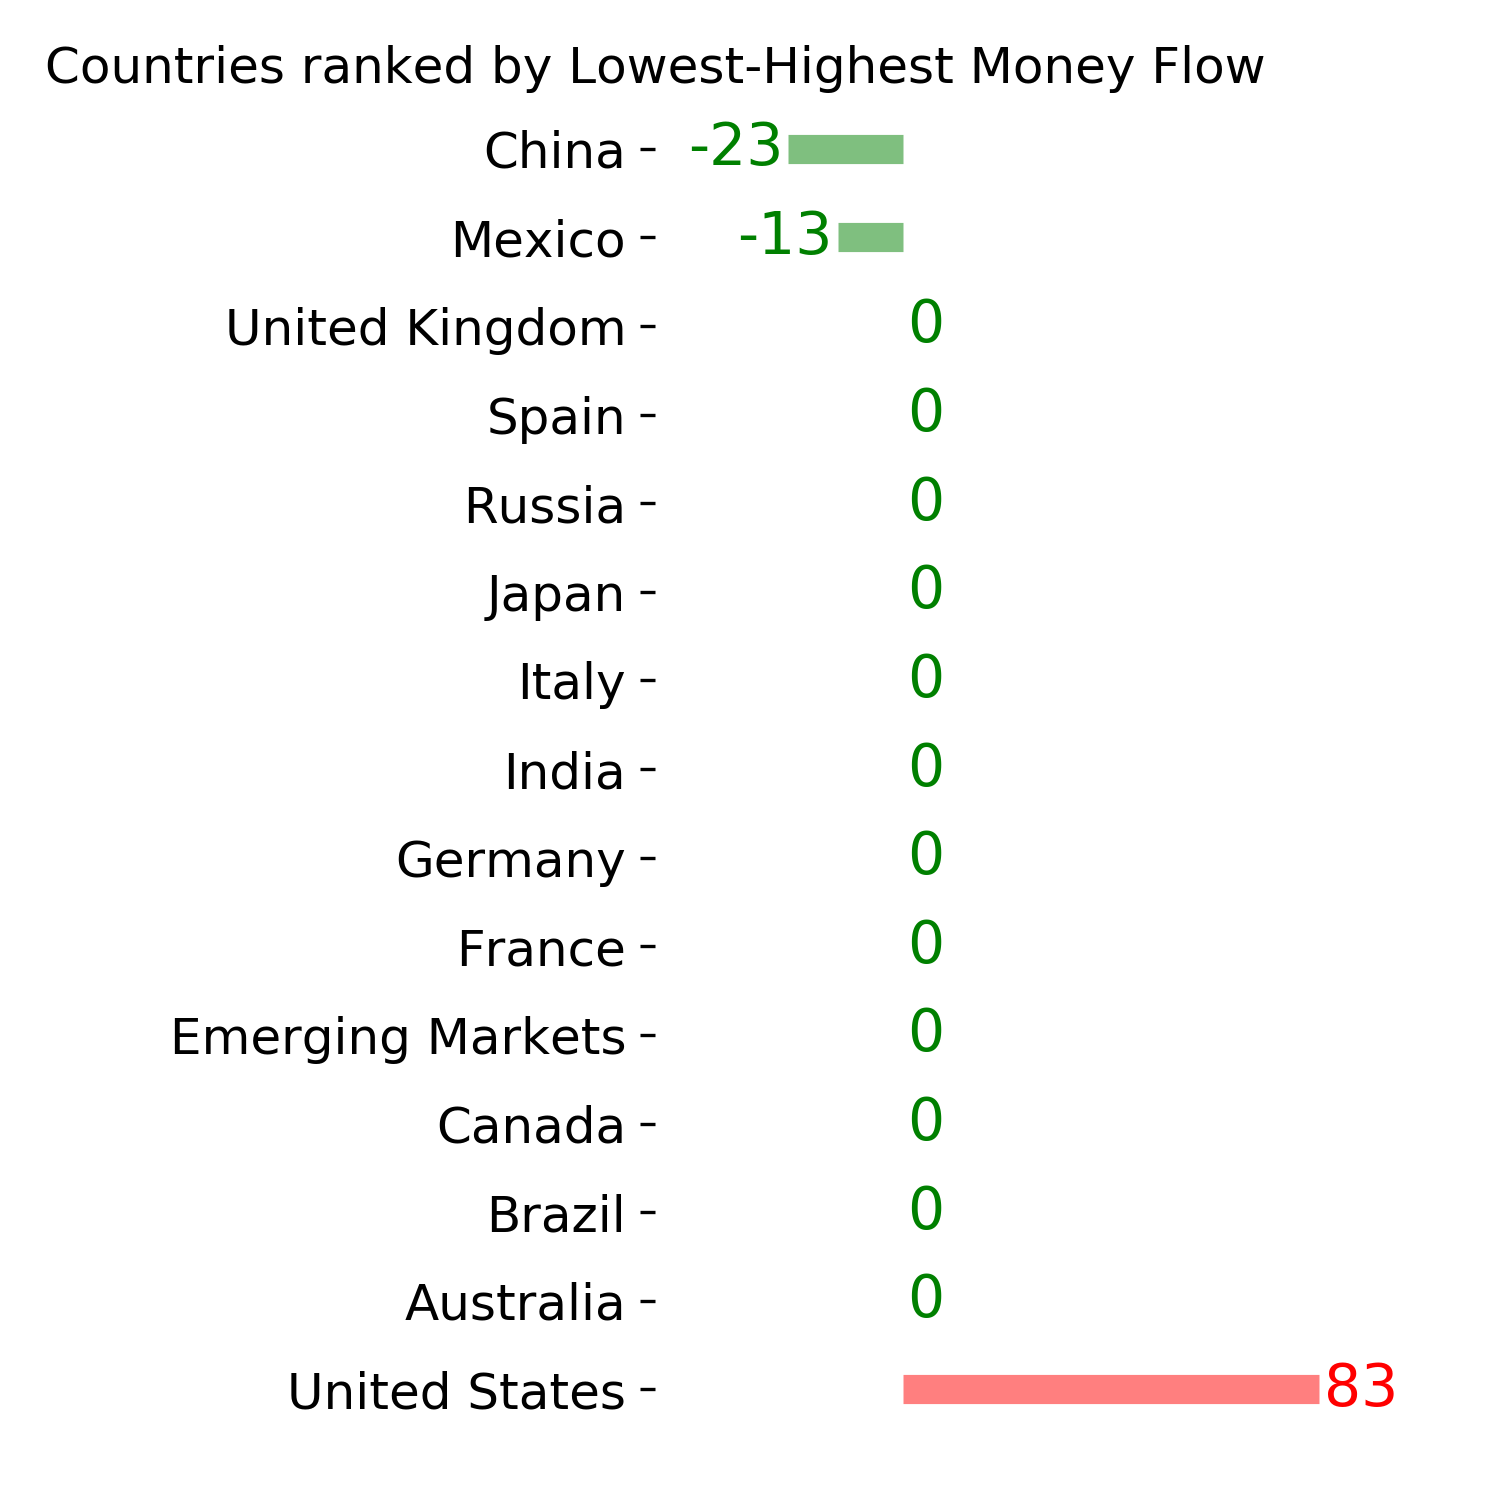
Country ETF's - 10-Day Moving Average
|
|
|
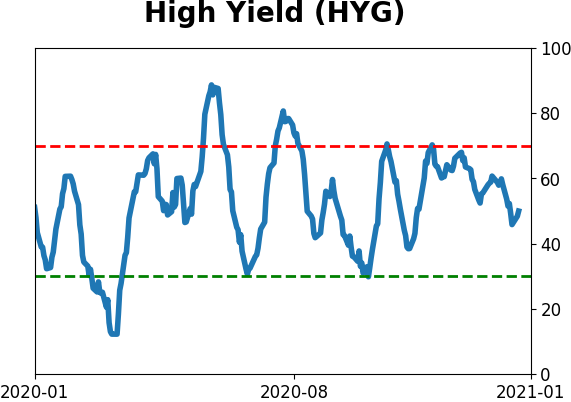
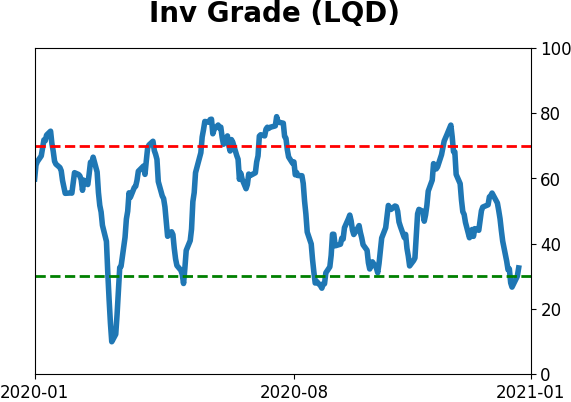
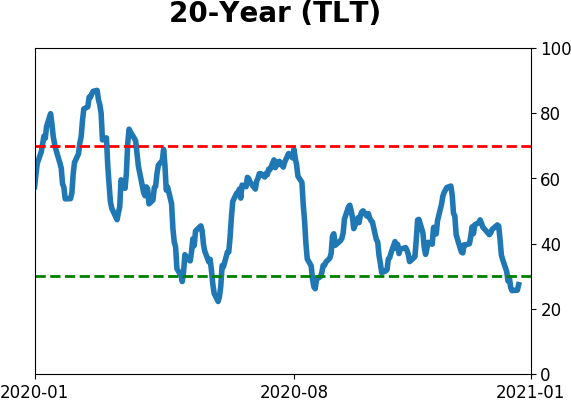
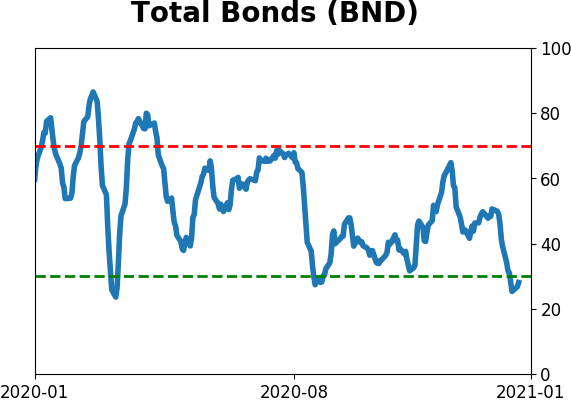
Bond ETF's - 10-Day Moving Average
|
|
|
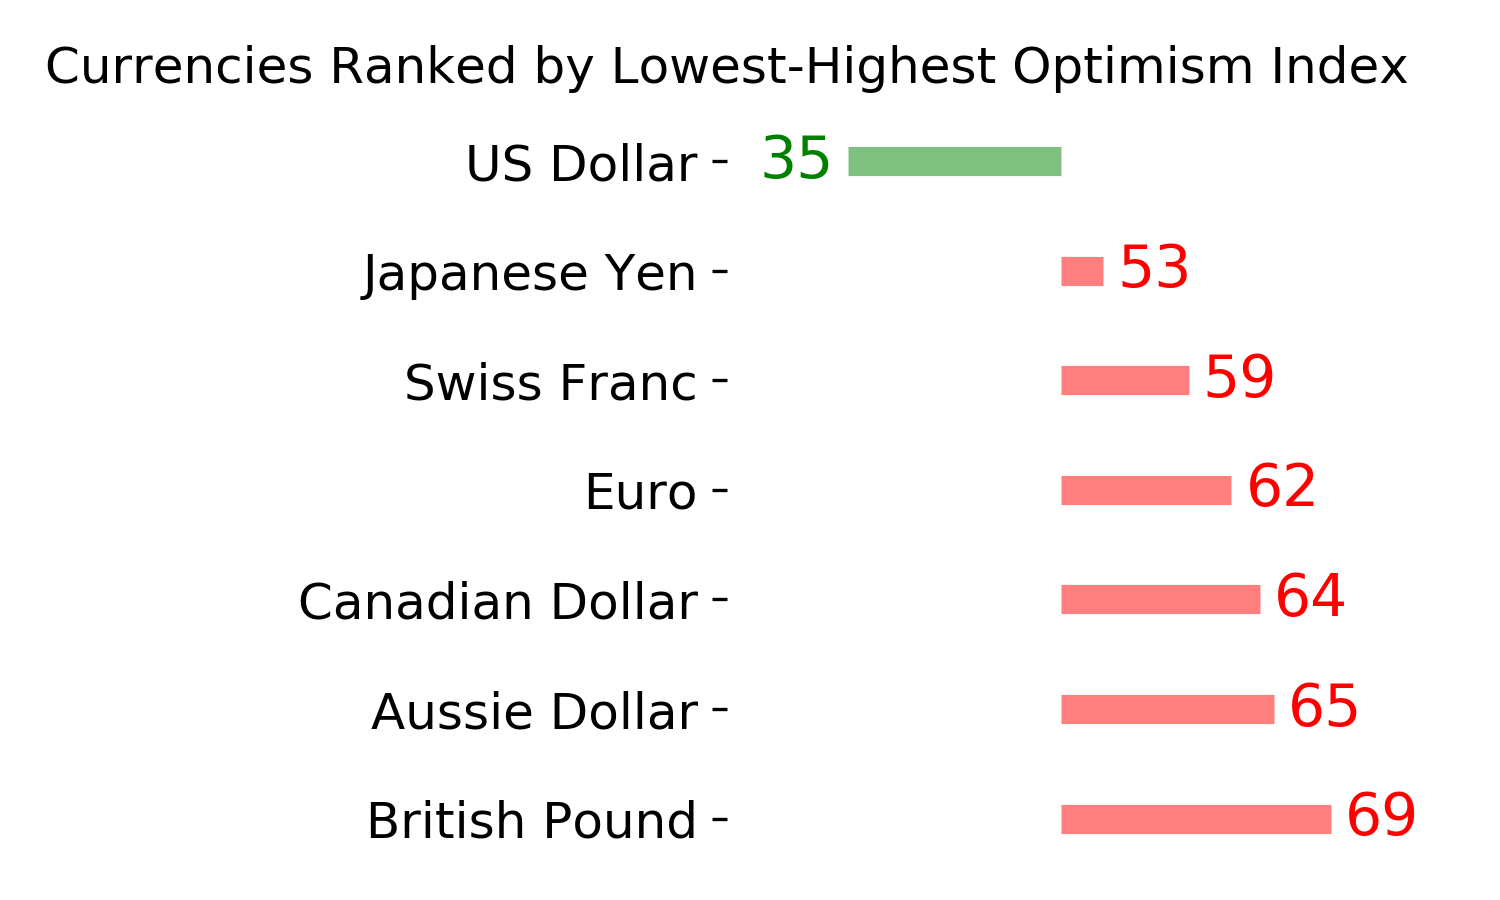
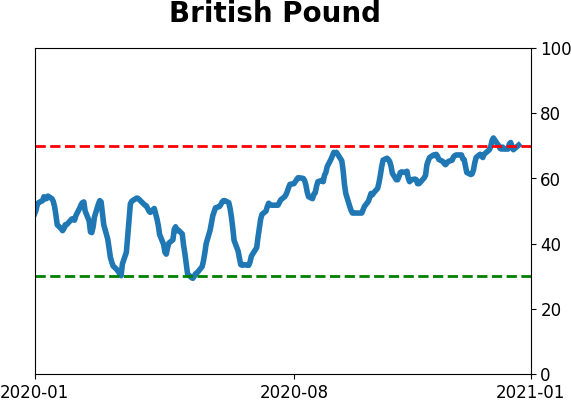
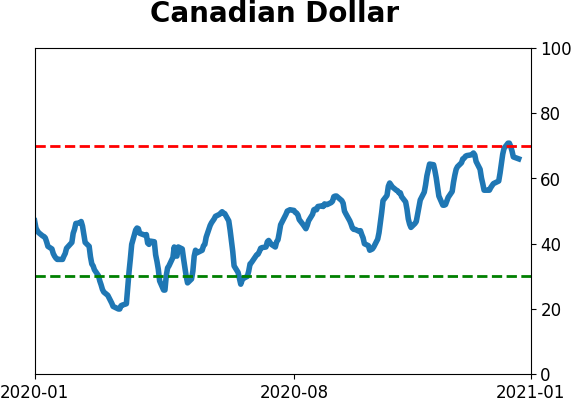
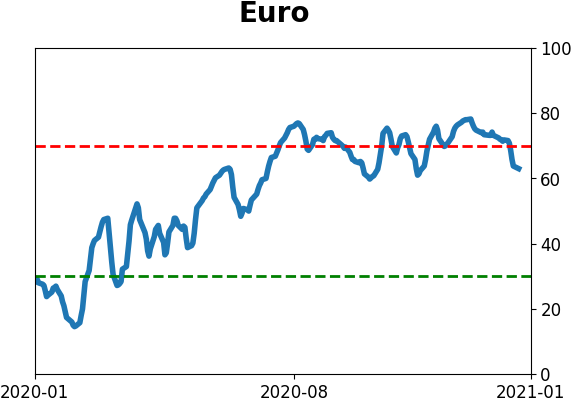
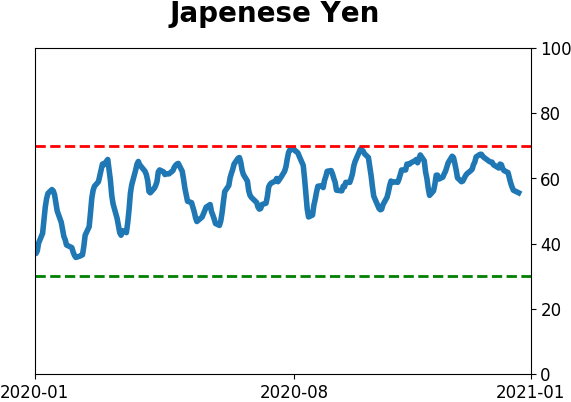
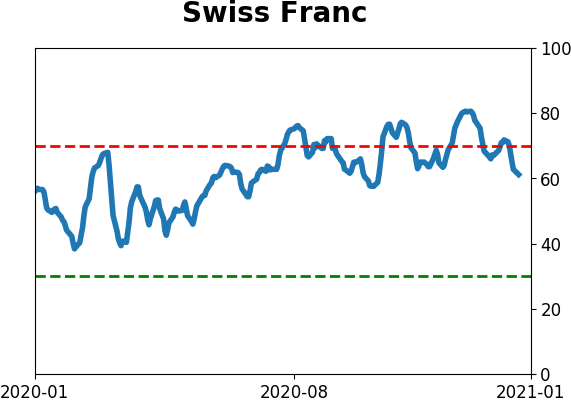
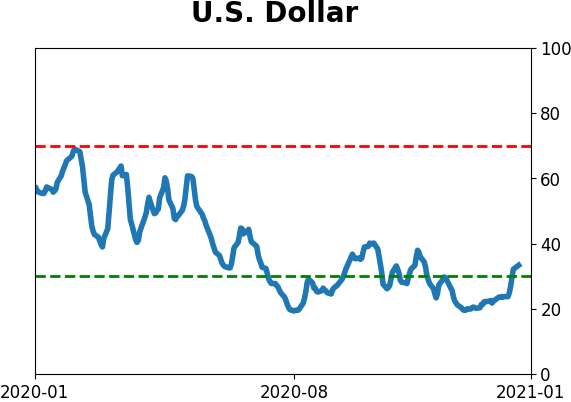
Currency ETF's - 5-Day Moving Average
|
|
|
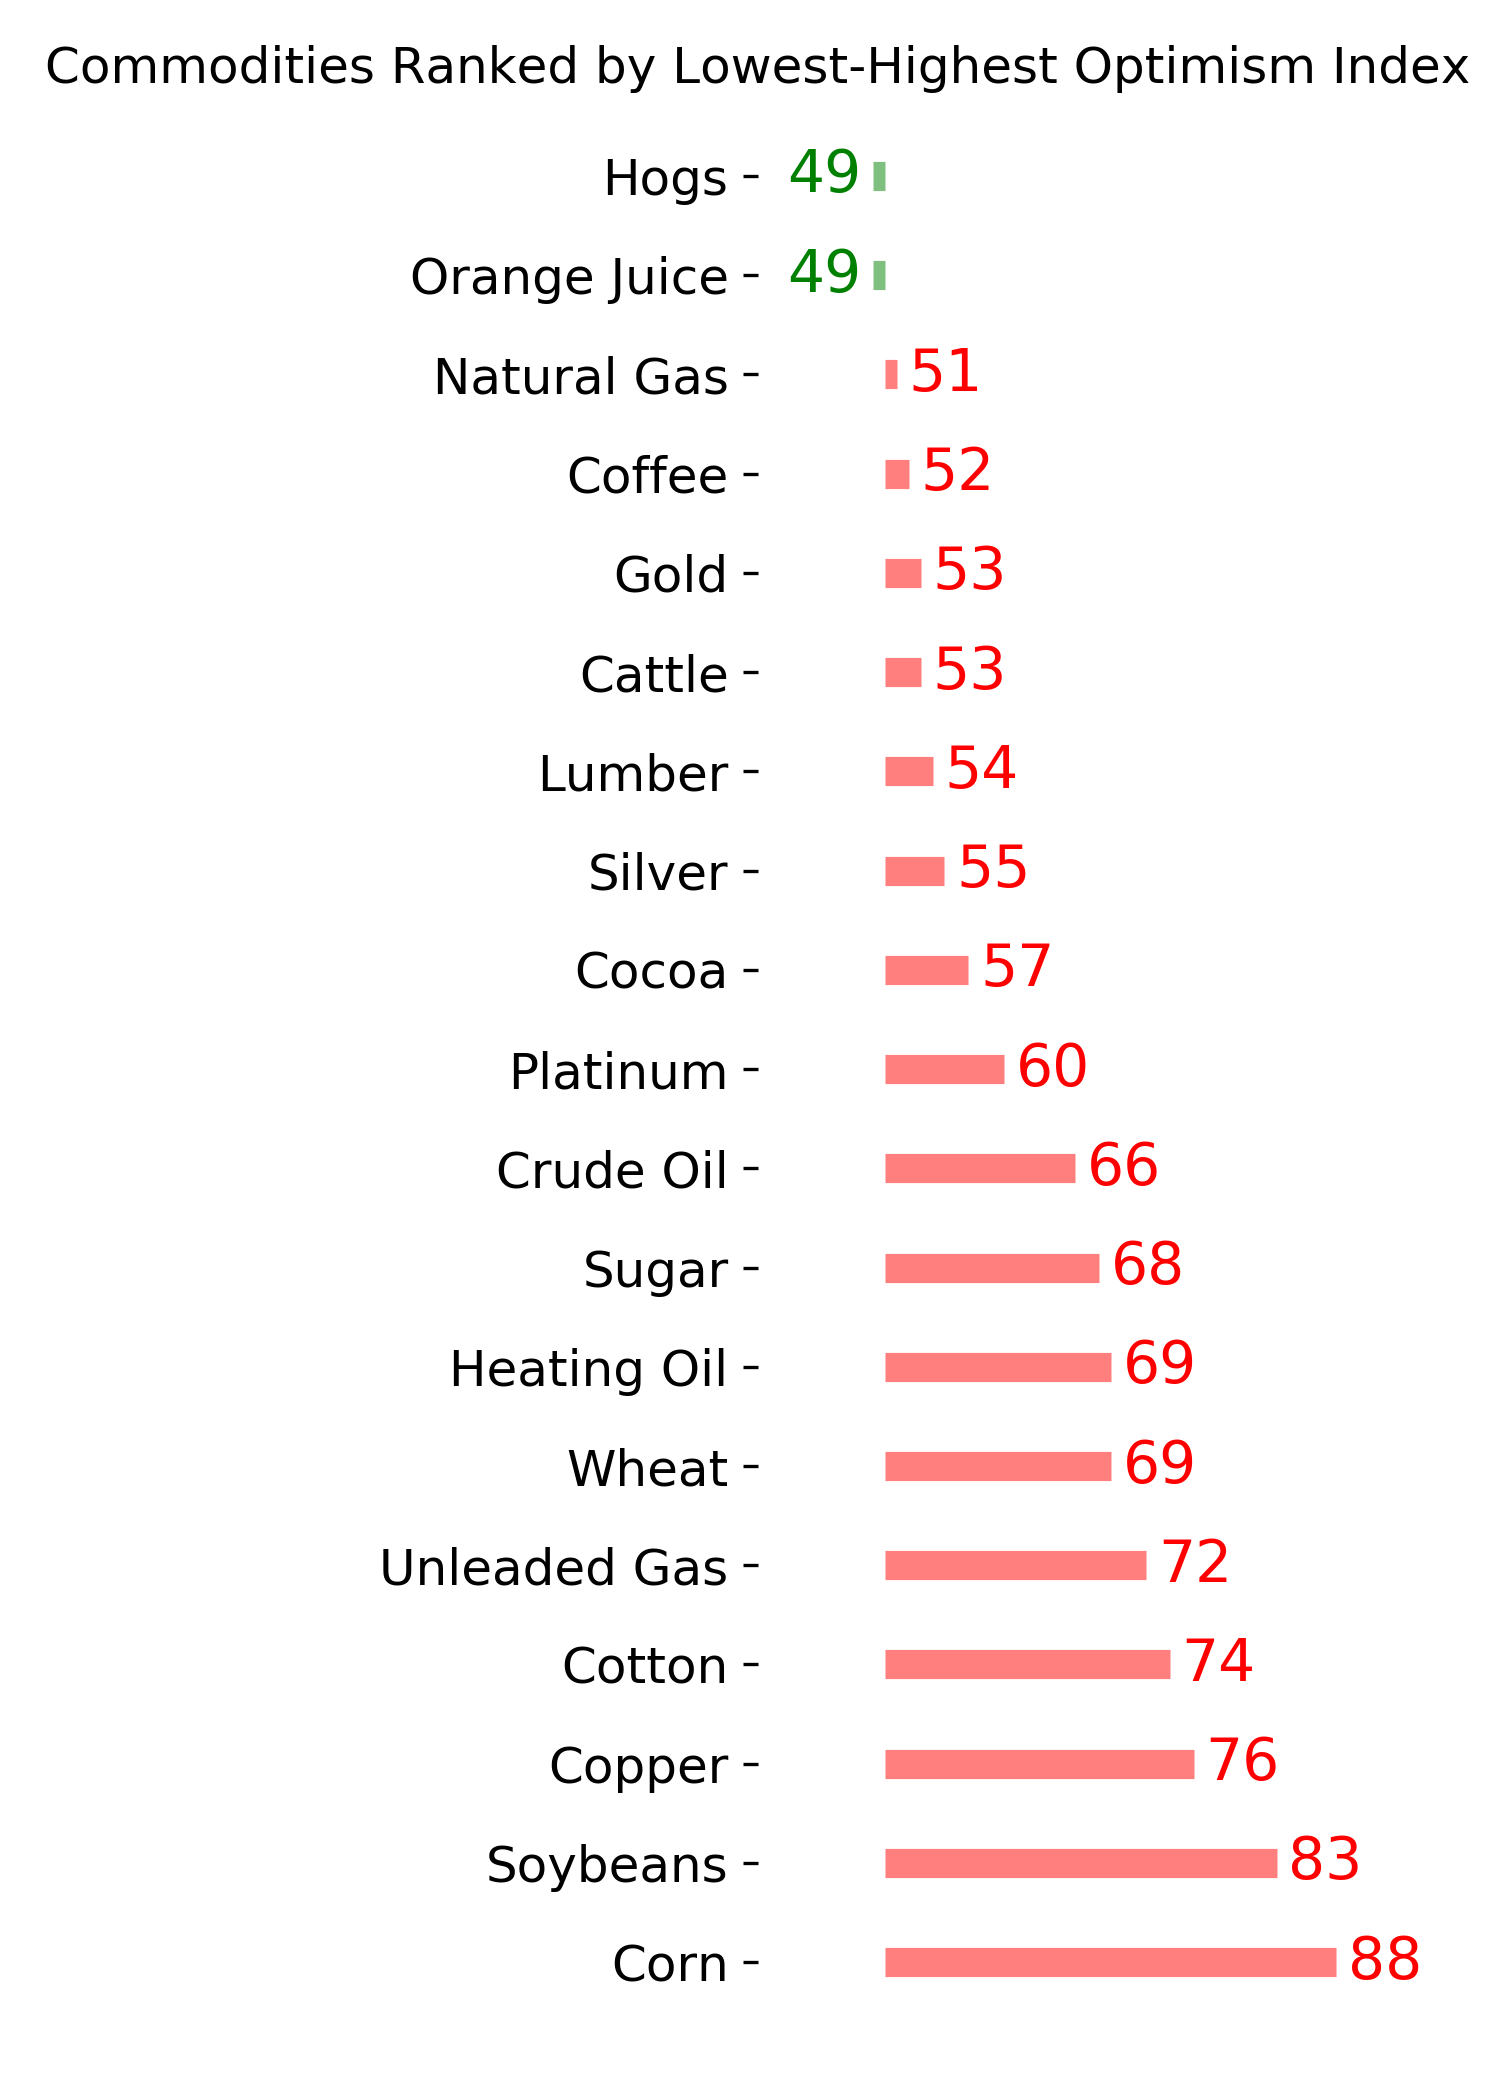
Commodity ETF's - 5-Day Moving Average
|
|