Headlines
|
|
Options traders once again set speculative records:
Last week, the smallest of options traders bought a record number of call options. For the first time, that volume exceeded an equivalent of 9% of total NYSE volume. That has raised the risk that dealers will have a lot of inventory to sell, with high Gamma Exposure.
Bottom Line:
The market environment is pristine, with only sporadic signs of internal deterioration, but with near-historic optimism, gains tend to be muted, with a high probability of being reversed at some point over the ensuing weeks. | Other Sectors and Assets |
| | Positives | Negatives | | 1. Energy (here, here, and here) | 1. Skewed tech (here and here) |
|
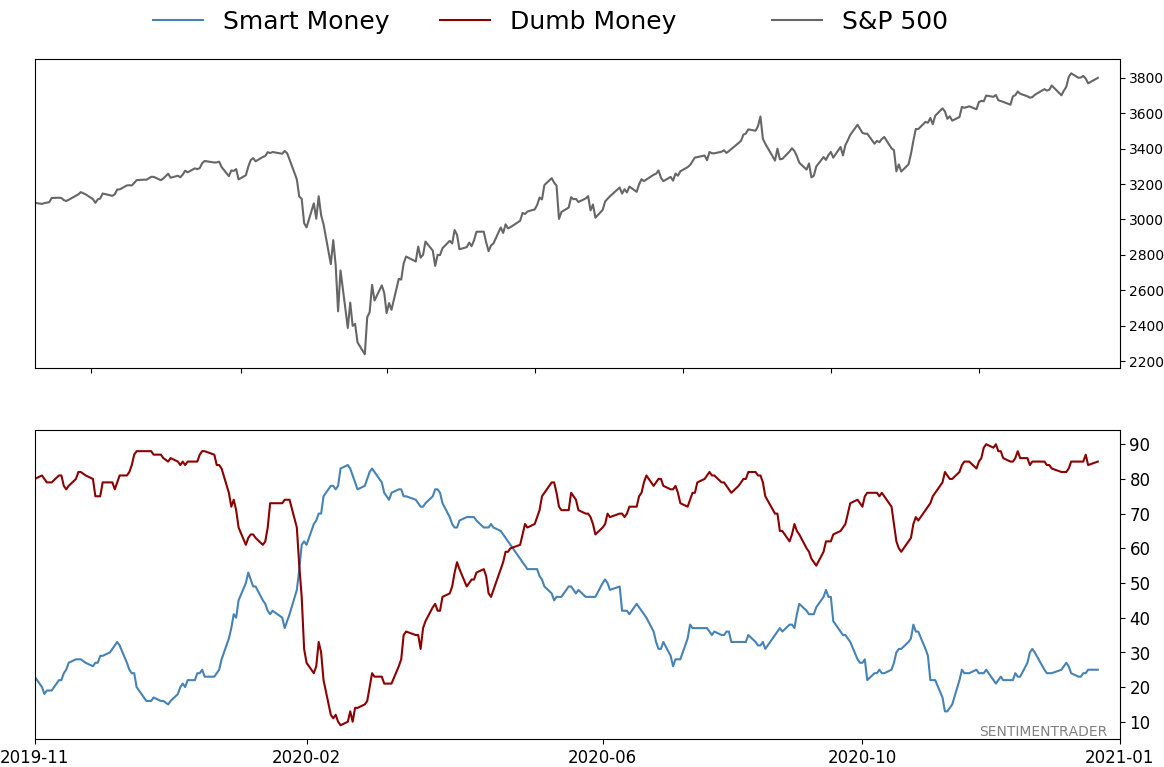
Smart / Dumb Money Confidence
|
Smart Money Confidence: 25%
Dumb Money Confidence: 85%
|
|
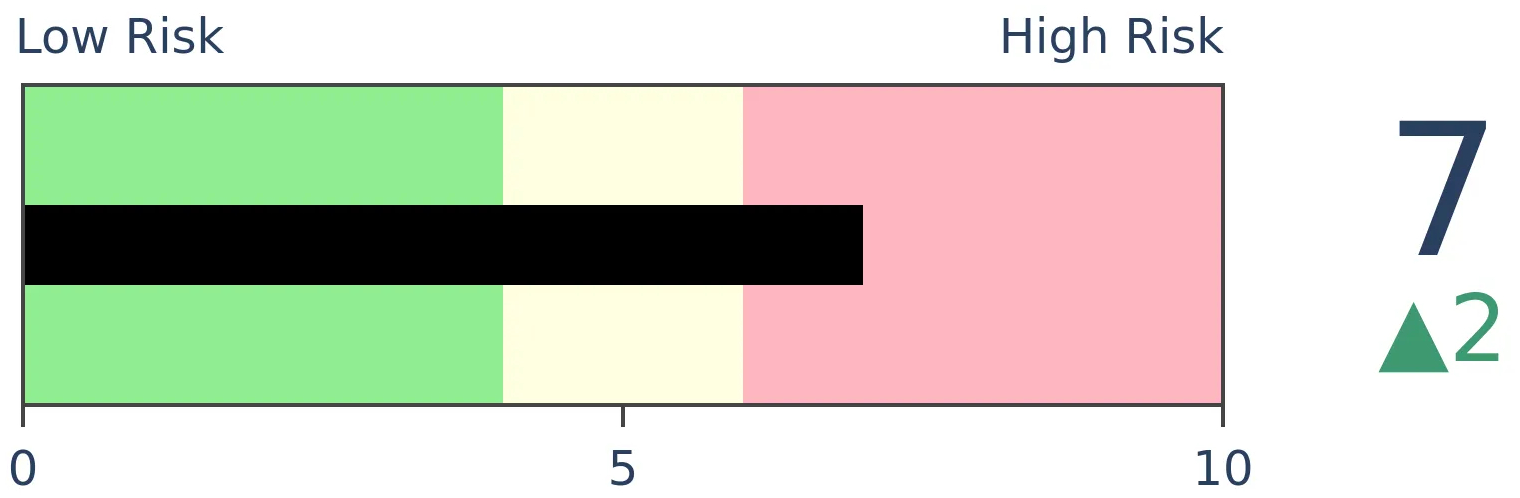
Risk Levels
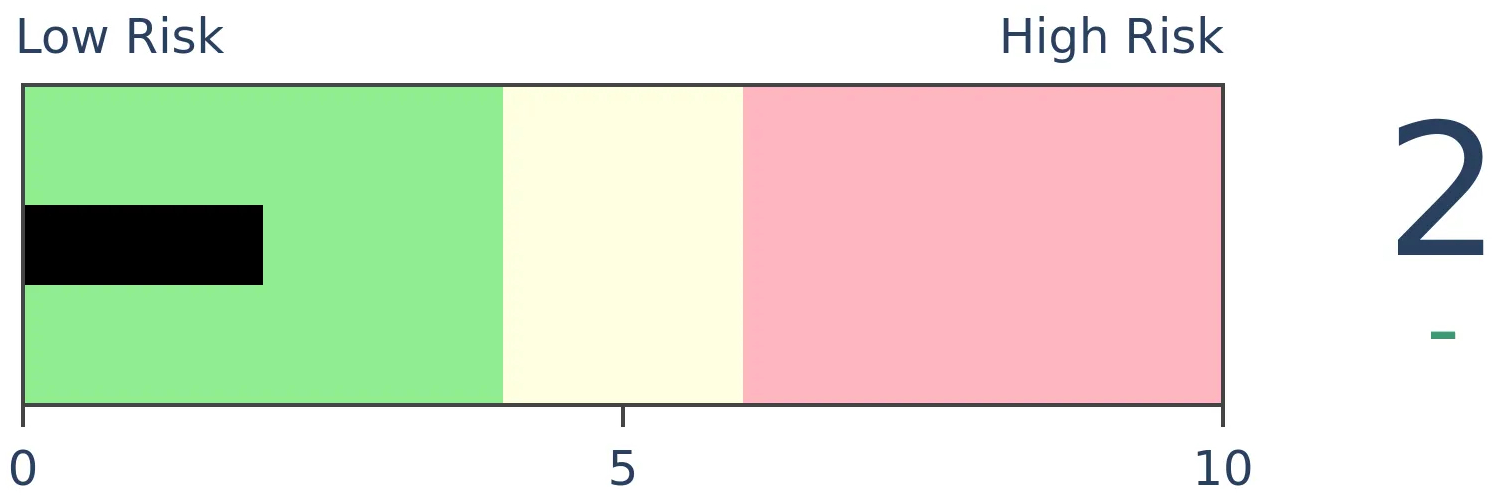
Stocks Short-Term
|
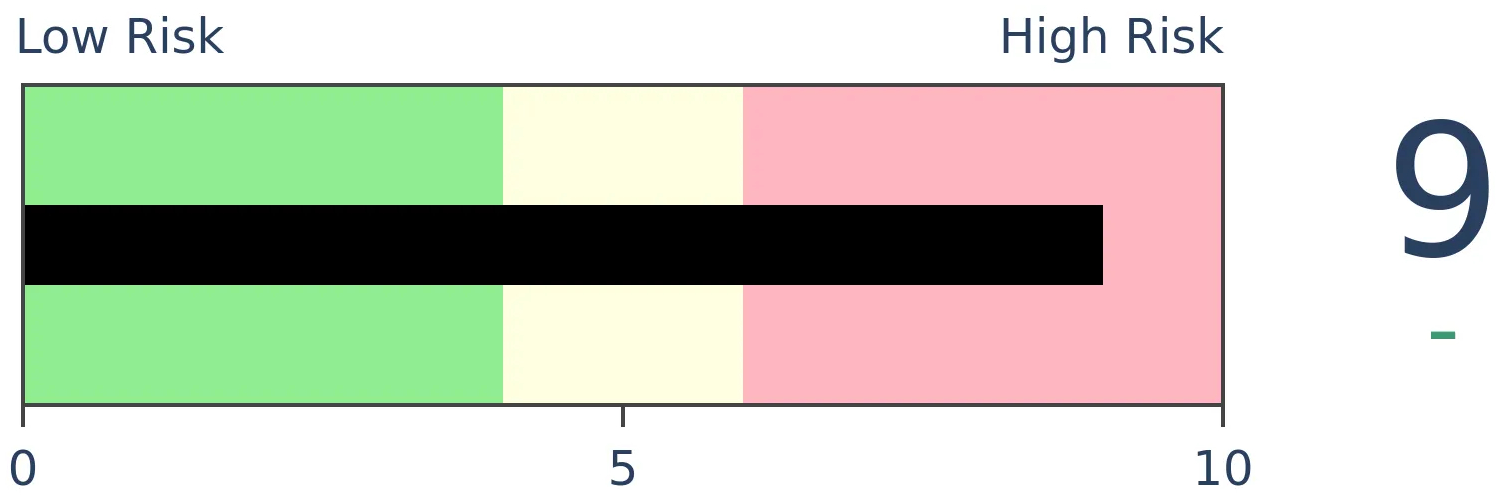
Stocks Medium-Term

|
|
Bonds

|
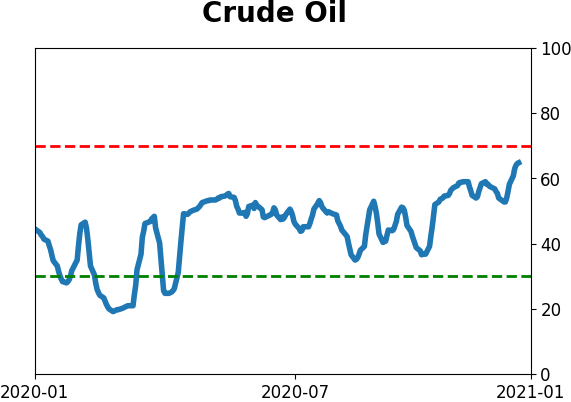
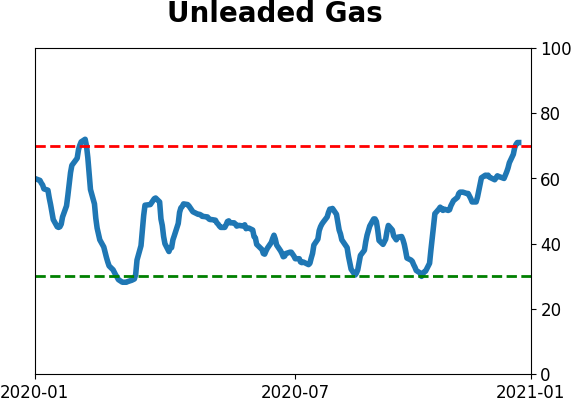
Crude Oil

|
|
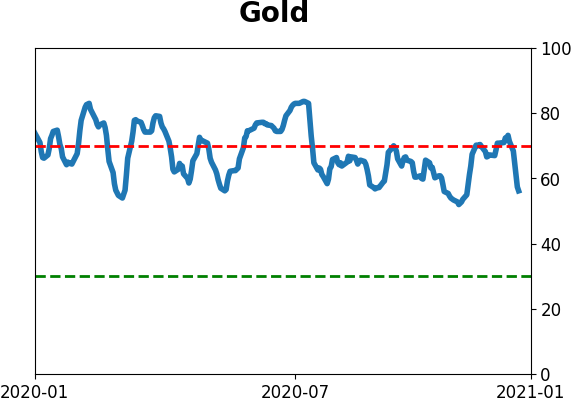
Gold
|
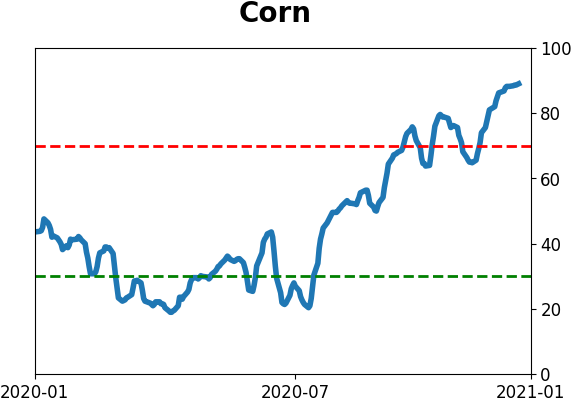
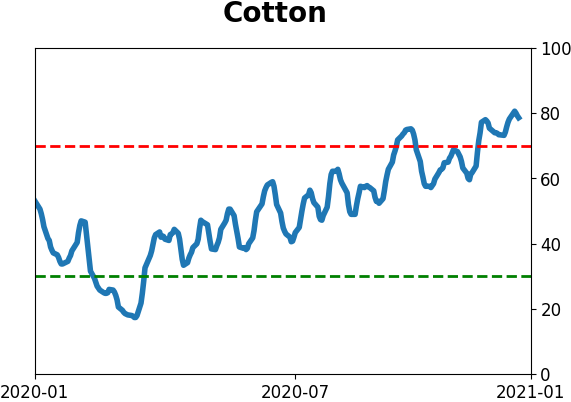
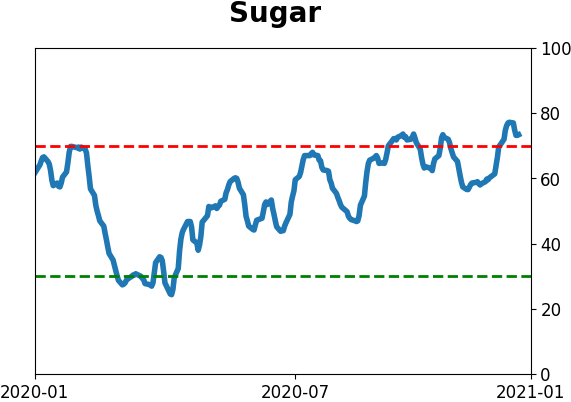
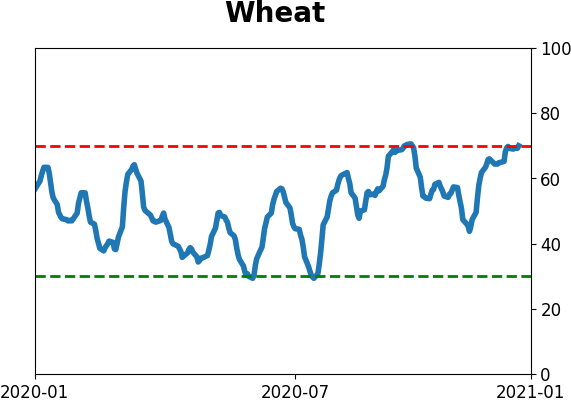
Agriculture
|
|
Research
BOTTOM LINE
Last week, the smallest of options traders bought a record number of call options. For the first time, that volume exceeded an equivalent of 9% of total NYSE volume. That has raised the risk that dealers will have a lot of inventory to sell, with high Gamma Exposure.
FORECAST / TIMEFRAME
SPY -- Down, Medium-Term
|
In late August and early September, we focused heavily on the actions of options traders, because it seemed to represent a clear and present danger. While markets as a whole held up okay in the aftermath, there were pockets of heavy losses, 10% or more.
We've touched on it several times in recent weeks as traders became more emboldened with so many stocks hitting new highs. Who's to blame them, since it keeps working?
Combined with other spikes in speculative activity, the action of these traders seems to once again be triggering a sense of imminent danger.
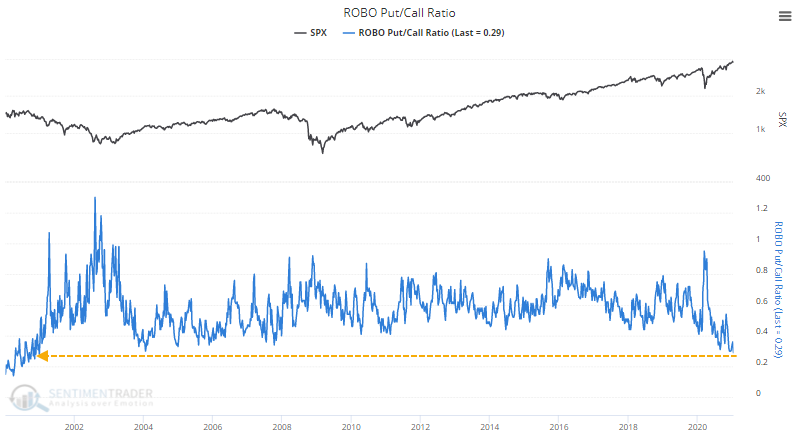
Last week, the smallest of options traders, those trading 10 contracts or fewer, picked up their call buying. In a more drastic change, they also pulled back on their protective put purchases, which fell from 18% of their total volume down to 15%, the lowest in a decade.
This one-two punch caused the ROBO Put/Call Ratio to its lowest level since the bubble years. ROBO stands for Retail-Only, Buy-to-Open, and this is important because unlike other put/call ratios, with this one we know who is doing what. And it tells us that small traders have become wildly speculative.
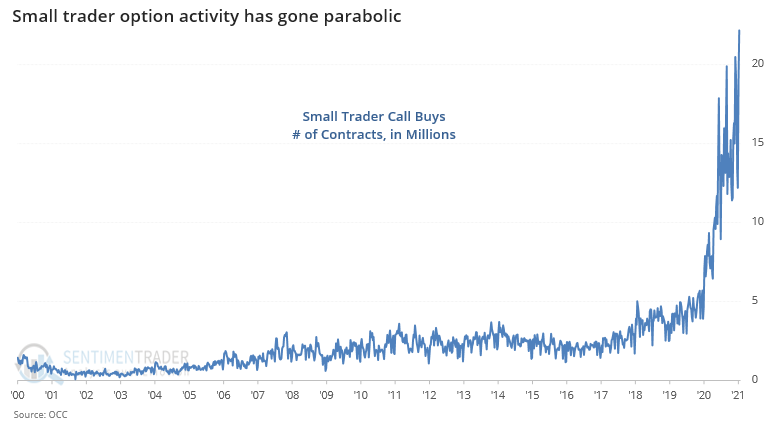
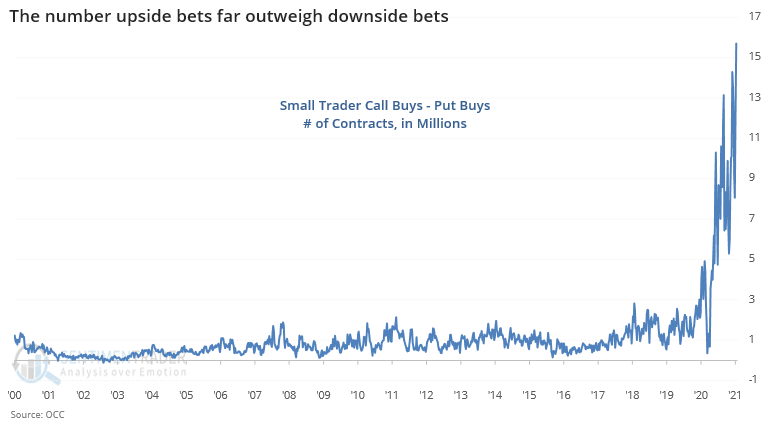
When we look at the raw number of contracts that small traders are buying, it's astounding. Parabolic is the only accurate term, with more than 22 million call options bought last week.
A reasonable person would suggest, "Well, maybe they bought a lot of put options, too." That would make sense, as overall volumes have risen. If they bought a lot of puts as a hedge, then it would suggest less outright optimism.
It wasn't the case, though. Against those 22.2 million call options, they bought to open only 6.5 million puts. So, the net difference is even more extreme.
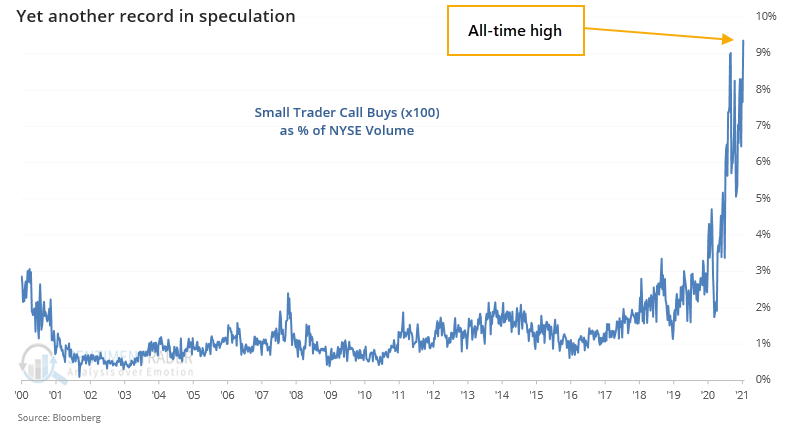
Just as troubling, this activity has become more and more of a factor. If we adjust the options volume to account for an equivalent number of shares, then we can get a rough comparison to overall market volume.
For the first time, the activity of these small traders was the equivalent of more than 9% of NYSE volume, exceeding even what we saw at the end of August.
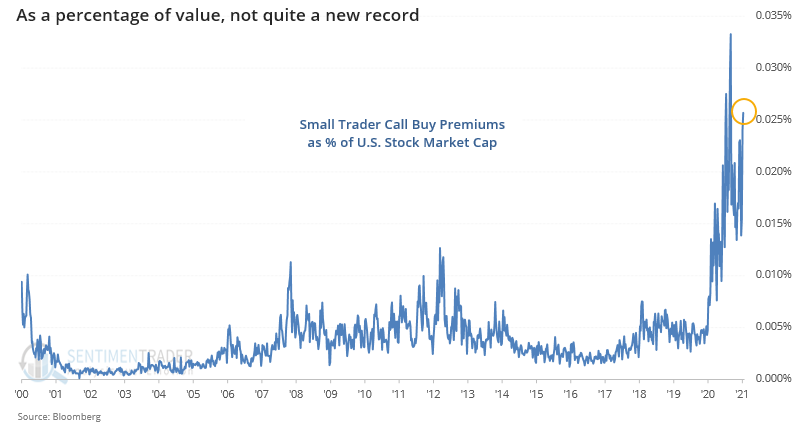
Because the cost of options has come down quite a bit since then, premiums are smaller. So even though the number of transactions is higher, the actual, real-money cost of them has come down somewhat. As a percentage of the market capitalization of all U.S. listed stocks, the amount of money that small traders have laid out for these call options isn't quite as extreme as August.
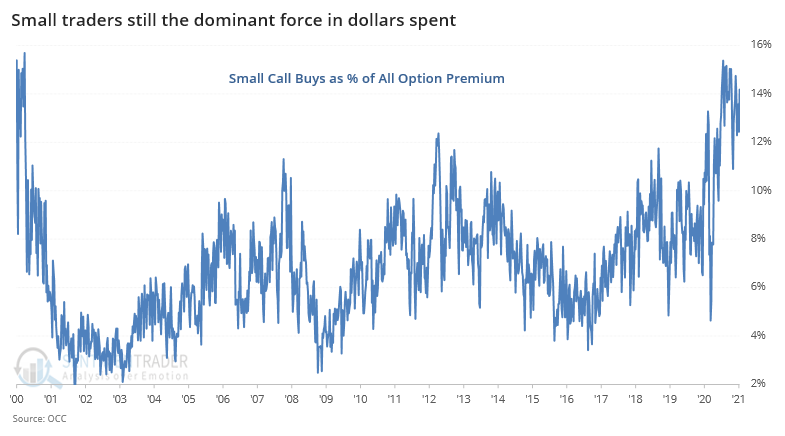
We focus so heavily on small traders because they tend to be the most consistent contrary indicator at extremes, and because they've become such a driving force, particularly in the options market. The buying of call options from the smallest of traders remains near the highest levels ever as a proportion of all option volume.
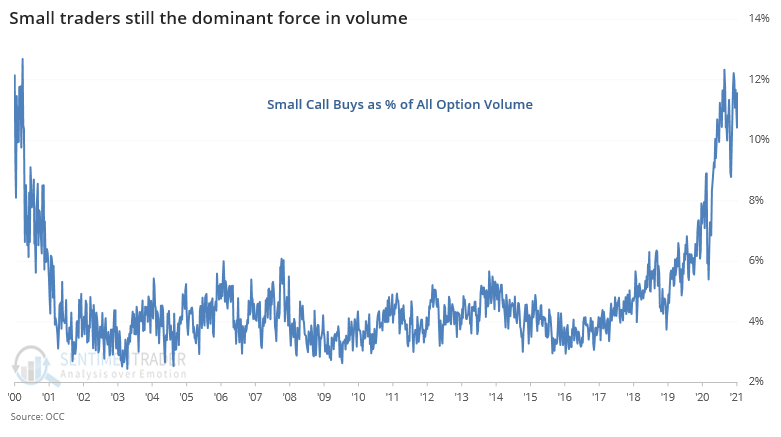
And the premiums they're spending on those calls remain among the highest ever in terms of total money spent on all options activity.
If we broaden the universe and include all trades for fewer than 50 contracts, then we can get a more comprehensive view of just how much retail speculation is out there. This is a more conservative look than we did in September, assuming no adjustment for the leverage of the options and using a broader measure of the market cap of stocks.
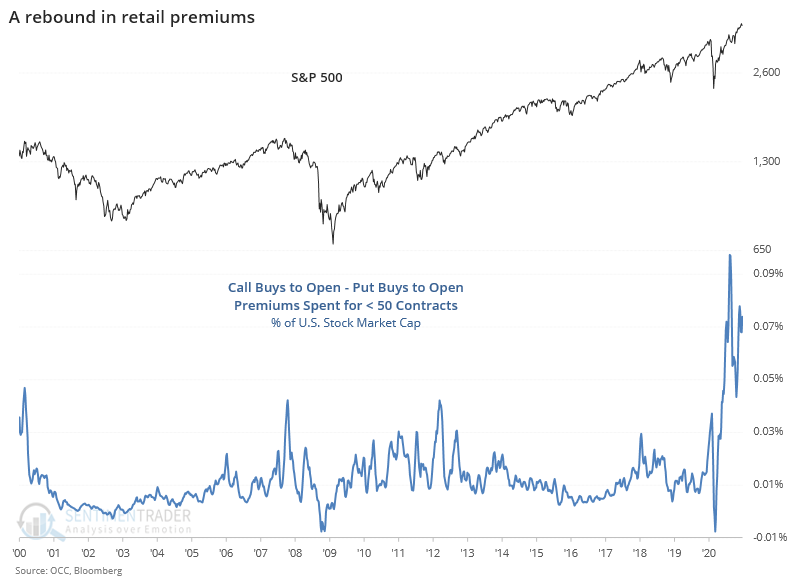
Again, because implied volatility has come down since the fall, options prices are generally cheaper across the board, so the relative value of total money outlaid is less extreme but is still beyond any other bout of speculation in the prior 20 years.
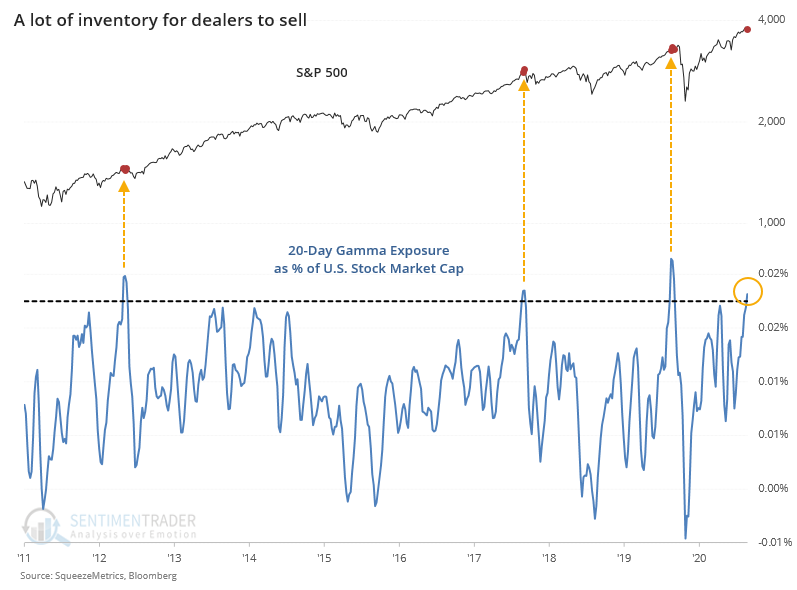
We've pointed out recently that all of this activity has been raising the potential inventory that dealers will need to sell. After all, somebody is on the other side of all this call buying, and they need to hedge that activity. When the options expire, those hedges get unwound (see this post from a few months ago).
Over the past 20 days, Gamma Exposure has reached a near-record, on an absolute and relative basis.
We've been surprised before, and we'll be surprised again. Maybe this kind of activity will simply result in a wonderful waterfall of profits to all the new, and newly aggressive, options traders. And penny stock traders. And margined investors. From a personal point of view, it would be a thrill to see. It's just that experience and an appreciation of market history shows that when traders press so hard, the market has a very consistent tendency to press back in the opposite direction.
Active Studies
| Time Frame | Bullish | Bearish | | Short-Term | 0 | 0 | | Medium-Term | 2 | 2 | | Long-Term | 14 | 2 |
|
Indicators at Extremes
Portfolio
| Position | Description | Weight % | Added / Reduced | Date | | Stocks | 10.6% VWO, 10.1% XLE, 8.5% RSP, 8.3% PSCE | 37.5 | Added 3% | 2021-01-05 | | Bonds | 10% BND, 10% SCHP, 10% ANGL | 27.8 | Reduced 0.1% | 2020-10-02 | | Commodities | GCC | 2.3 | Reduced 2.1%
| 2020-09-04 | | Precious Metals | GDX | 9.8 | Added 4.8% | 2020-12-01 | | Special Situations | | 0.0 | Reduced 5% | 2020-10-02 | | Cash | | 22.6 | | |
|
Updates (Changes made today are underlined)
There hasn't been much that changed in recent weeks, with sky-high sentiment on many measures receding a bit, but that's not necessarily a good sign, just ask February 2020. We still have the lingering positives from all the breadth thrust last year, as late as October and November. Those have a very good historical record at preceding higher prices over a longer time frame. Of more immediate concern is the explosion in speculation in the most leveraged parts of the market. So far, that hasn't translated to price troubles, though there have been more oddities n the latter half of December than we'd seen since August, like the major indexes rising but on very poor breadth. I continue to avoid tech- and cap-heavy indexes, and don't see that changing any time soon. Energy stocks are doing what they should, and I added a bit more there. I'm not a momentum trader and do not focus on pyramiding positions in this account - it's more about protecting capital - but I like the setup on a long-term time frame. RETURN YTD: 4.0% 2020: 8.1%, 2019: 12.6%, 2018: 0.6%, 2017: 3.8%, 2016: 17.1%, 2015: 9.2%, 2014: 14.5%, 2013: 2.2%, 2012: 10.8%, 2011: 16.5%, 2010: 15.3%, 2009: 23.9%, 2008: 16.2%, 2007: 7.8%
|
|
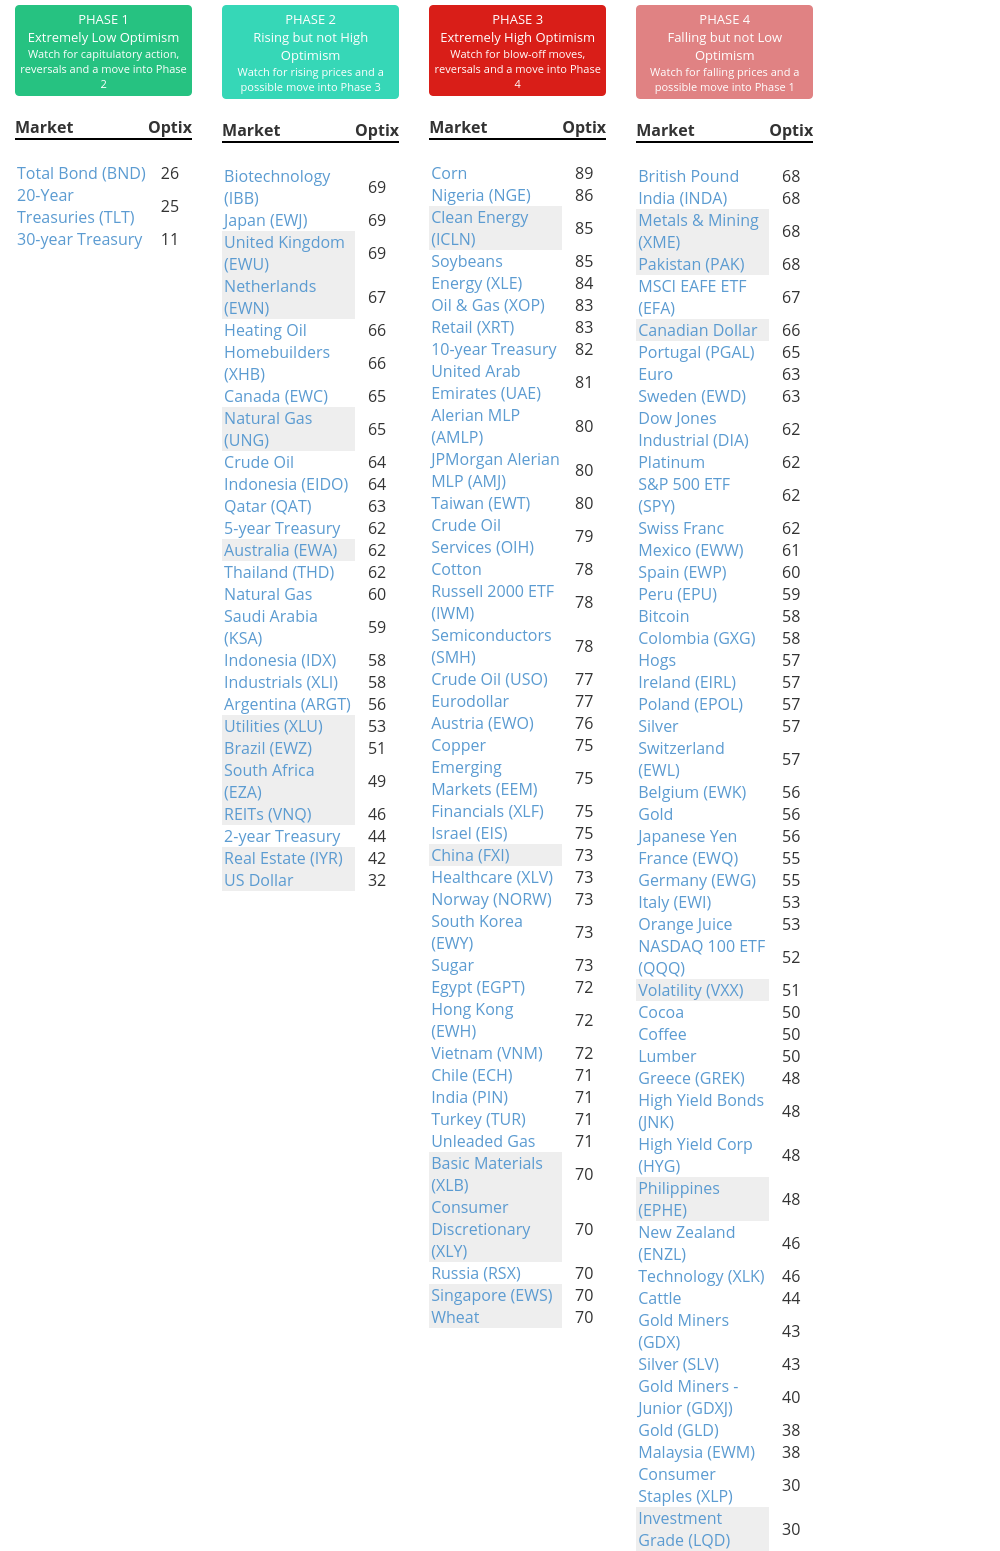
Phase Table
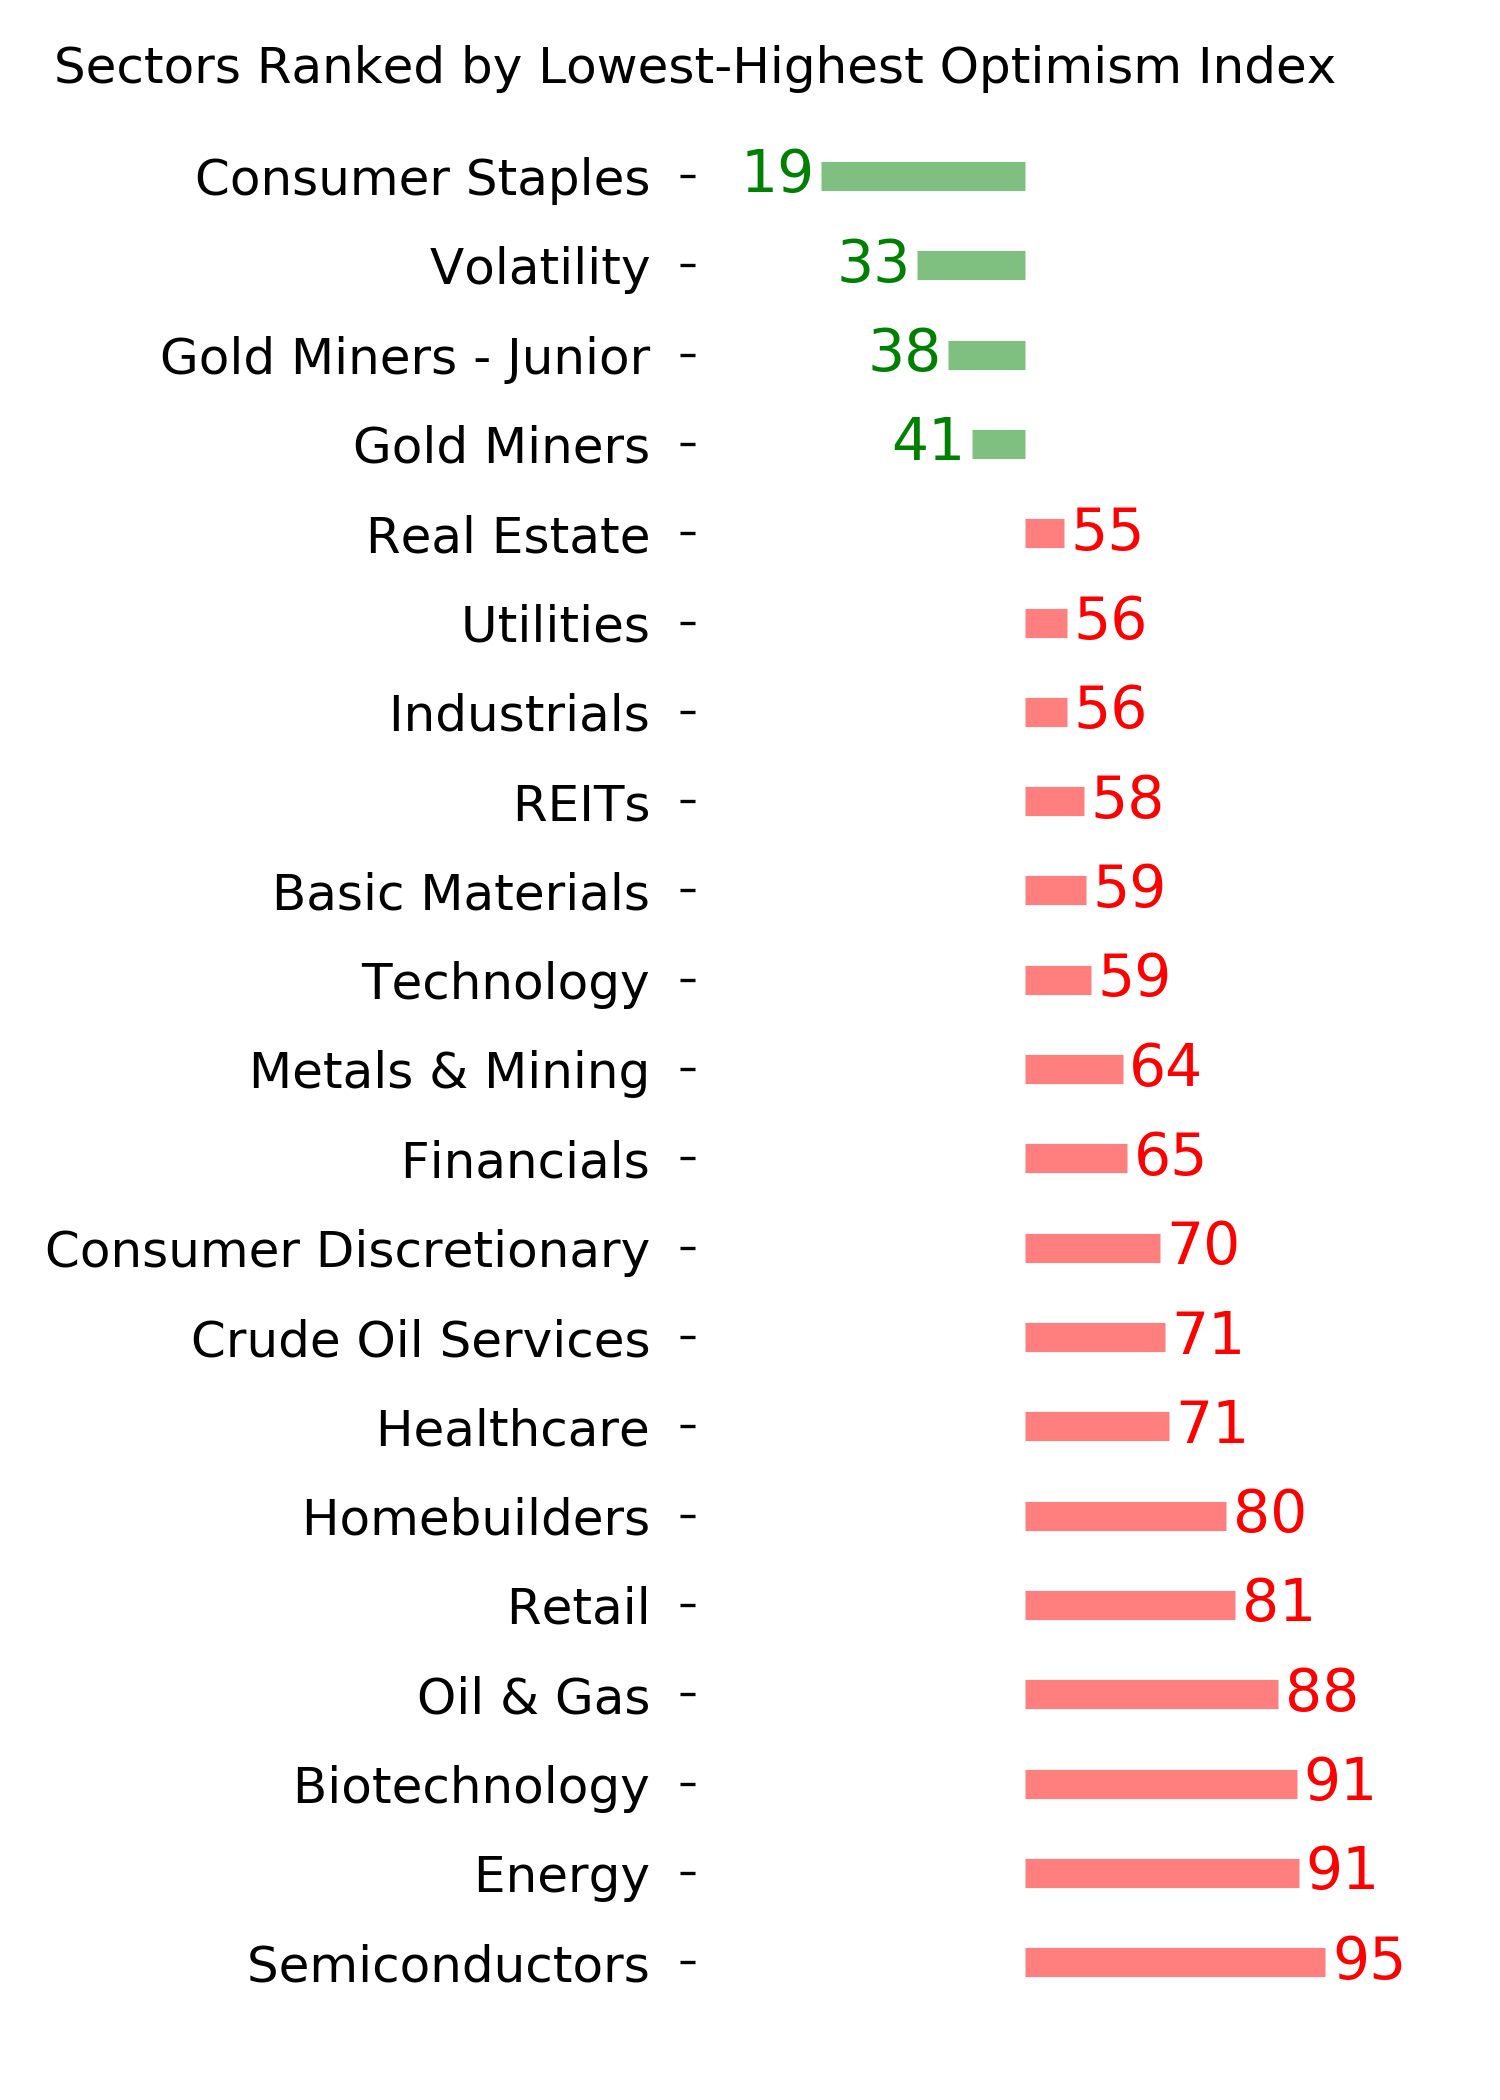
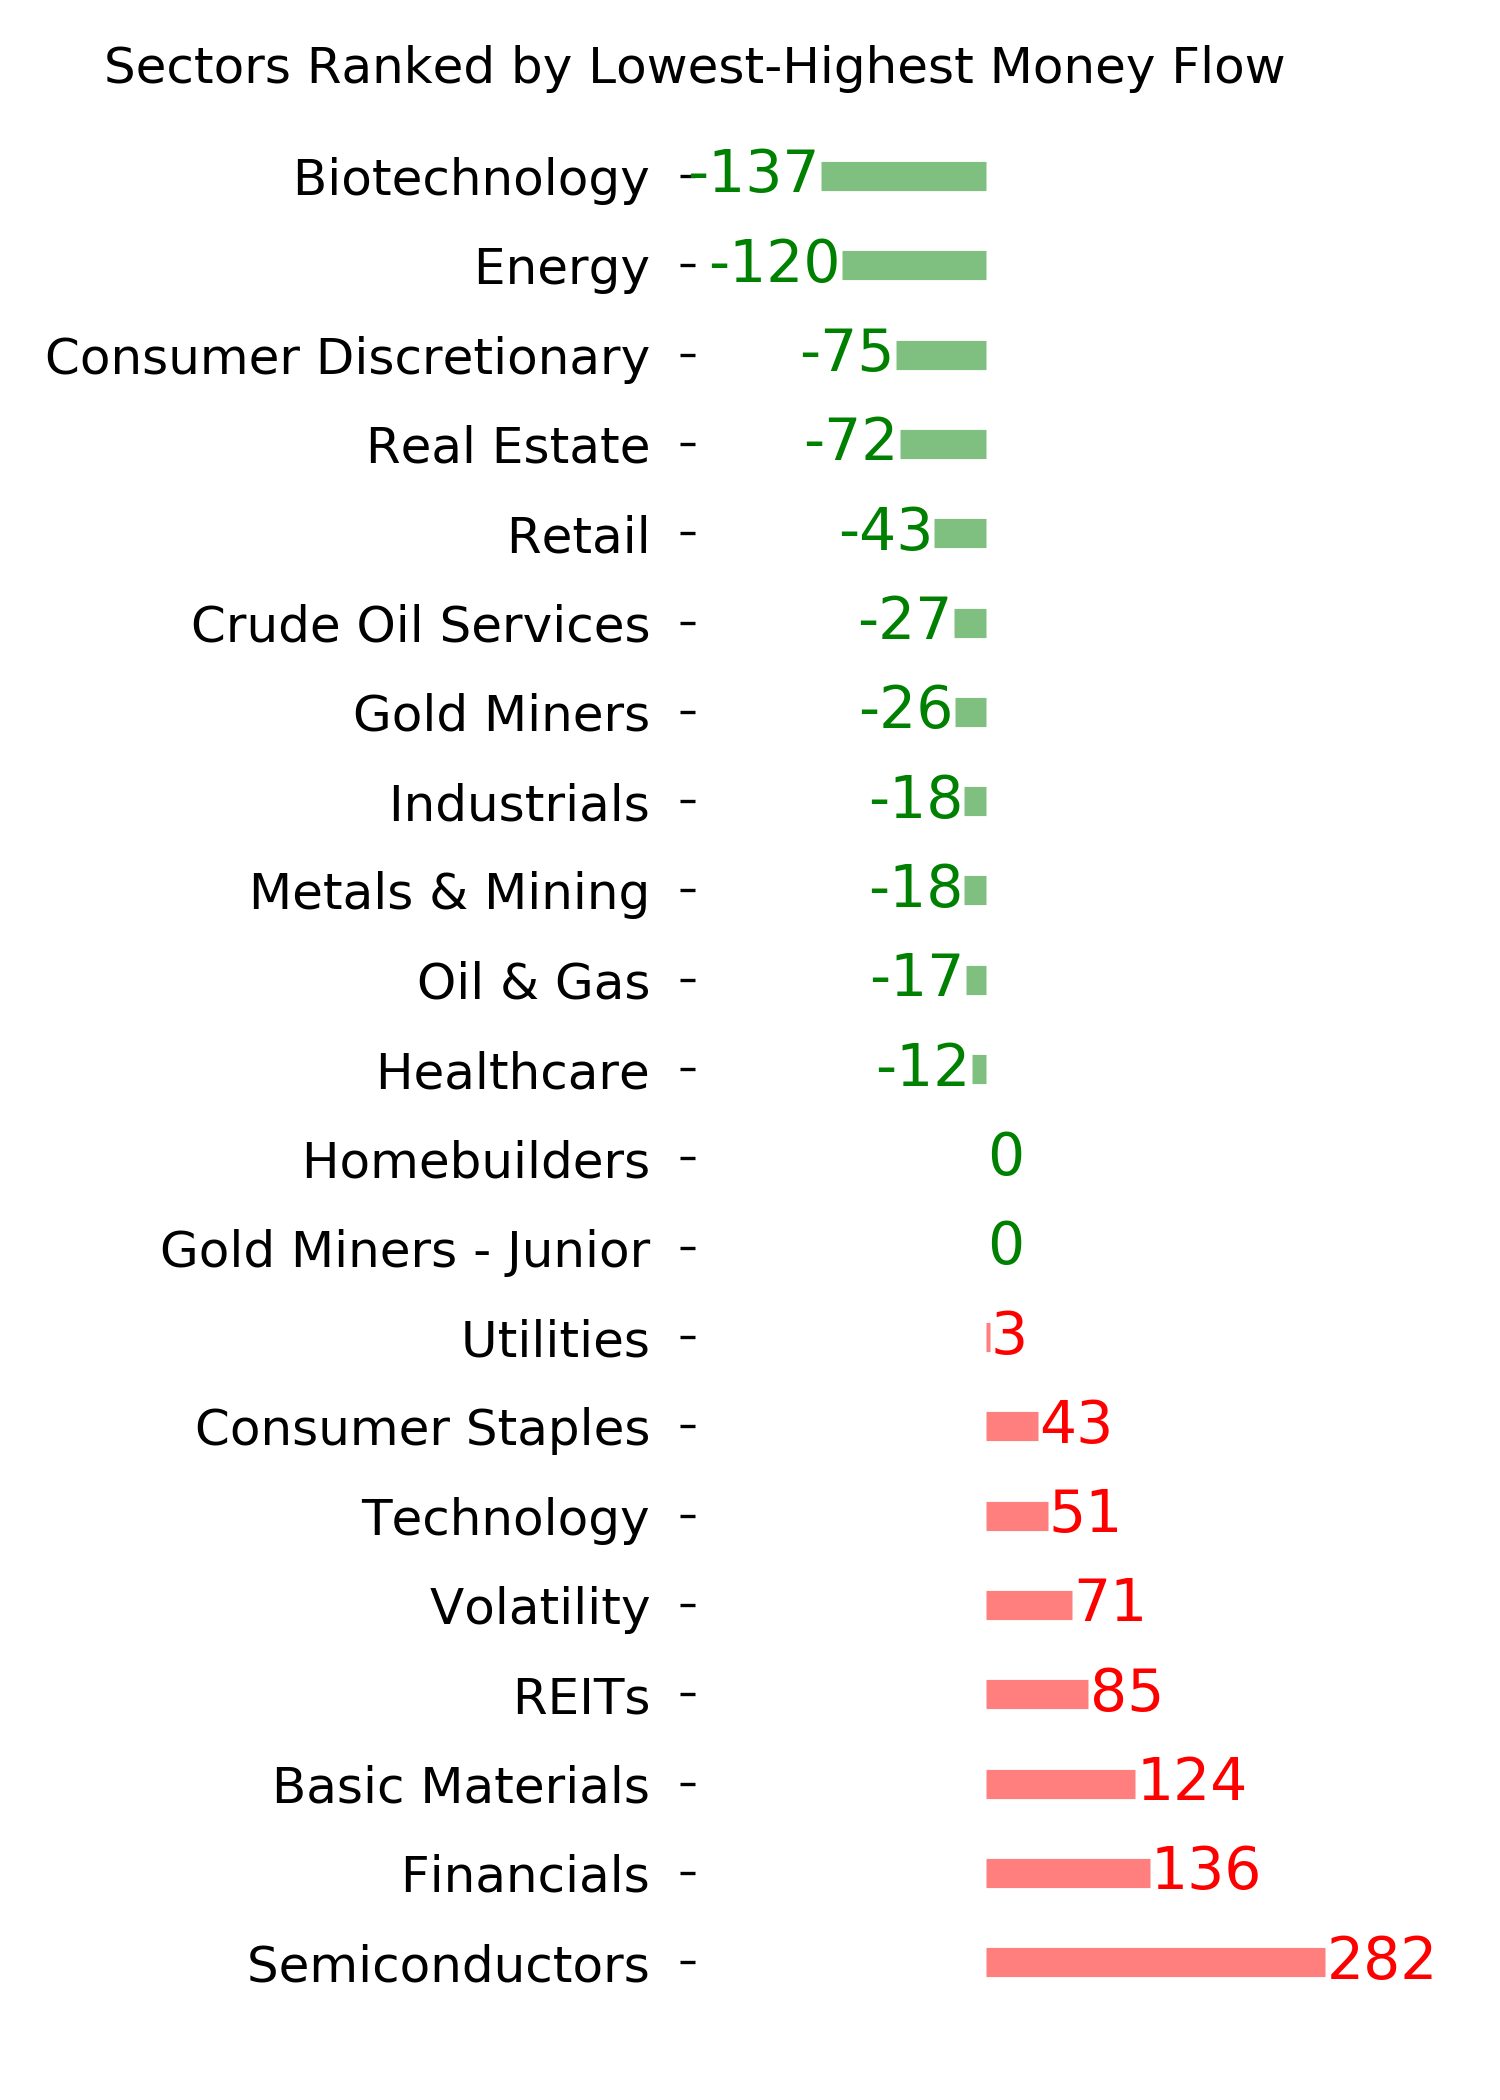
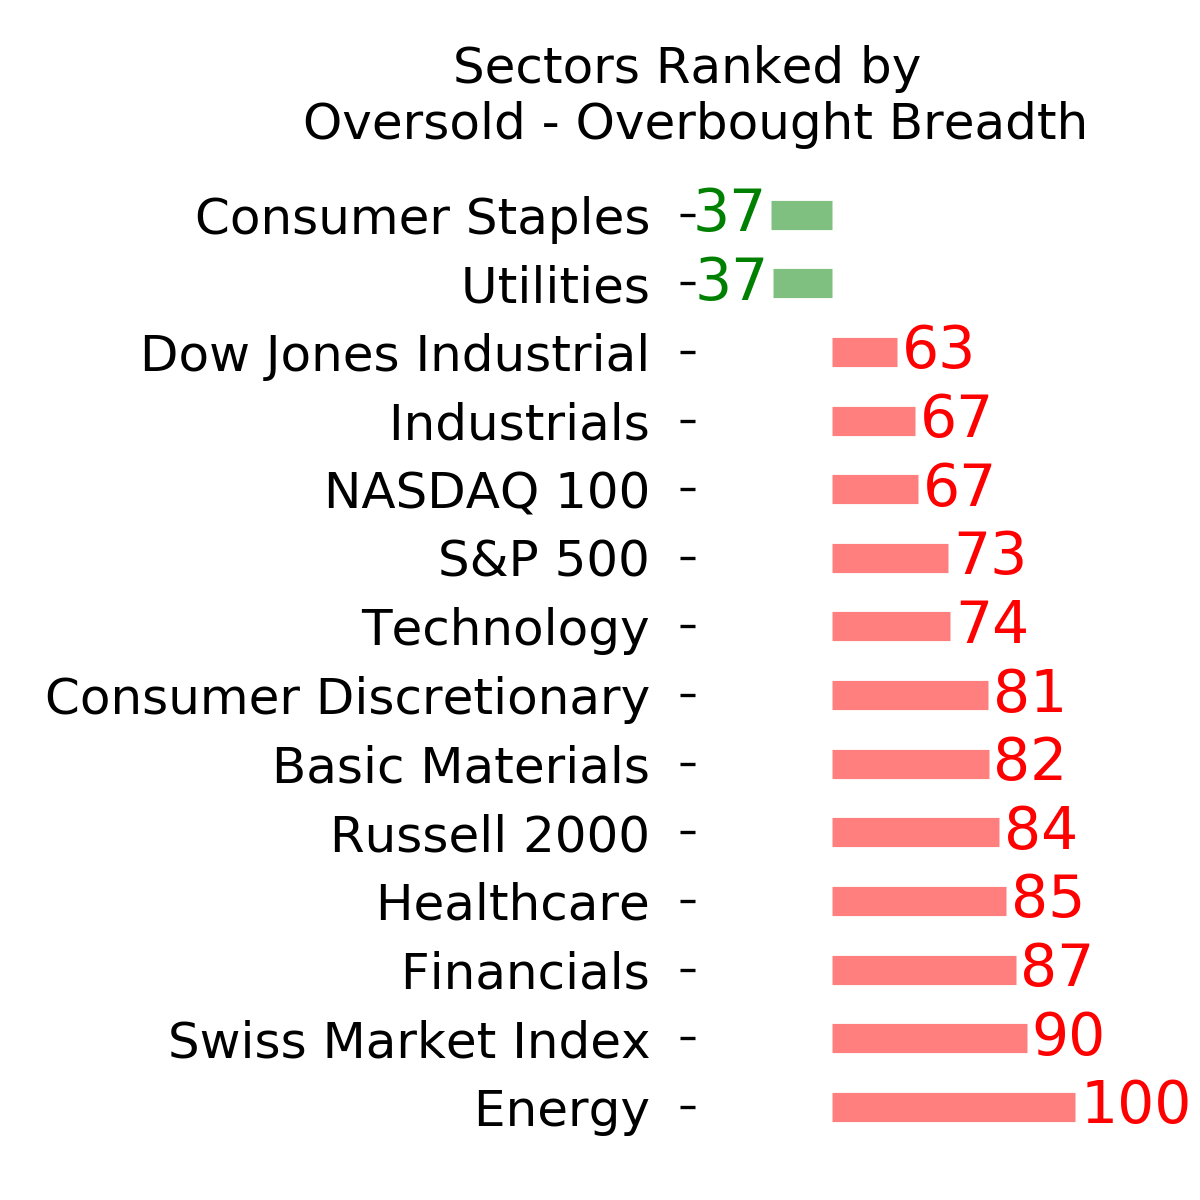
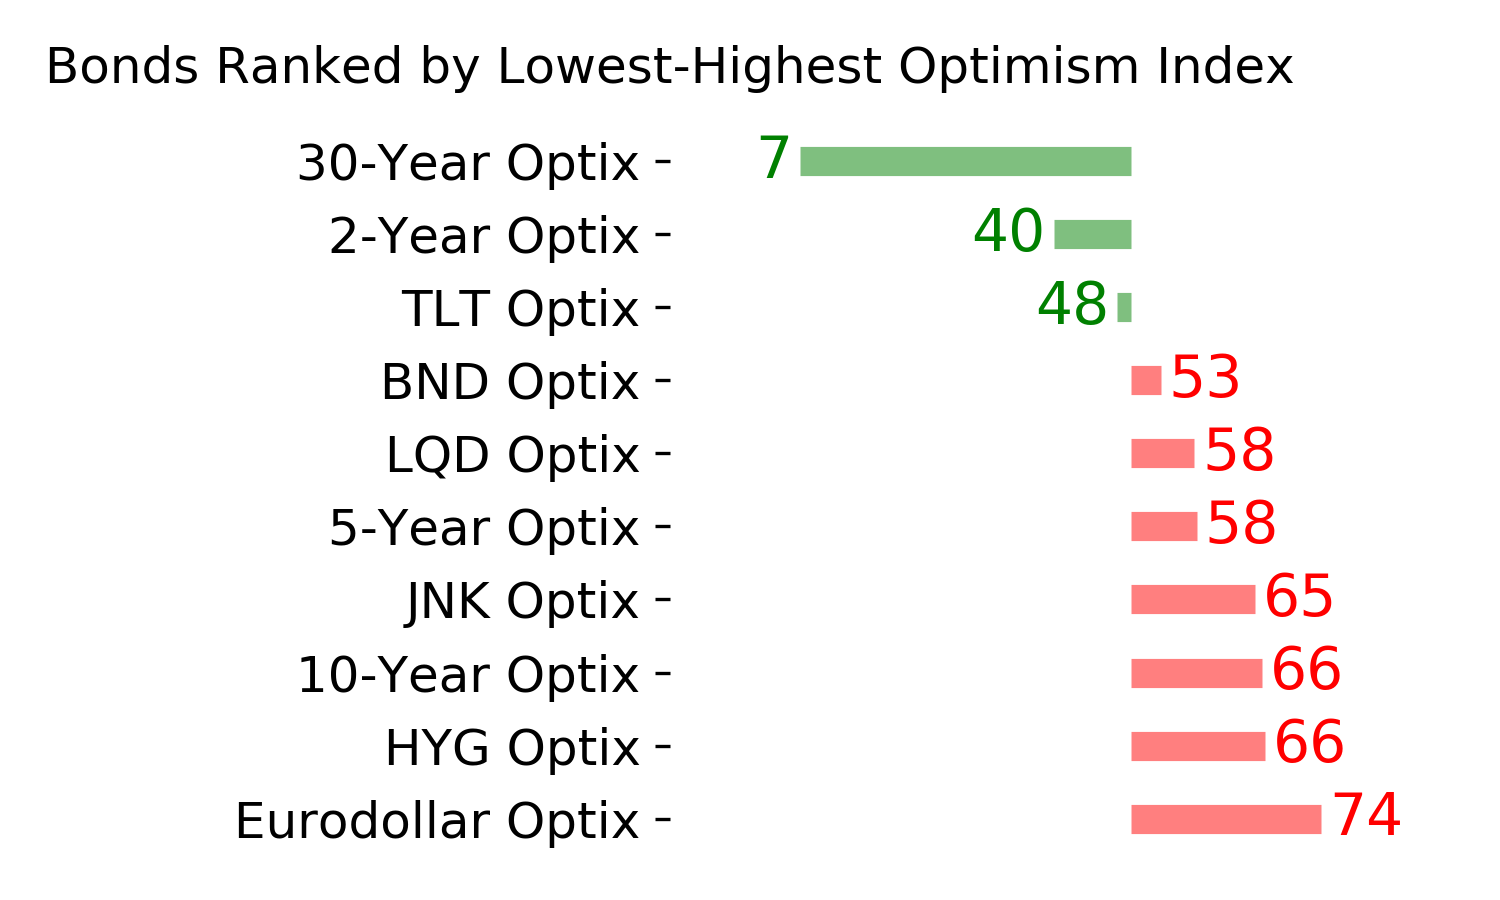
Ranks
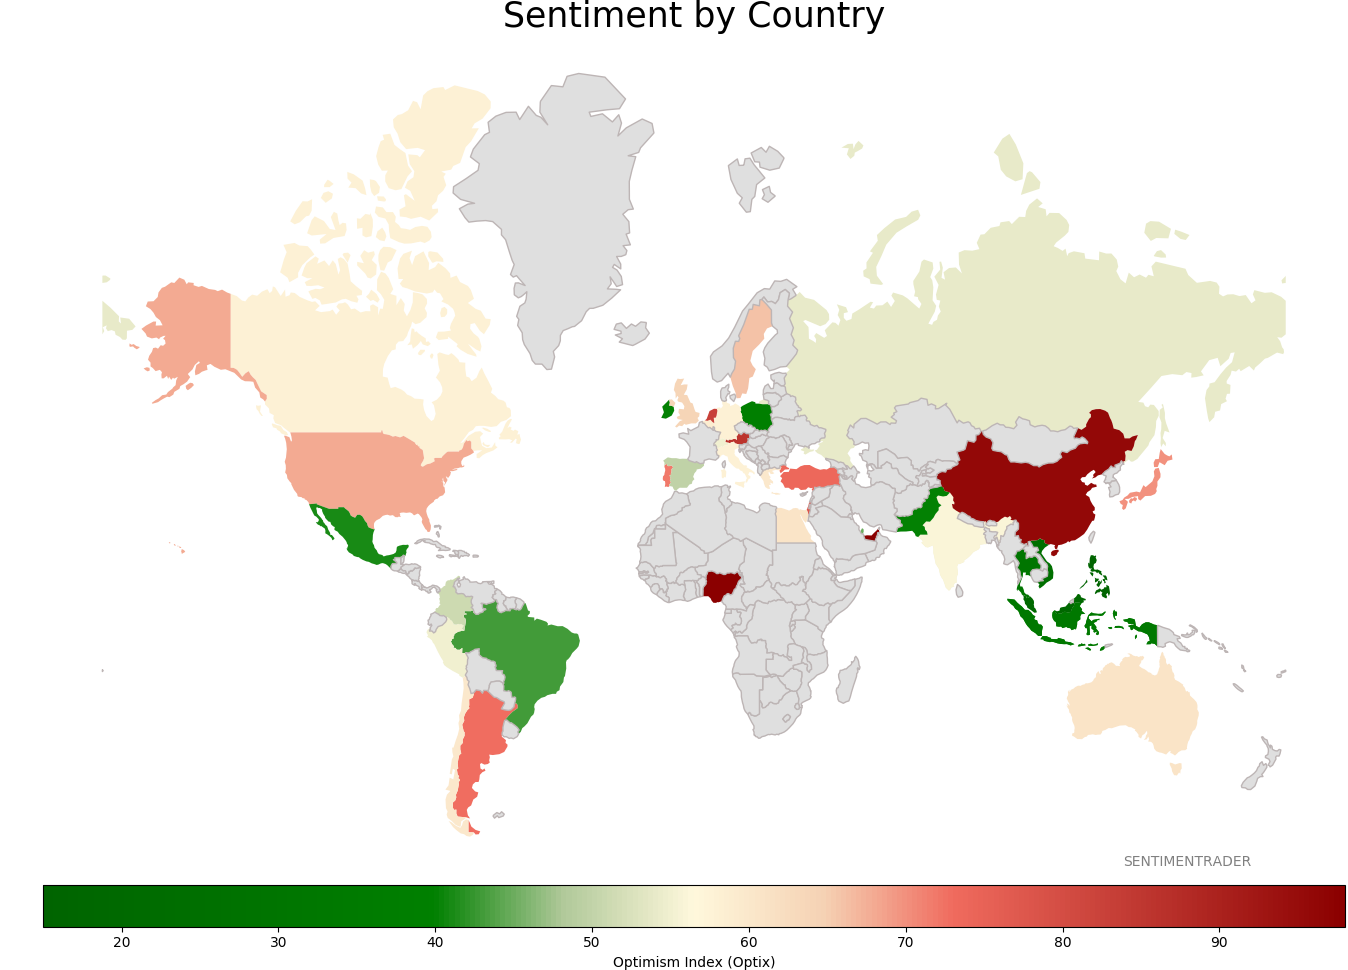
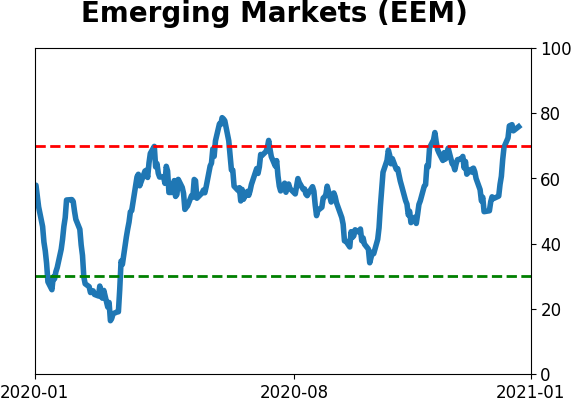
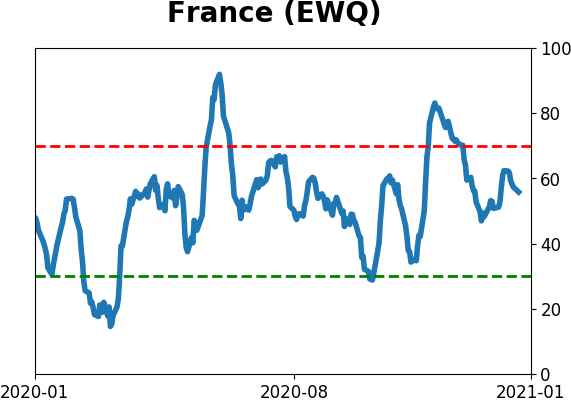
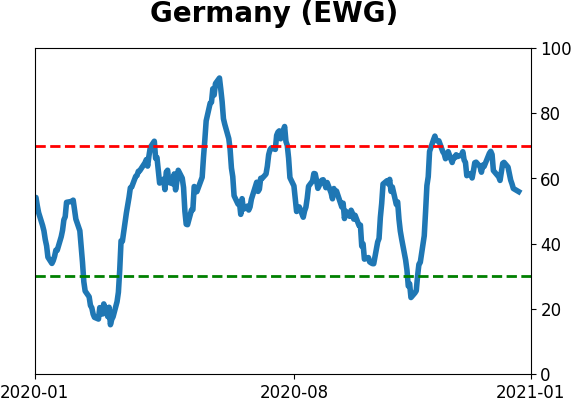
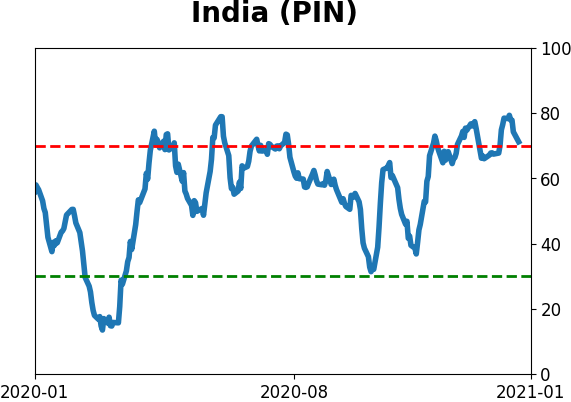
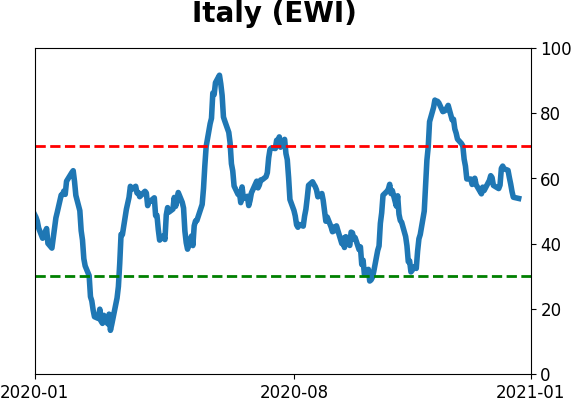
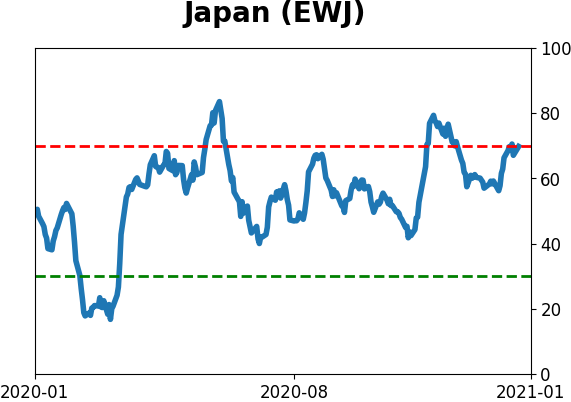
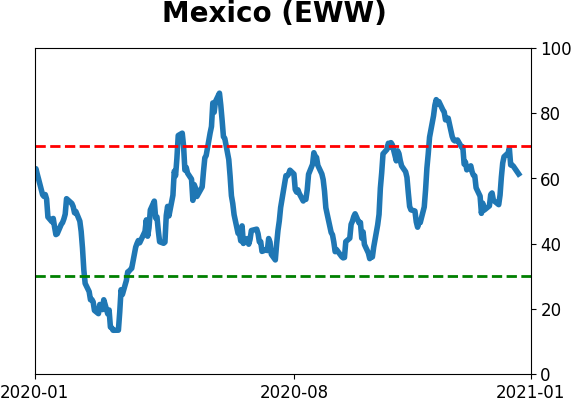
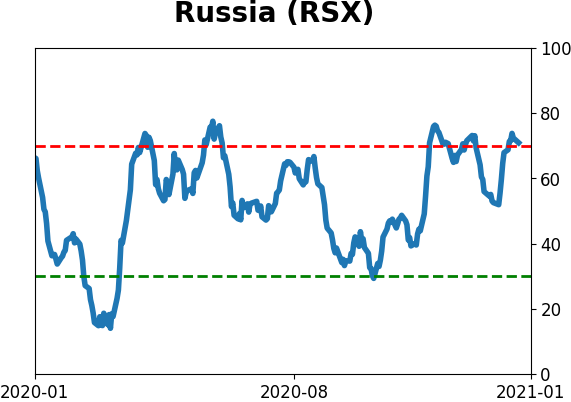
Sentiment Around The World
Optimism Index Thumbnails
|
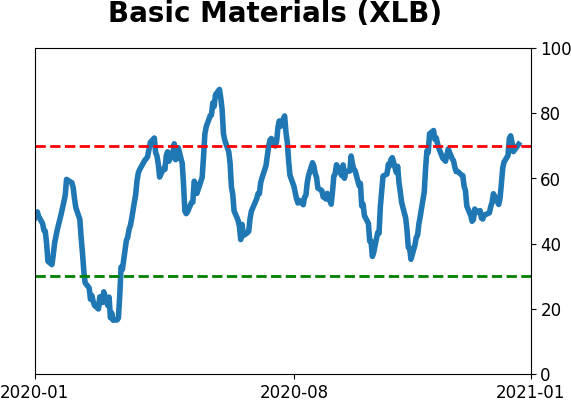
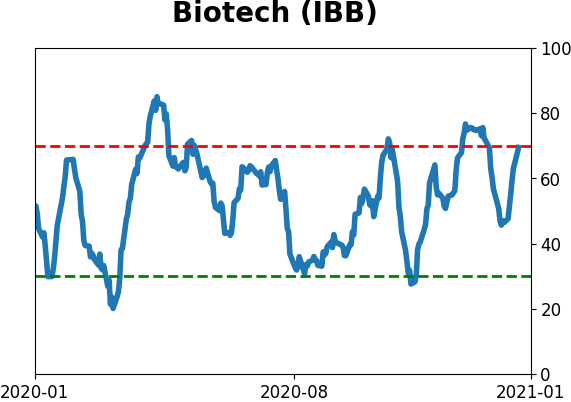
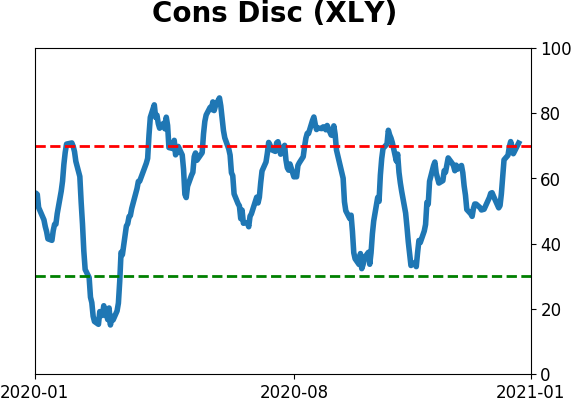
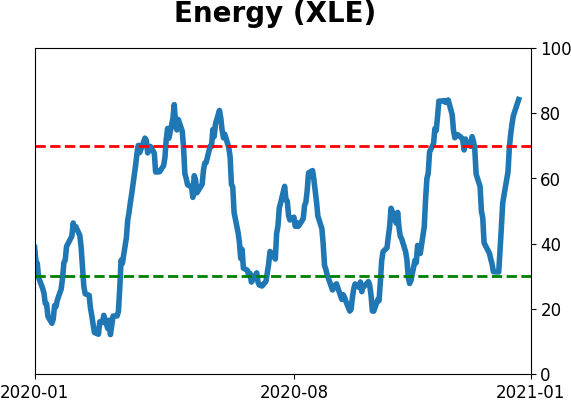
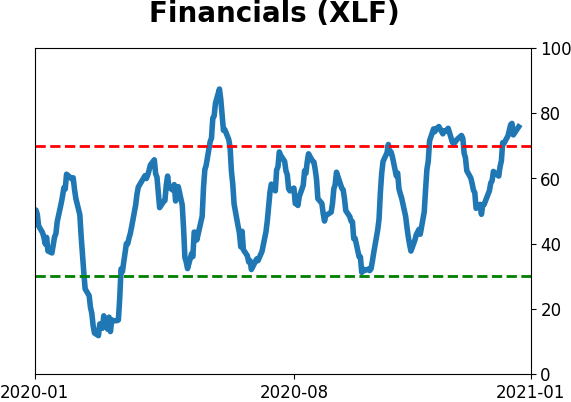
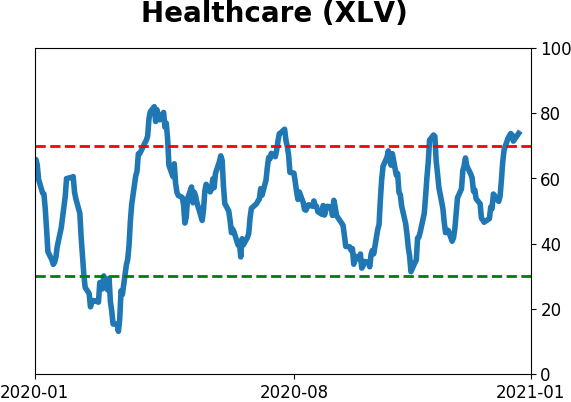
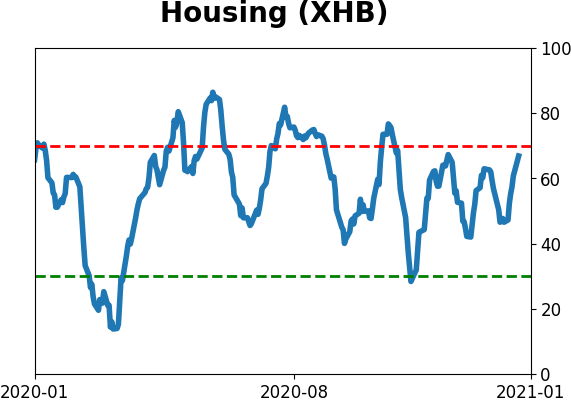
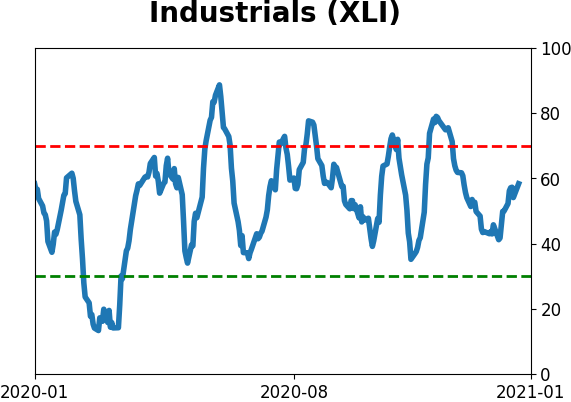
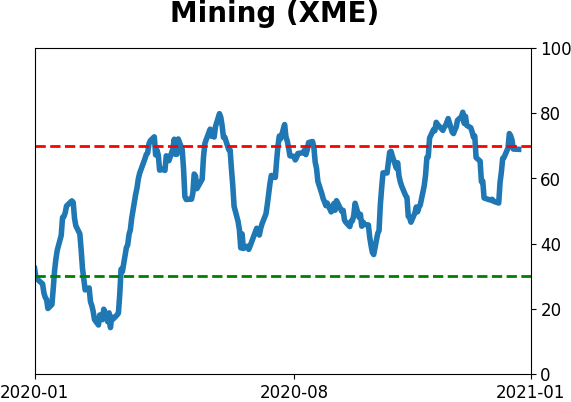
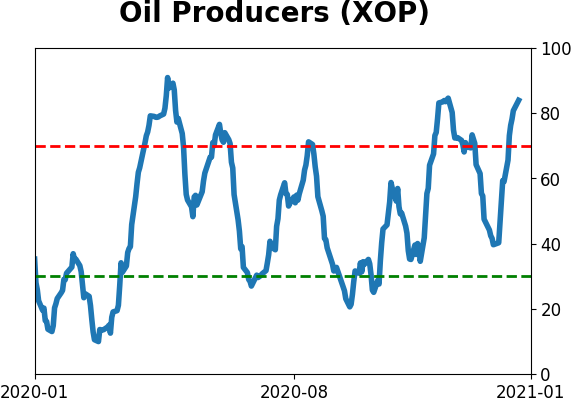
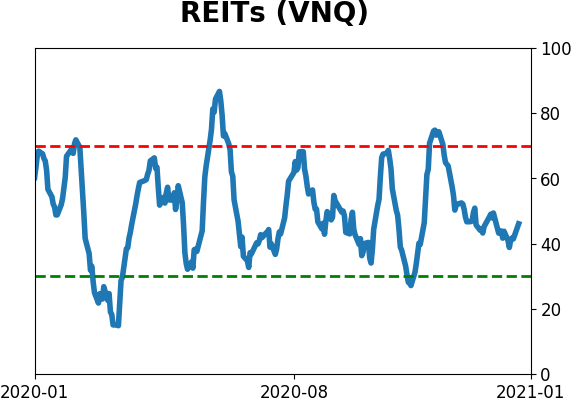
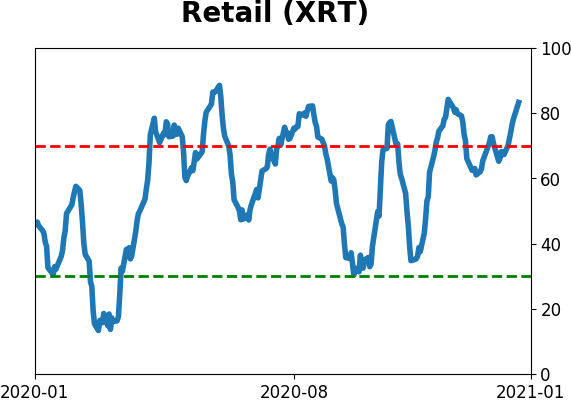
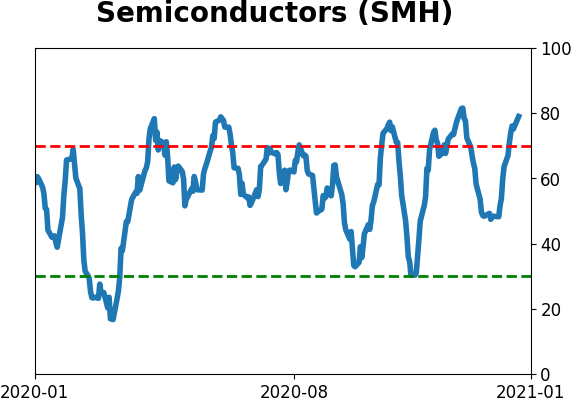
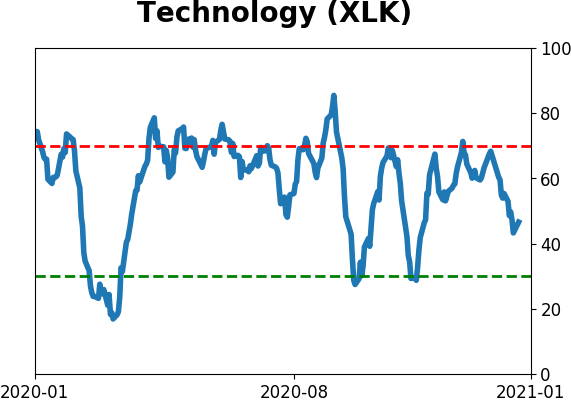
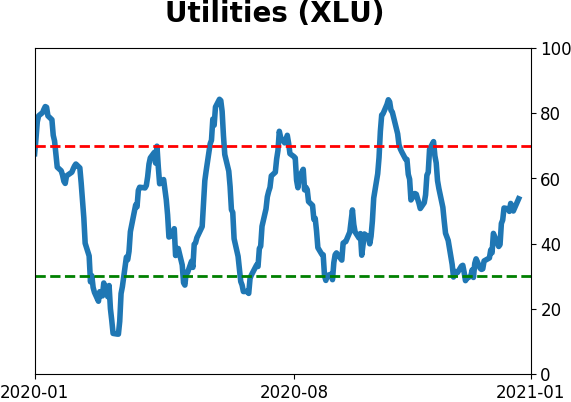
Sector ETF's - 10-Day Moving Average
|
|
|
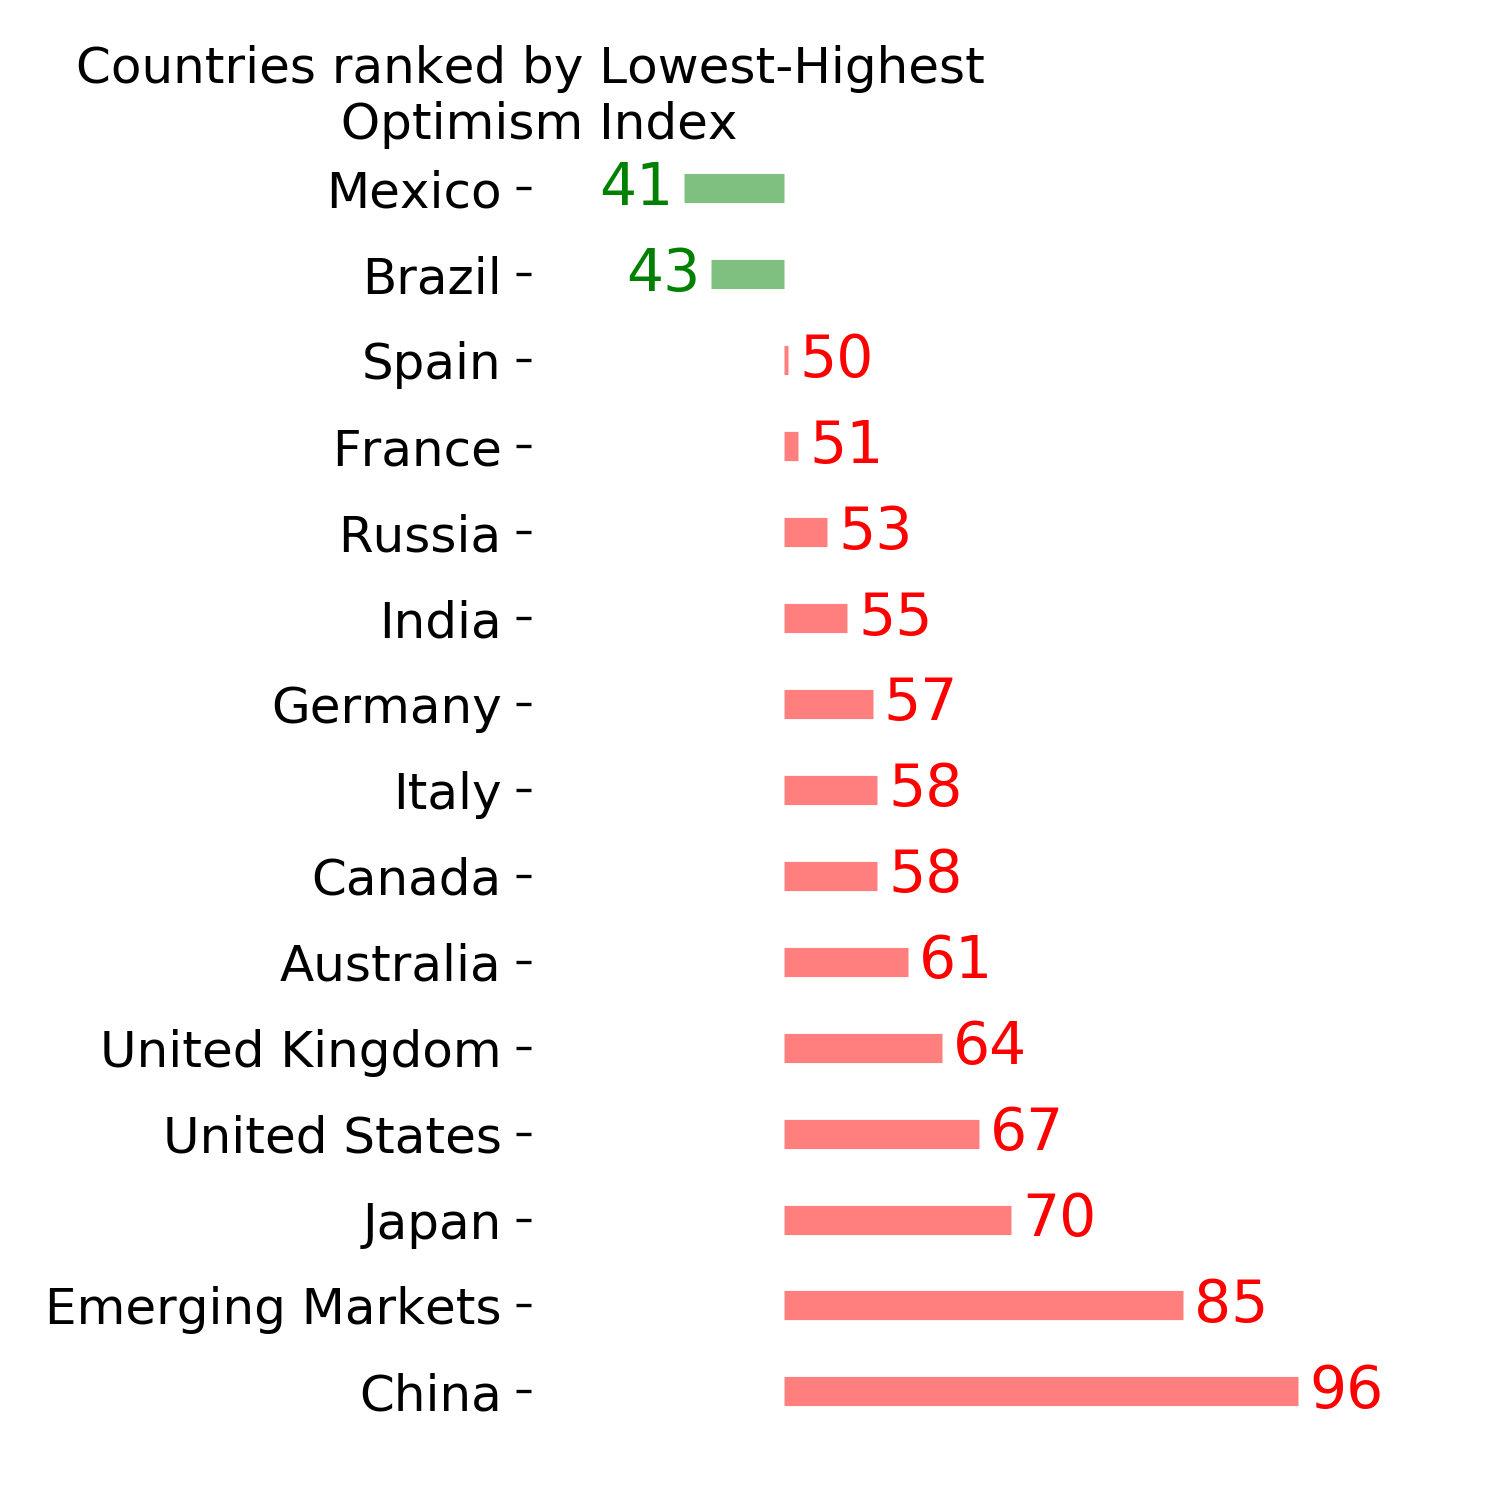
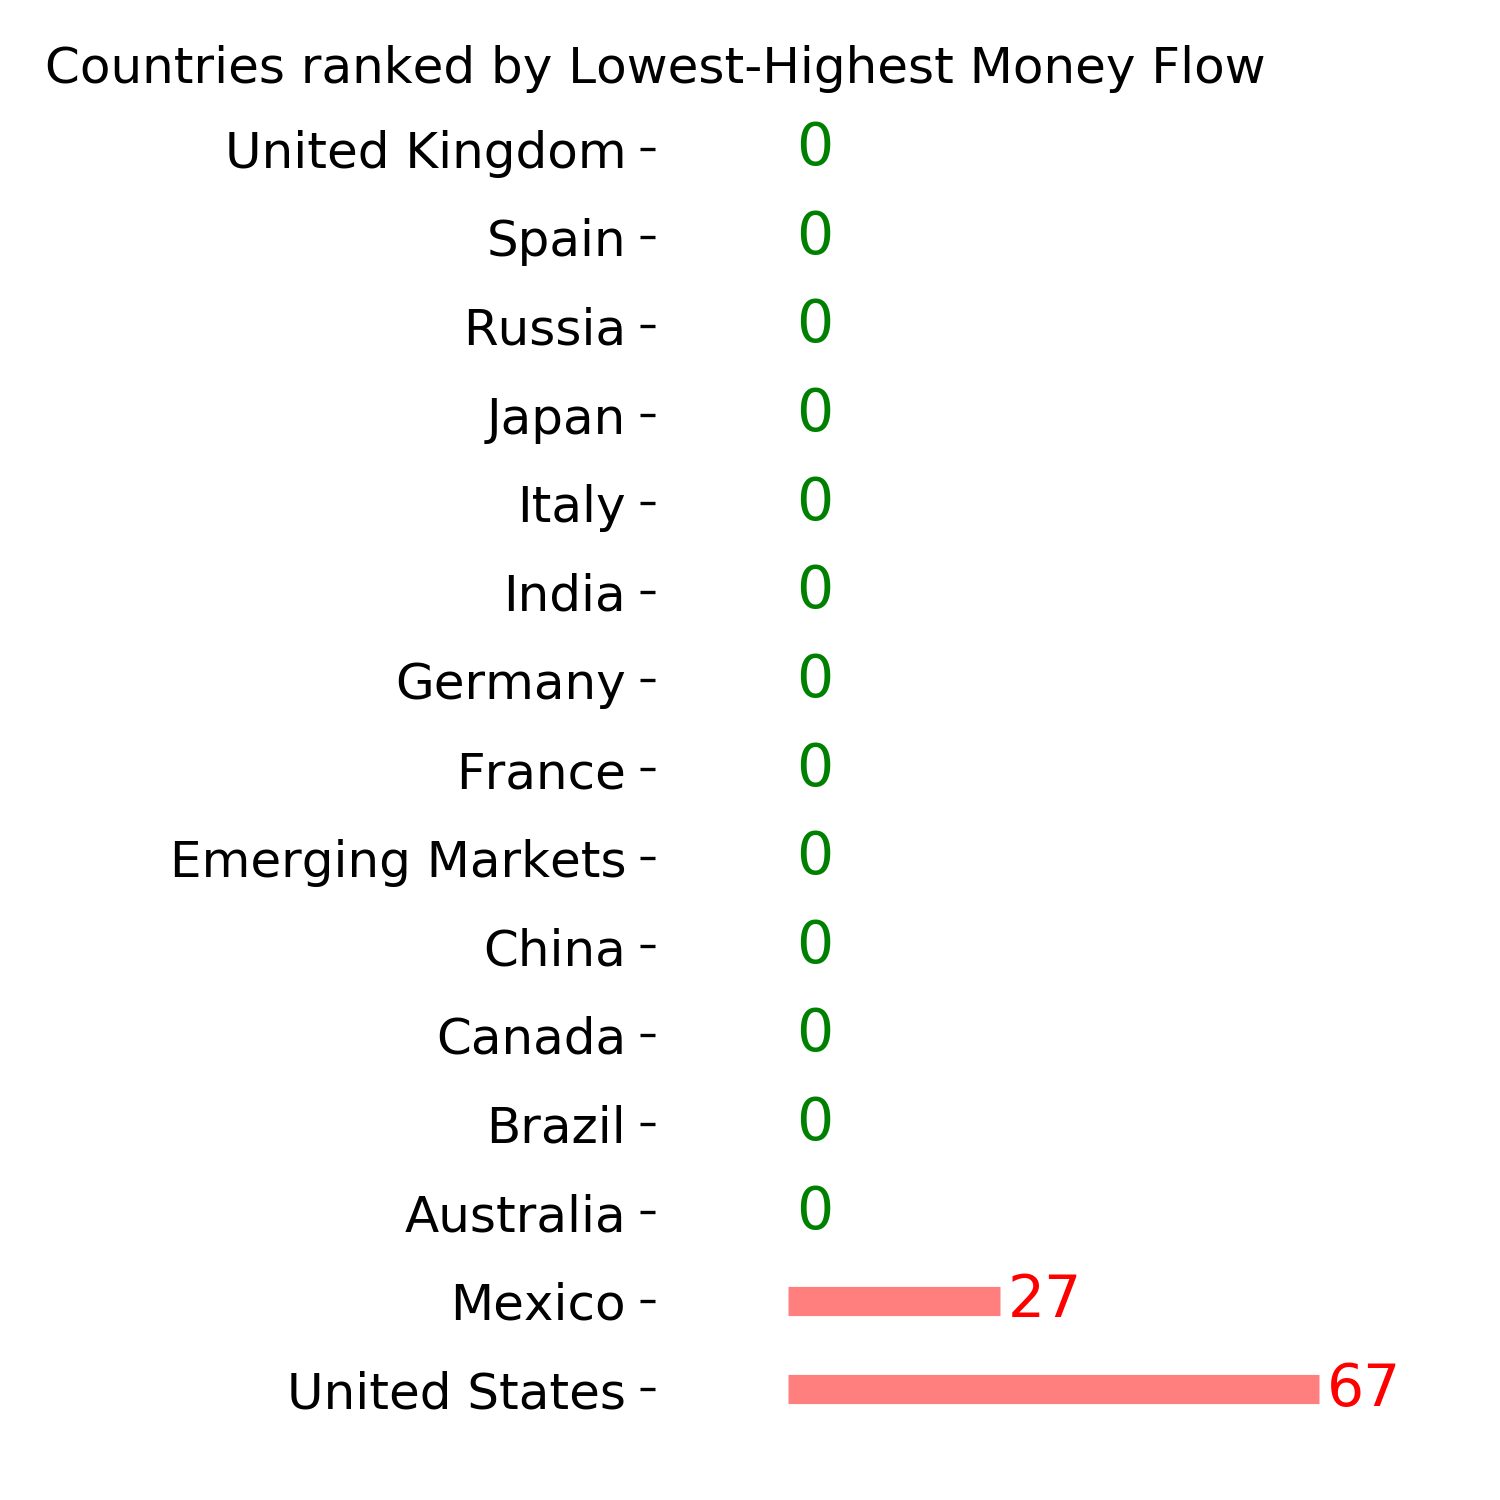
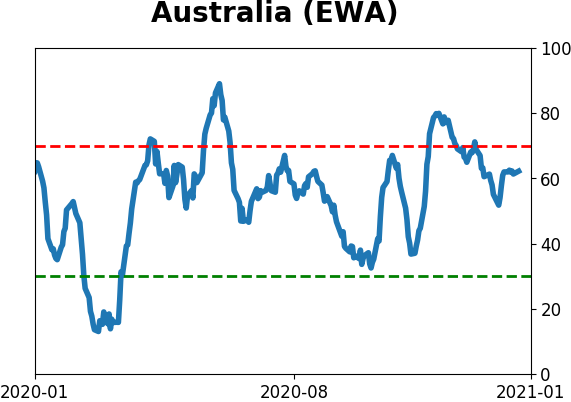
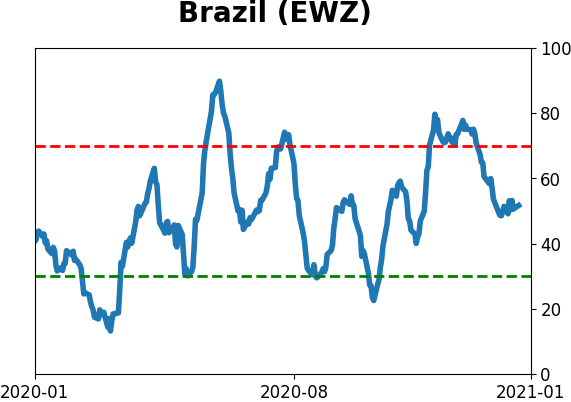
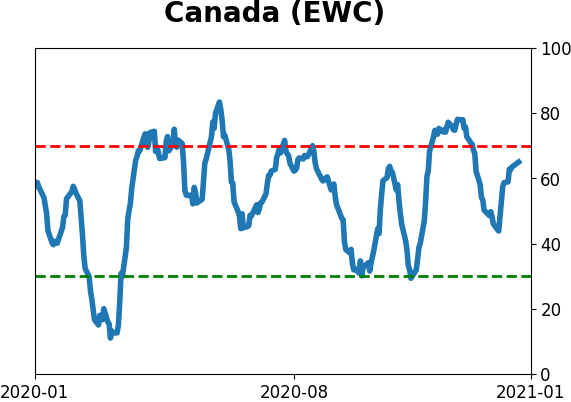
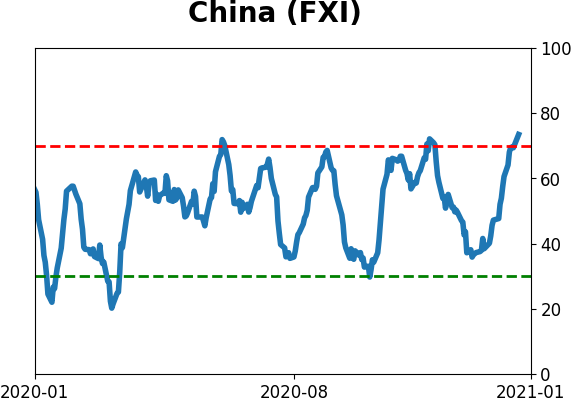
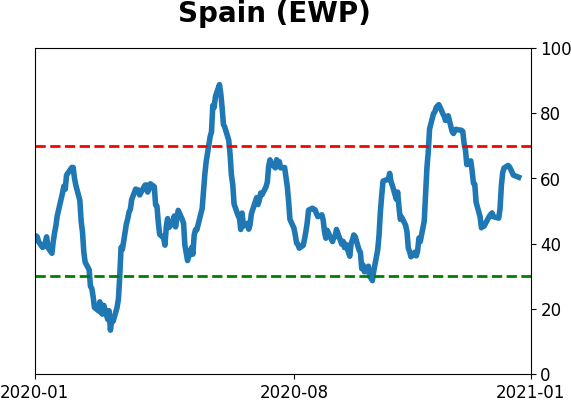
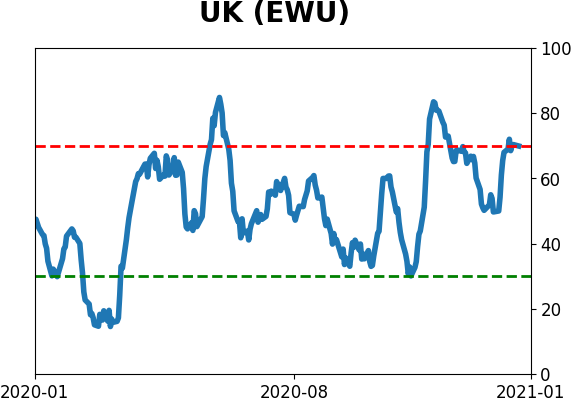
Country ETF's - 10-Day Moving Average
|
|
|
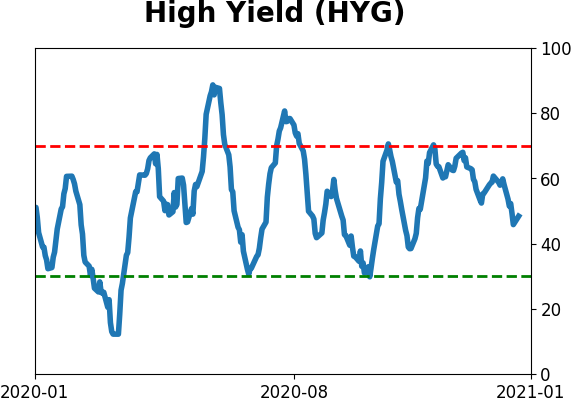
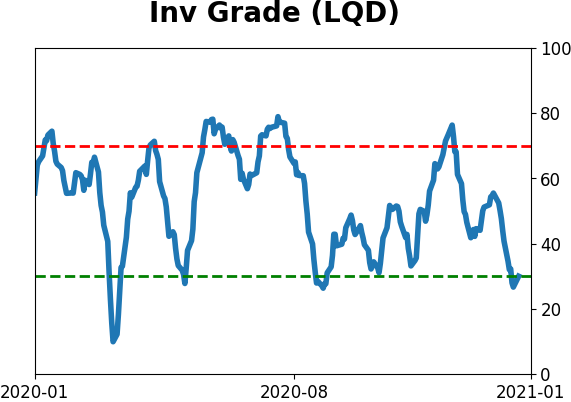
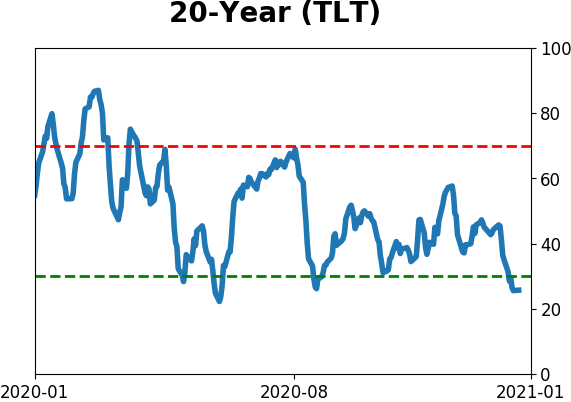
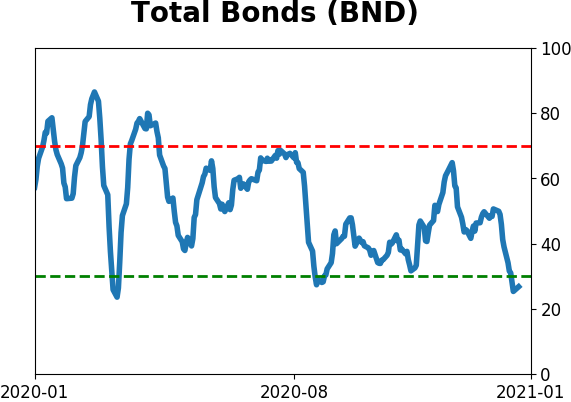
Bond ETF's - 10-Day Moving Average
|
|
|
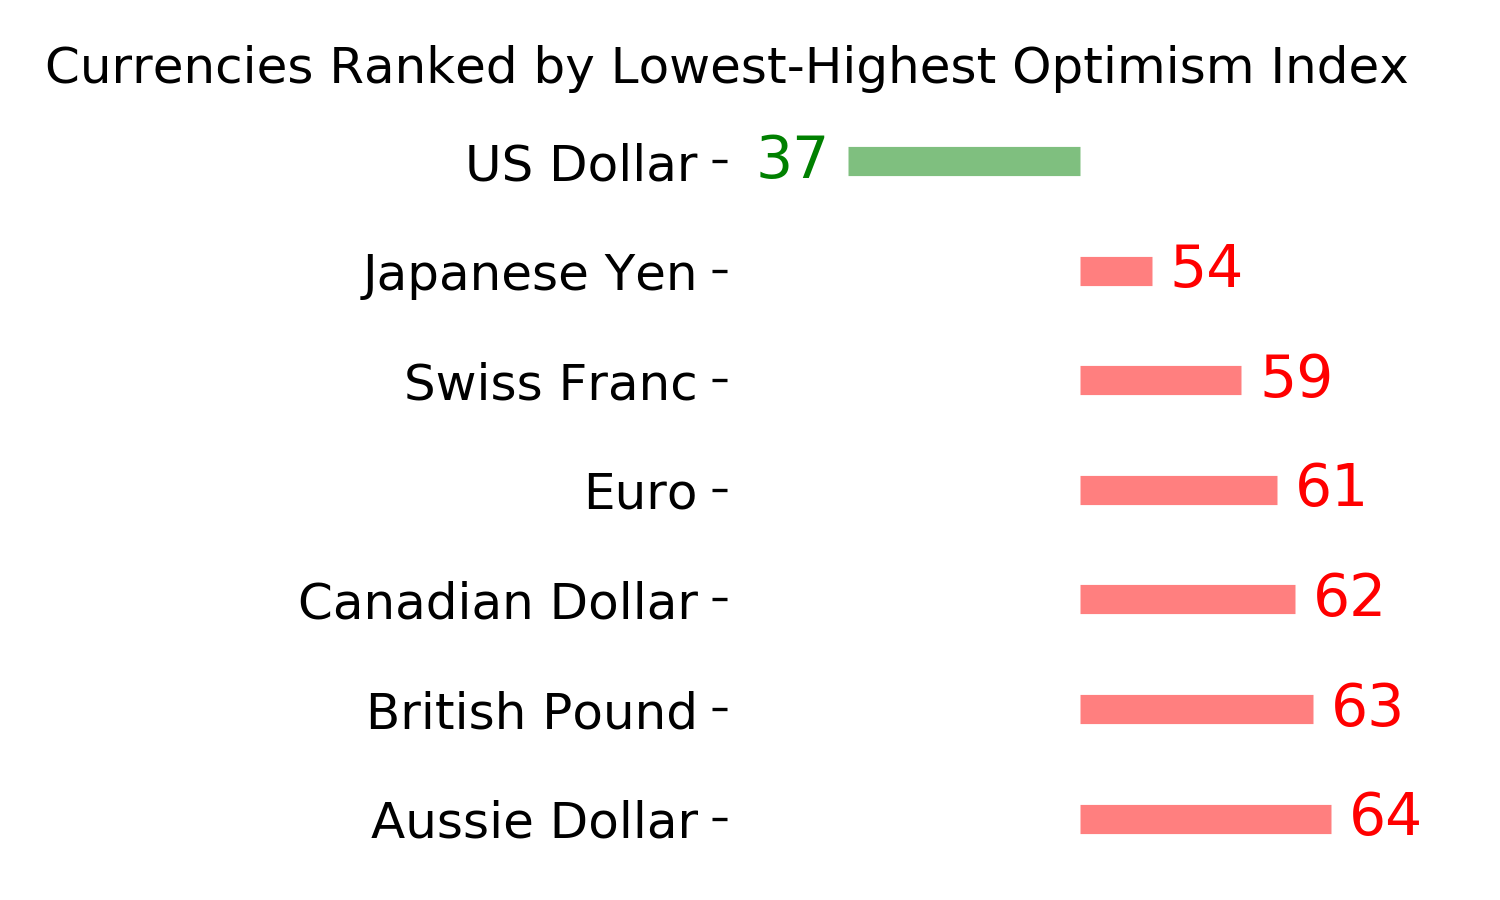
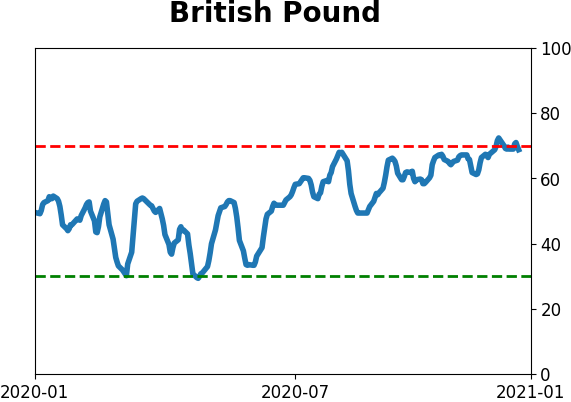
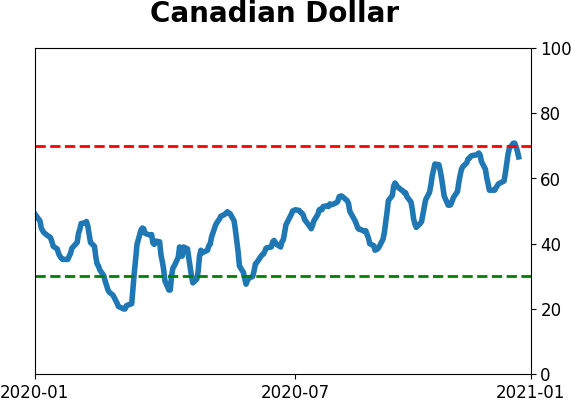
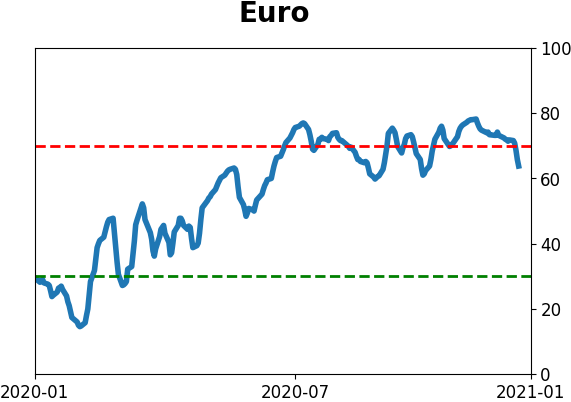
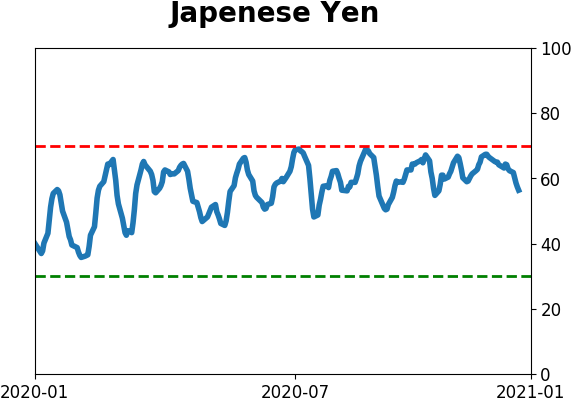
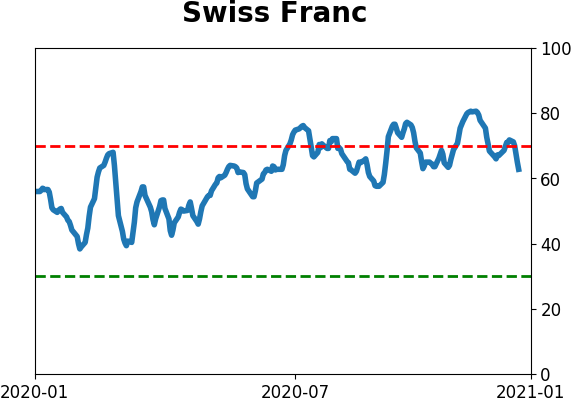
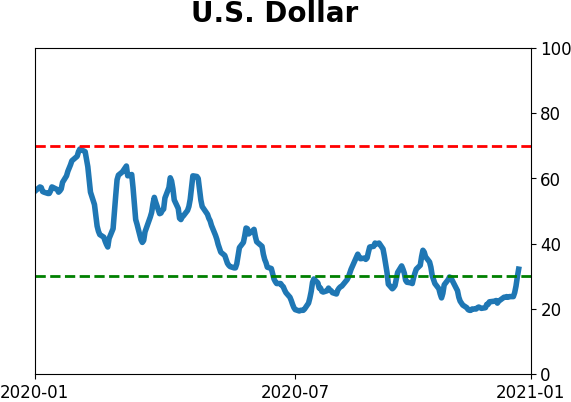
Currency ETF's - 5-Day Moving Average
|
|
|
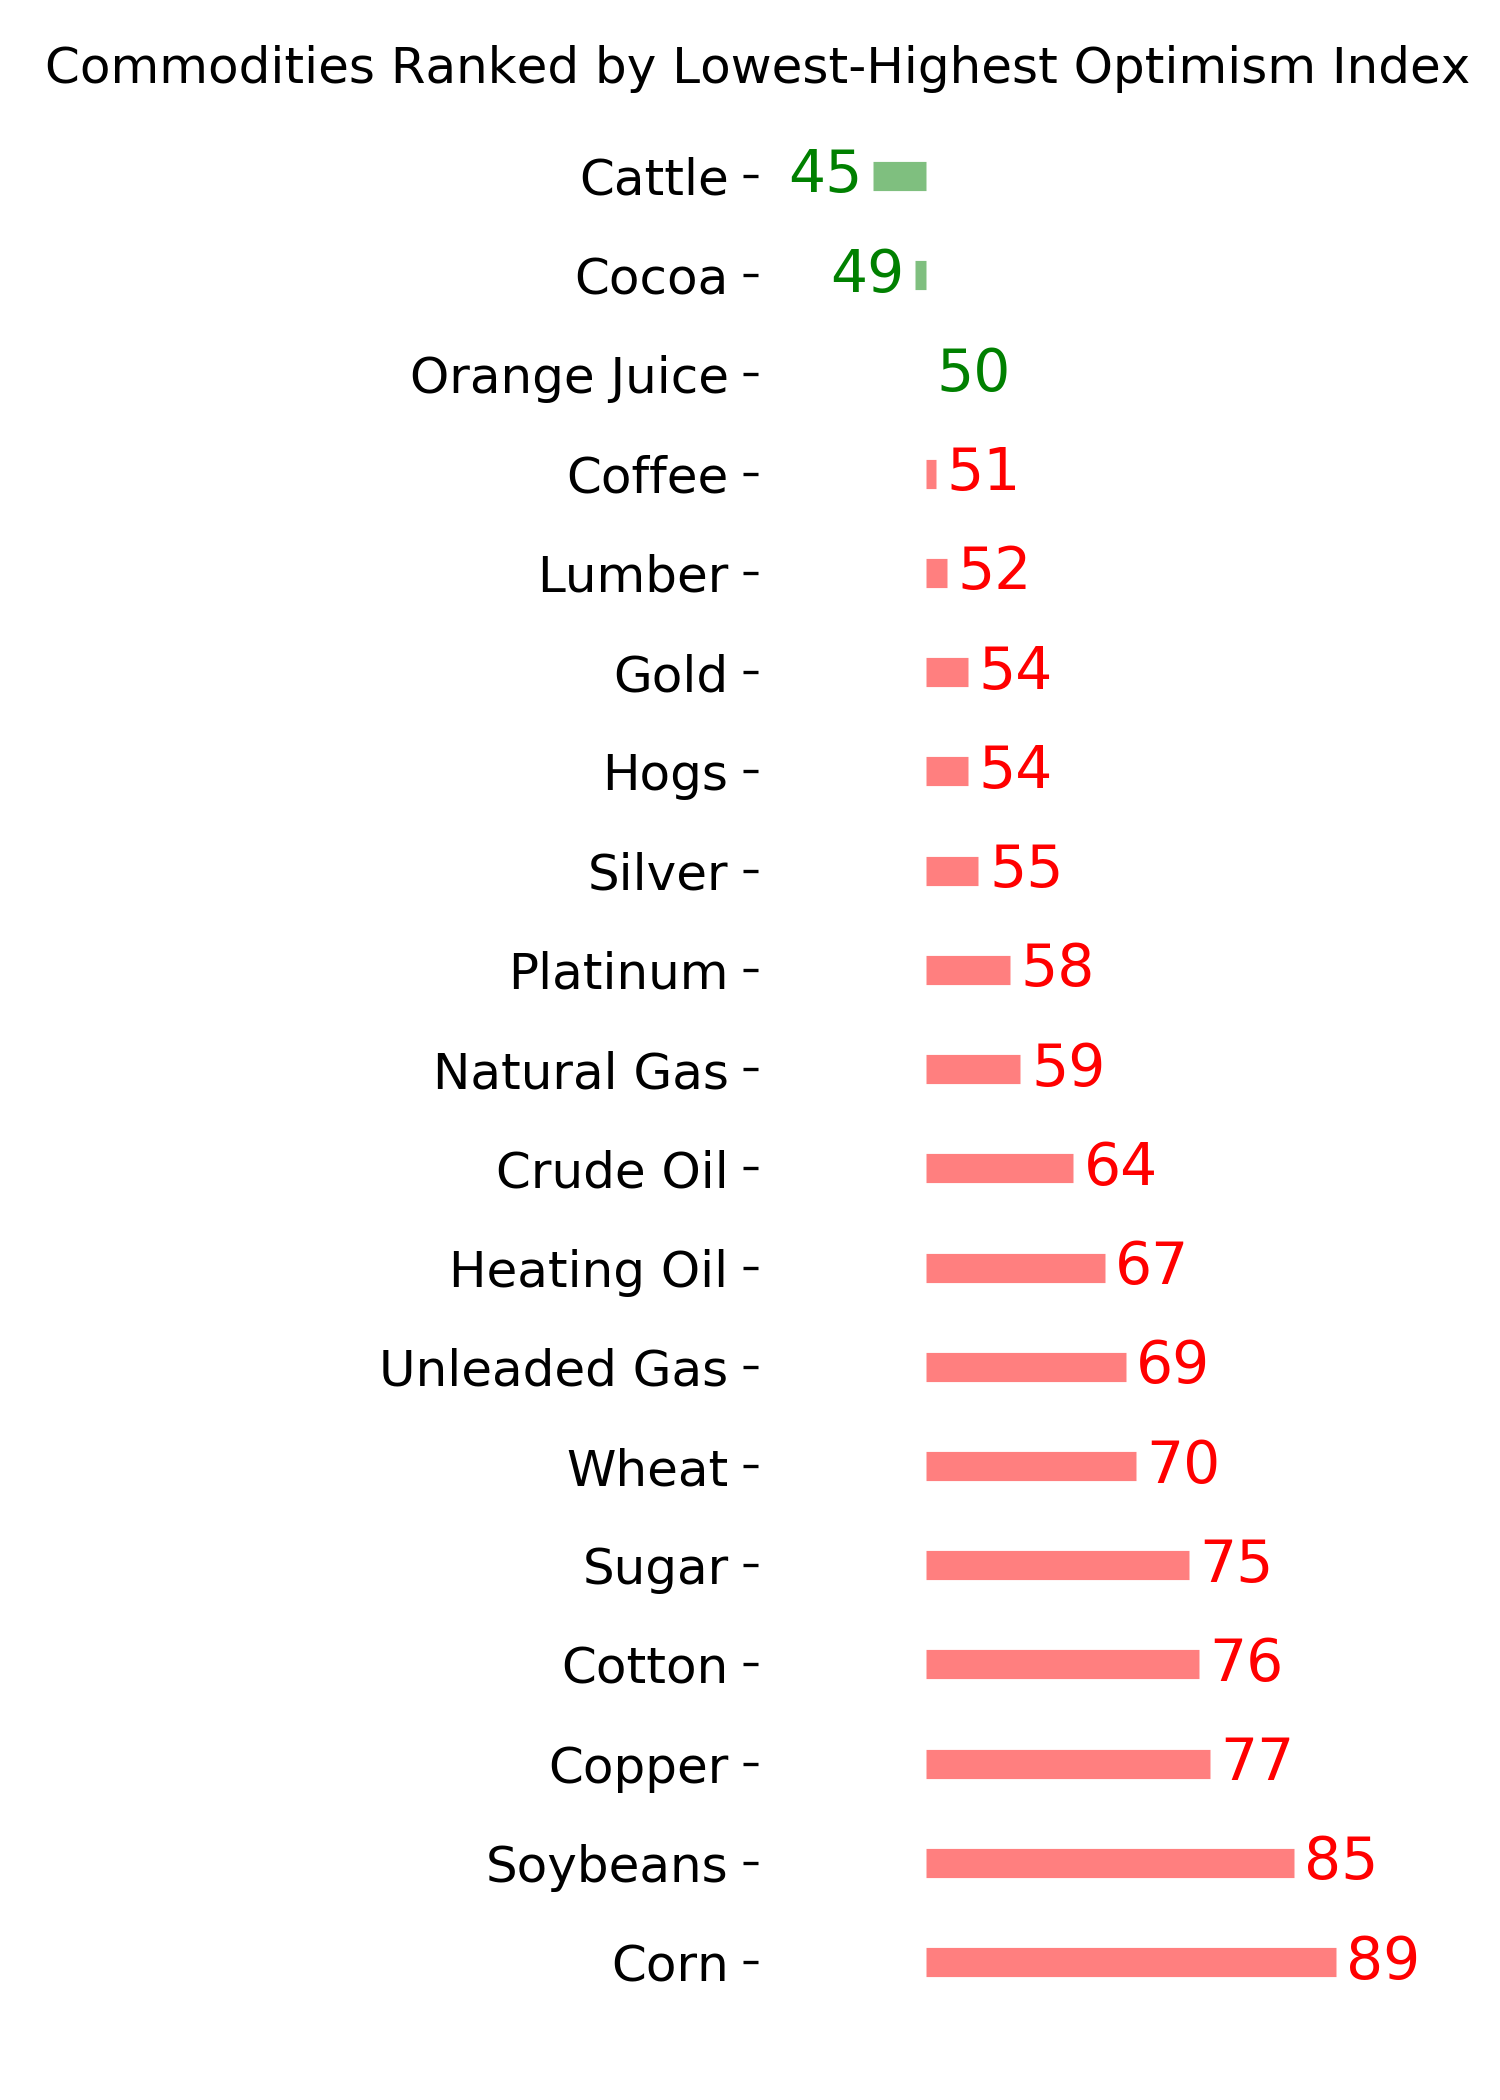
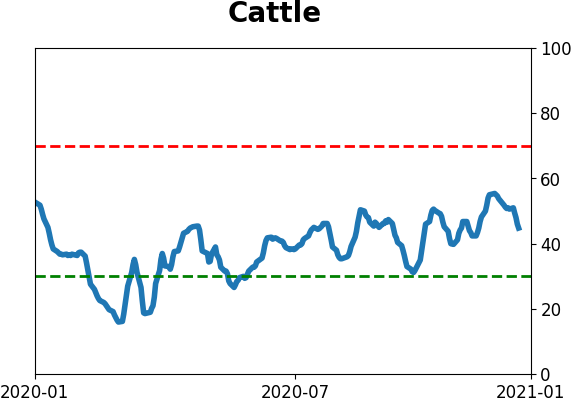
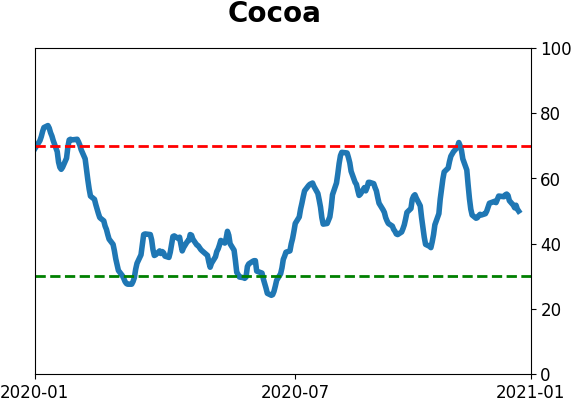
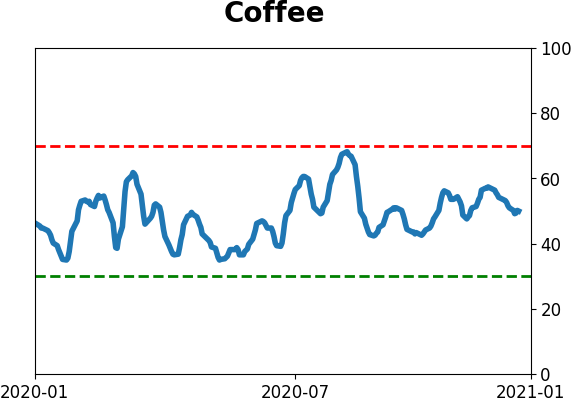
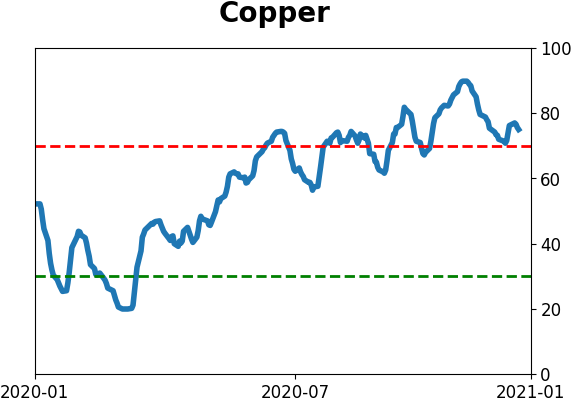
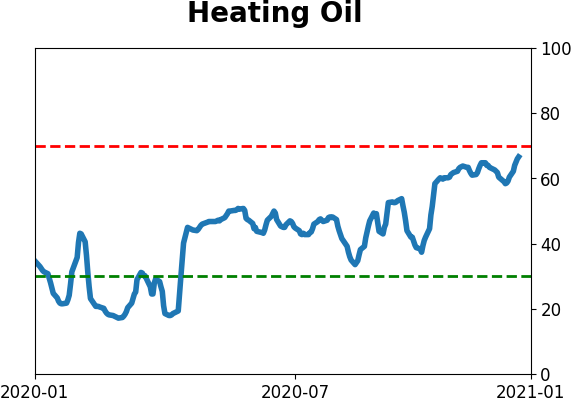
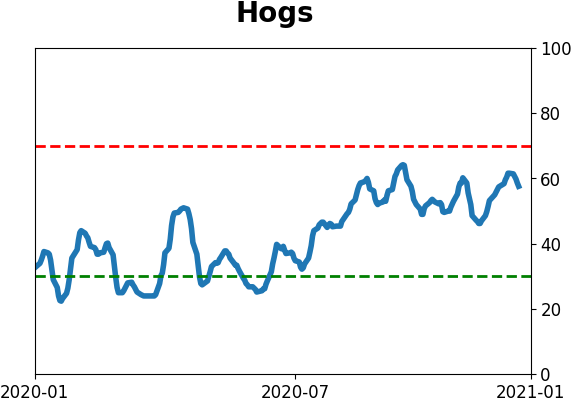
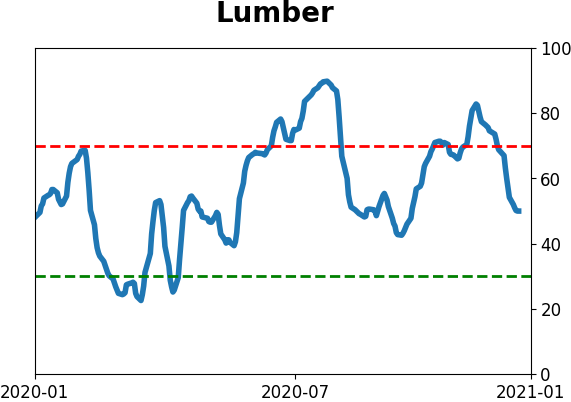
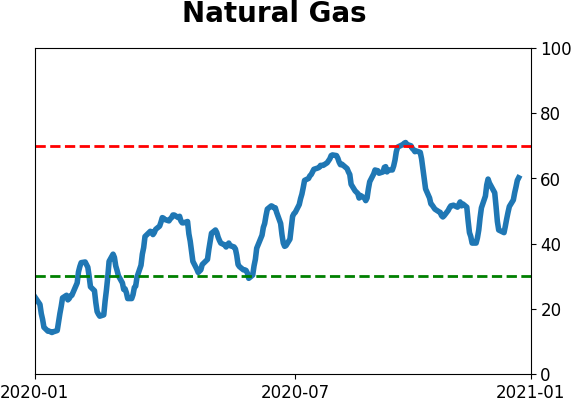
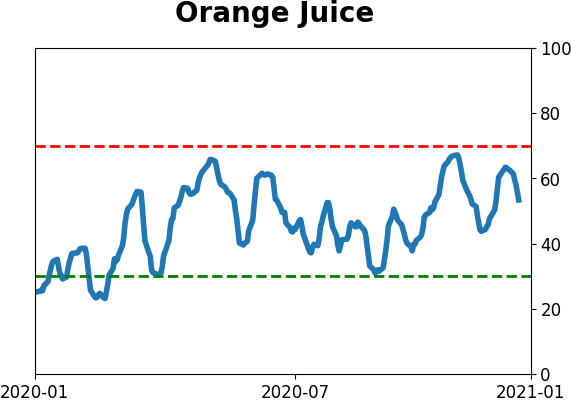
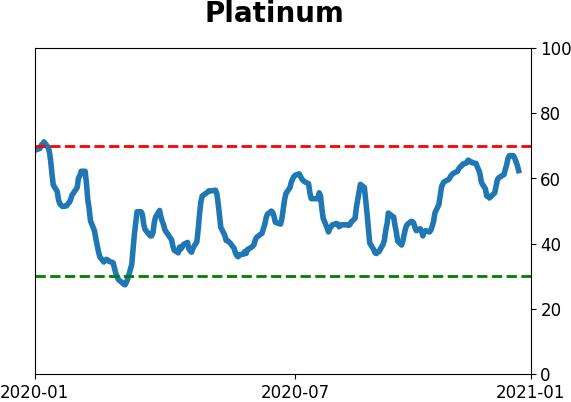
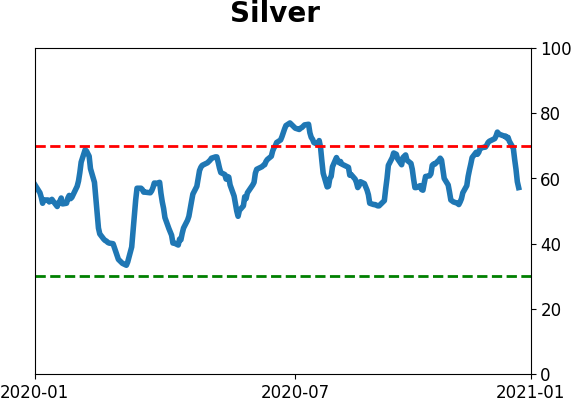
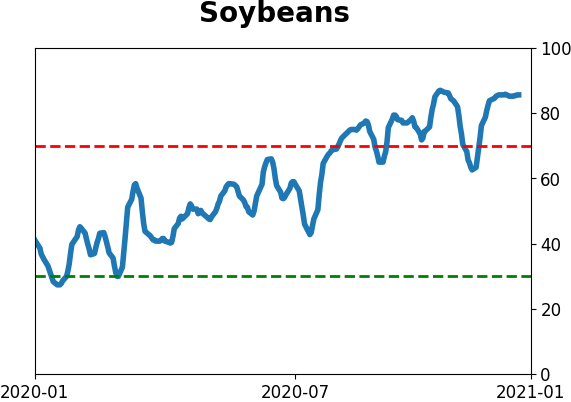
Commodity ETF's - 5-Day Moving Average
|
|