Headlines
|
|
Weekly wrap for week ending Jan 15:
A review of recent research shows the spike in speculative activities, but within the context of an overall healthy market environment, with few signs of internal deterioration.
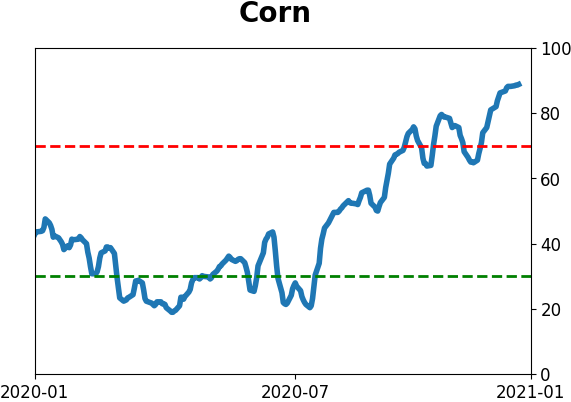
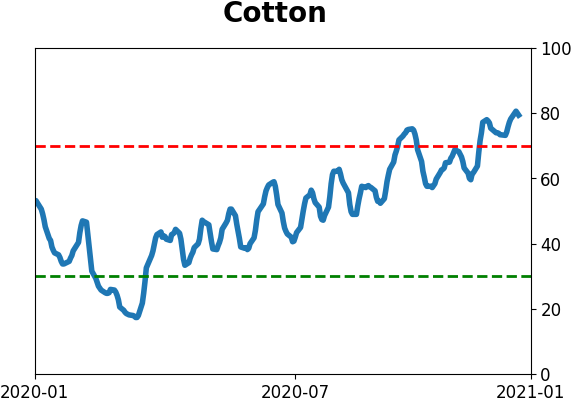
The latest Commitments of Traders report was released, covering positions through Tuesday: The 3-Year Min/Max Screen shows that "smart money" commercial hedgers only established one multi-year extreme, and that continues to be in corn where they're holding a near-record level of hedges. Again, however, this market has not been responding like it has over the past 7 years, suggesting this is a new and healthier market environment. The Commodity page shows that hedgers continue to be heavily short pretty much anything starting with a "c" including copper, cotton, and crude. They started covering shorts in 10-year Treasuries but have a ways to go before suggesting any kind of extreme. They're holding a smallish short position in major equity index futures, not telling us much there.
Bottom Line:
The market environment is pristine, with only sporadic signs of internal deterioration, but with near-historic optimism, gains tend to be muted, with a high probability of being reversed at some point over the ensuing weeks. | Other Sectors and Assets |
| | Positives | Negatives | | 1. Energy (here, here, and here) | 1. Skewed tech (here and here) |
|
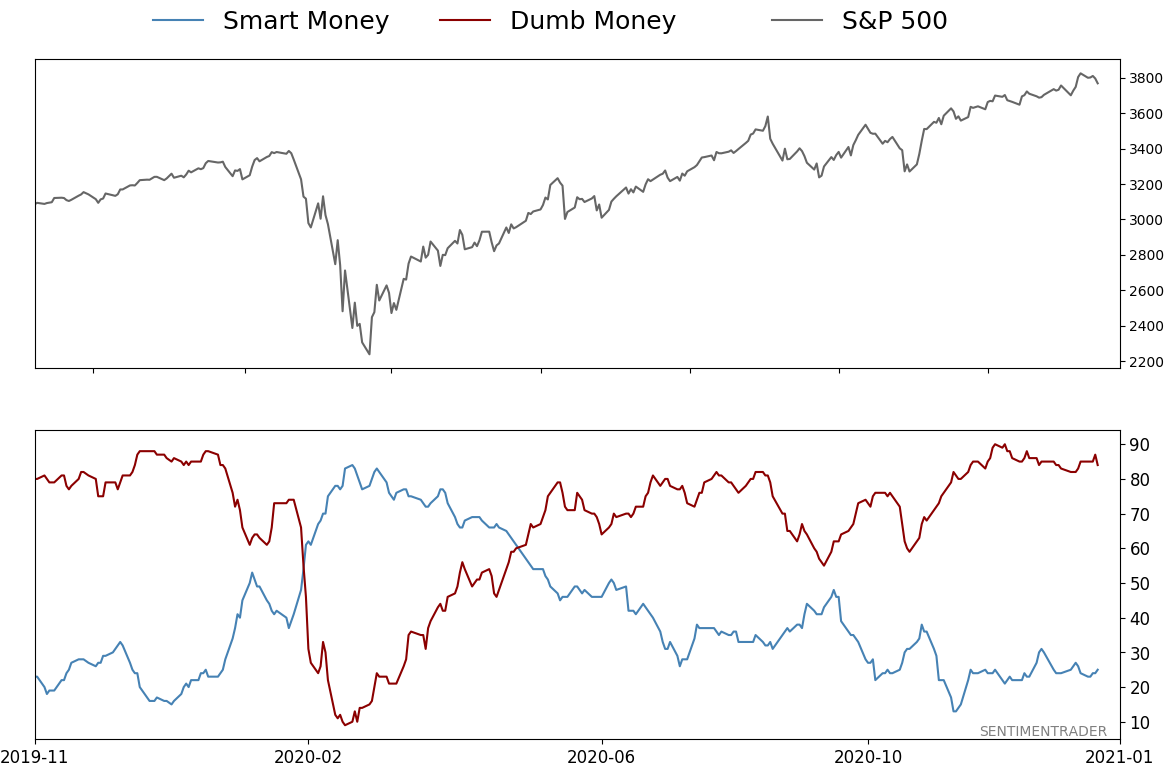
Smart / Dumb Money Confidence
|
Smart Money Confidence: 25%
Dumb Money Confidence: 84%
|
|
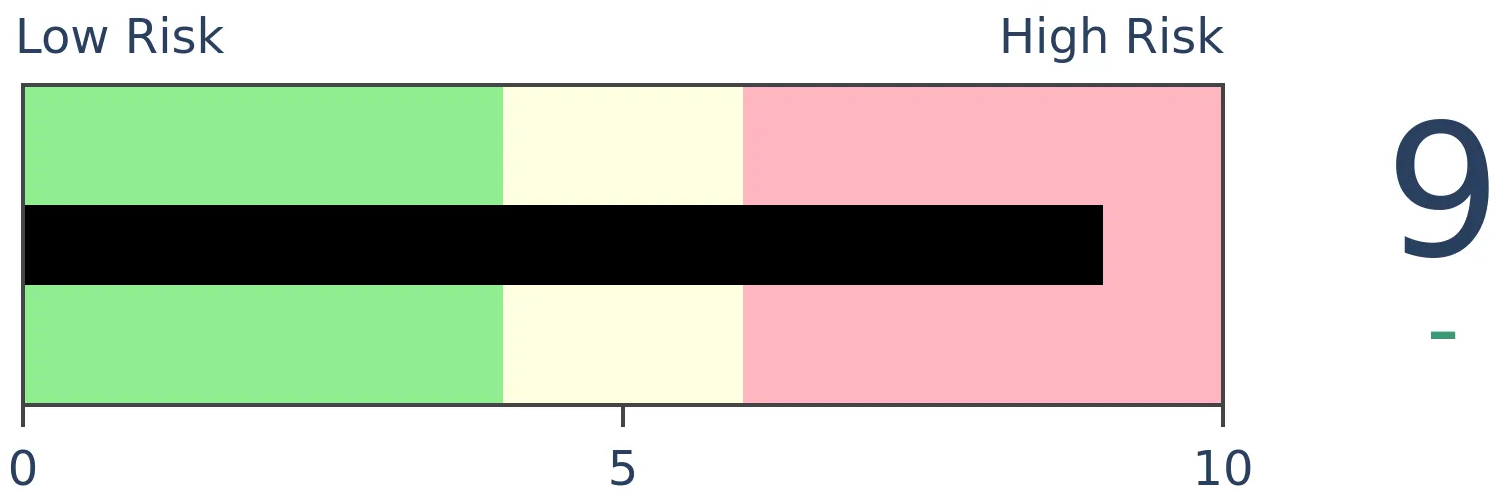
Risk Levels
Stocks Short-Term
|
Stocks Medium-Term

|
|
Bonds
|
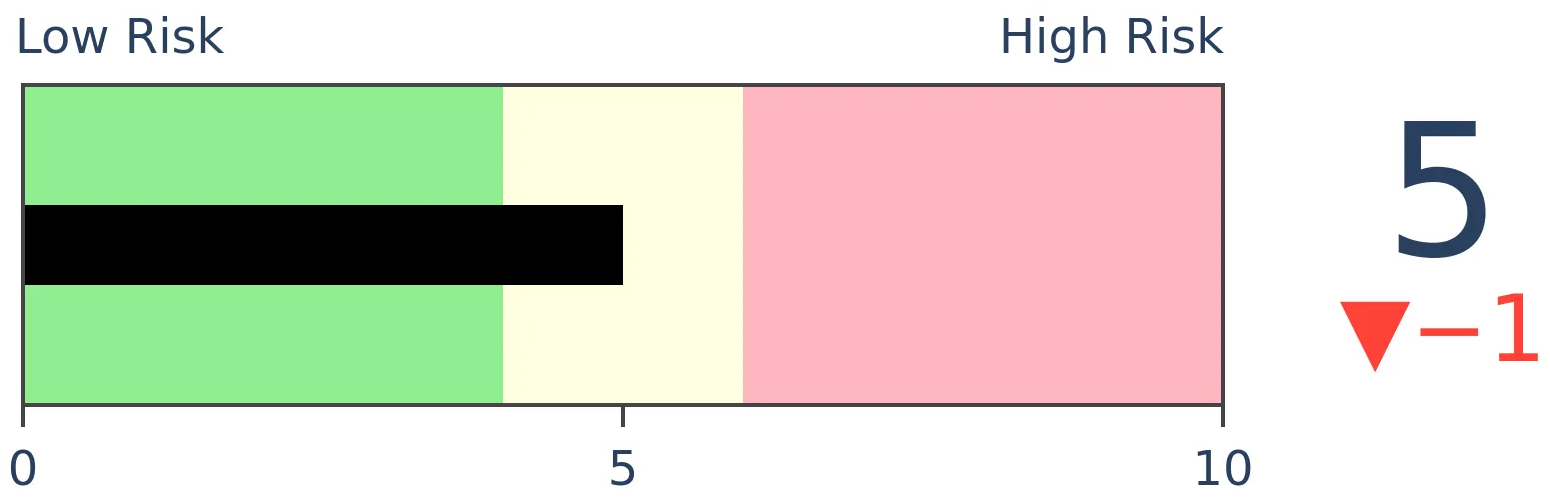
Crude Oil
|
|
Gold

|
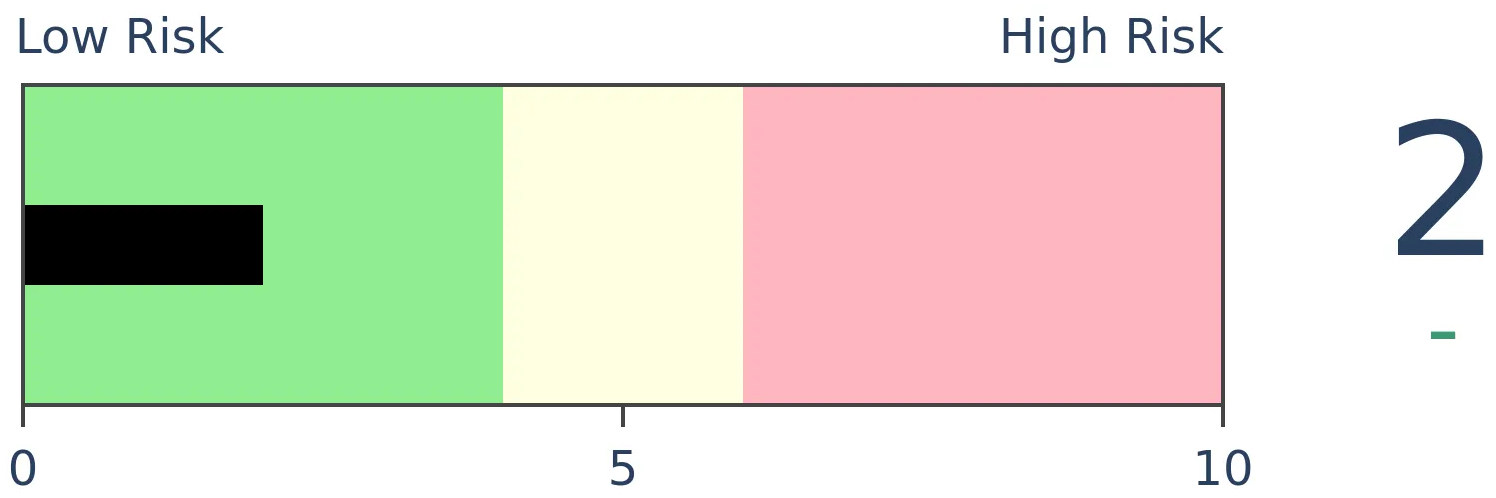
Agriculture

|
|
Research
BOTTOM LINE
A review of recent research shows the spike in speculative activities, but within the context of an overall healthy market environment, with few signs of internal deterioration.
FORECAST / TIMEFRAME
None
|
The goal of the Weekly Wrap is to summarize our recent research. Some of it includes premium content, and those members will be able to see the full posts that are linked, but we're highlighting the key focus of the research for all. Sometimes there is a lot to digest, with this summary meant to highlight the highest conviction ideas we discussed. Tags will show any related symbols and time frames related to the research.
We entered the week with a thrust that pushed 52-week highs on the NYSE and Nasdaq to a multi-year high. Returns from 2-12 months later were positive every time, with the caveat of a small sample size.
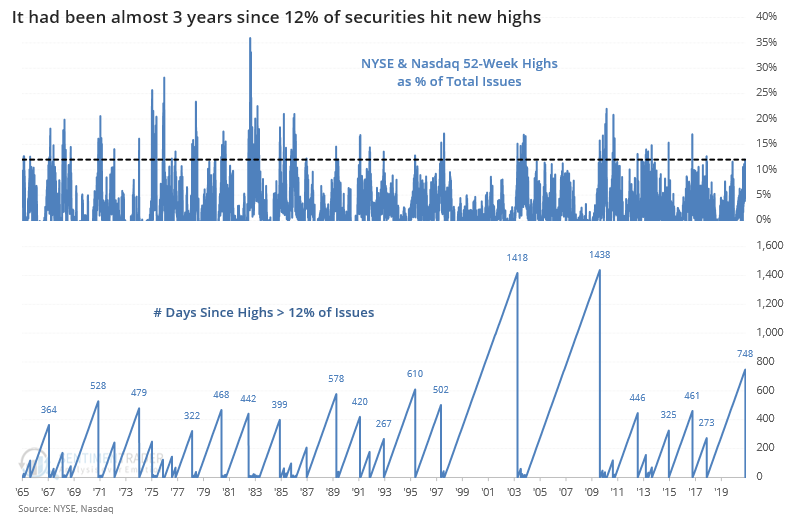
The trend continued this week, with a huge number of new highs on the Nasdaq on Thursday. While some of those were oddities like SPACs, we've learned the dangers of making excuses for indicators over the years.
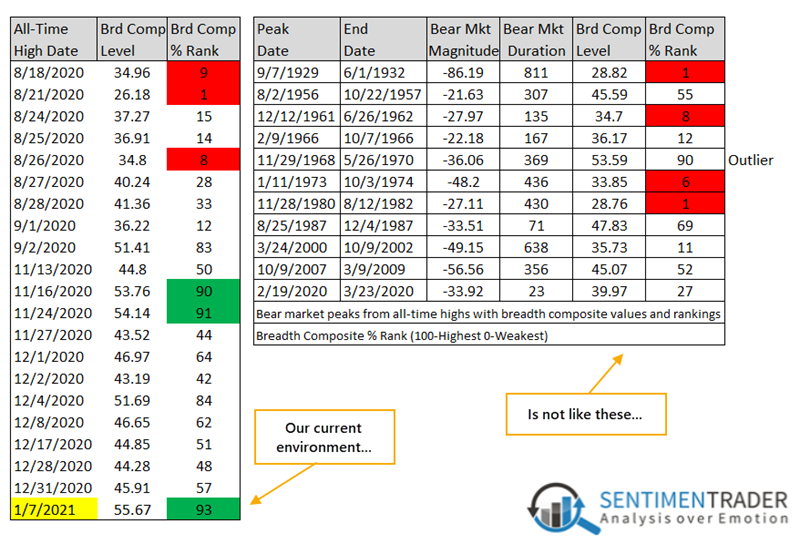
Dean pointed out that the makeup of the latest thrust to new highs in the indexes is very different from most of the major peaks of the past 50 years. Typically, we see some deterioration before the indexes themselves peter out.
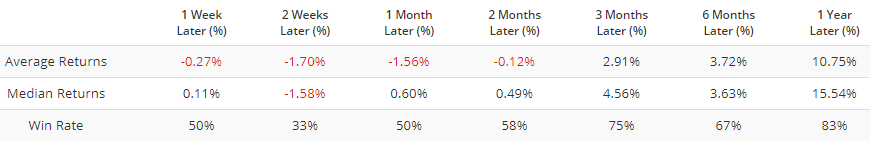
New highs in emerging markets recently surged above 15%, the highest level since 2010. Breakouts, accompanied by strong internal participation, are a welcome development. While the MSCI Emerging Markets index struggled in the short-term after similar surges, the long-term returns were very good.
MSCI Emerging Markets Index when > 15% of members at 52-week high
So what's the problem?
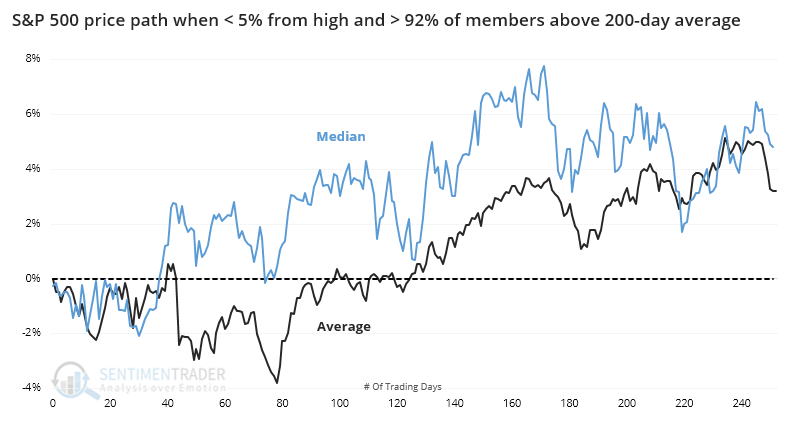
The biggest wrinkles are that some of these measures have become so strong that they've proven to be too strong. Other times since 1927 when there were an overwhelming number of uptrends among stocks in the S&P 500, the index struggled over the next few months.
Then we have the elephant in the room, the tremendous and in some cases record-breaking amount of speculation. Traders have shown an affinity for leveraged instruments and the riskiest corners of the market, like options and penny stocks.
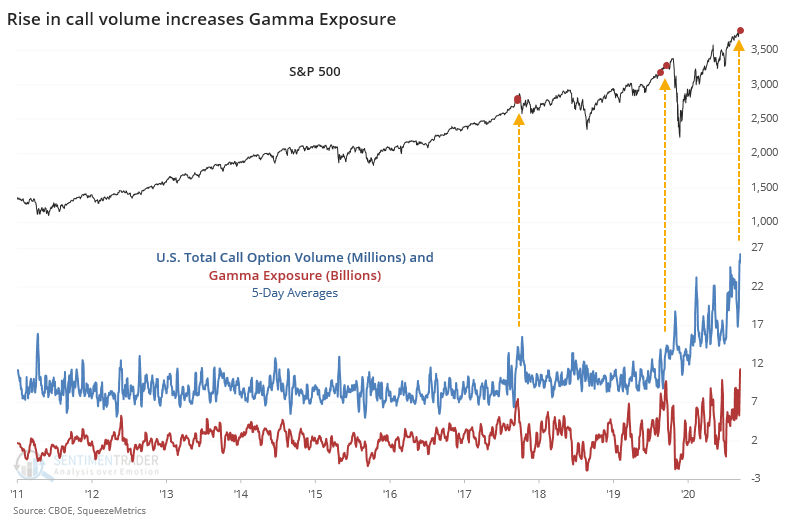
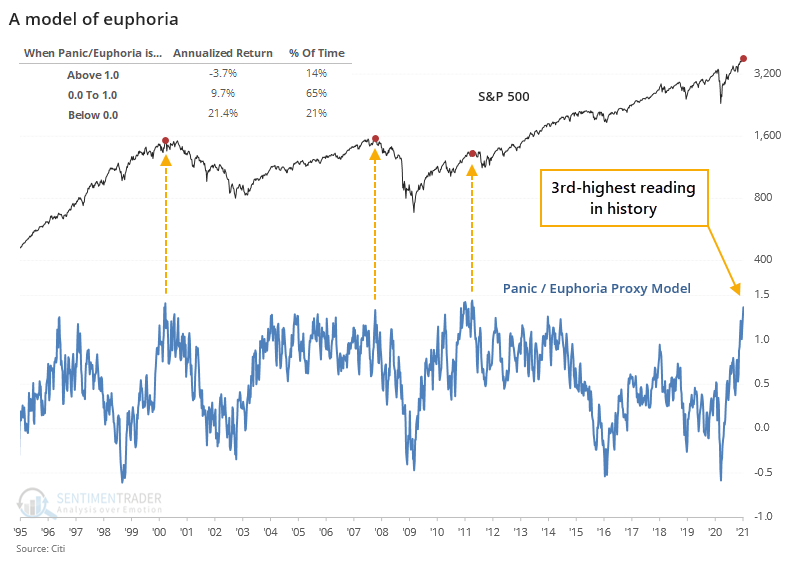
This kind of behavior is showing up in most aggregate models of sentiment, pushing from optimism into euphoria.
Jay showed one way to potentially account for the view that some air may be let out of bubbly conditions. Implied volatility on stocks like Neftlix aren't exorbitant, making a long-term put spread like buying the Jan2022 NFLX 300 put and selling the July2021 NFLX 270 put a potential play.
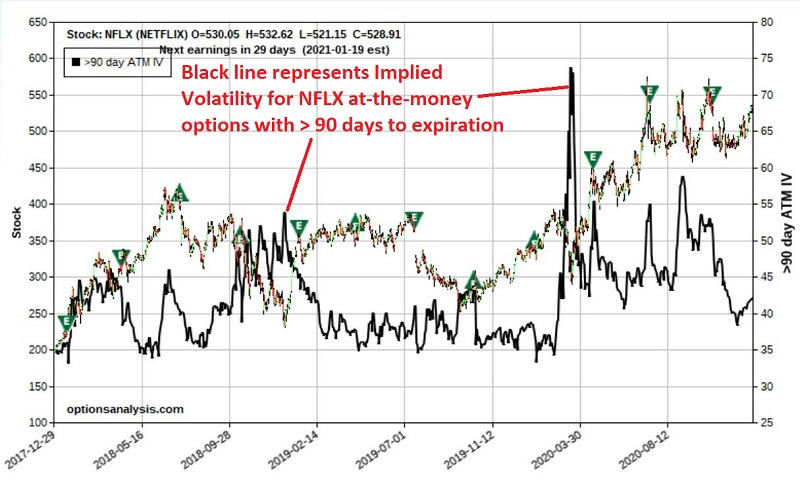
If NFLX goes up in price (or even stays unchanged) this trade will lose money. If NFLX were to begin declining in price soon after the trade is entered this position is capable of generating a significantly high percentage rate-of-return based on as little as a 15-20% price decline. The reason this trade is being considered in the first place is as a bet on the potential for a major selloff by the underlying stock. As NFLX price declines further, the level of profit increases until NFLX reaches the strike price of the option we sold (the July 270 put), at which point the risk curves "roll over."
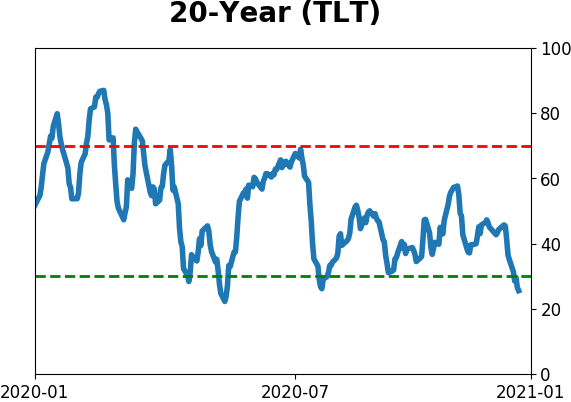
BONDS
|
 |  |
|
The move in the dollar over the past week or so coincided with a 6-day push higher in 10-year yields, one of the longest streaks since 1962. Again, this kind of thing generates excitement for those looking for a turn, but a month after similar streaks, yields were higher only 36% of the time.
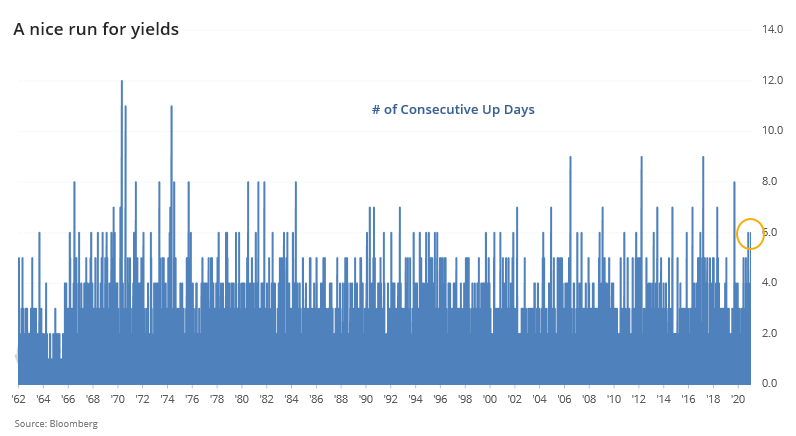
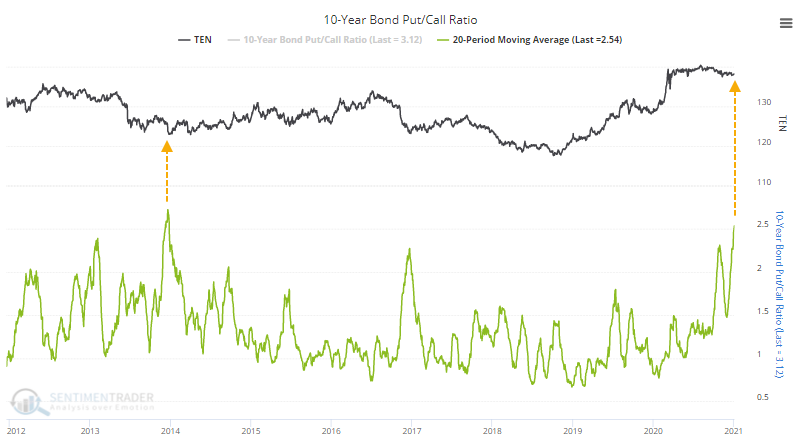
This comes on the cusp of near-record options bets being placed against 10-year Treasuries.
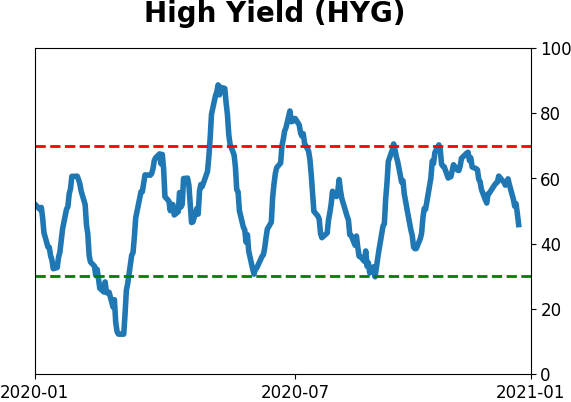
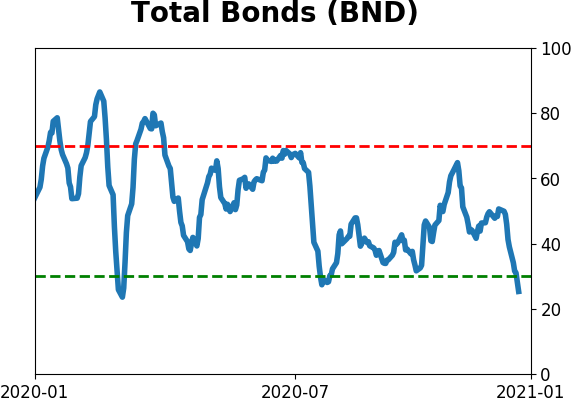
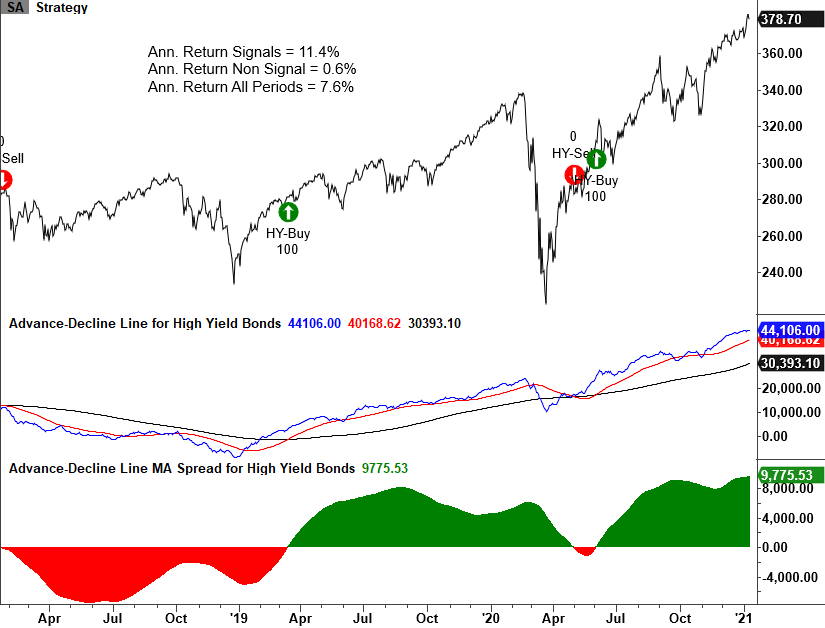
So far, there is no deterioration yet evident in high-yield bonds. All the internal metrics there remain favorable, such as a defined uptrend in the cumulative advance/decline line and bonds at 52-week highs far outnumbering those at 52-week lows.
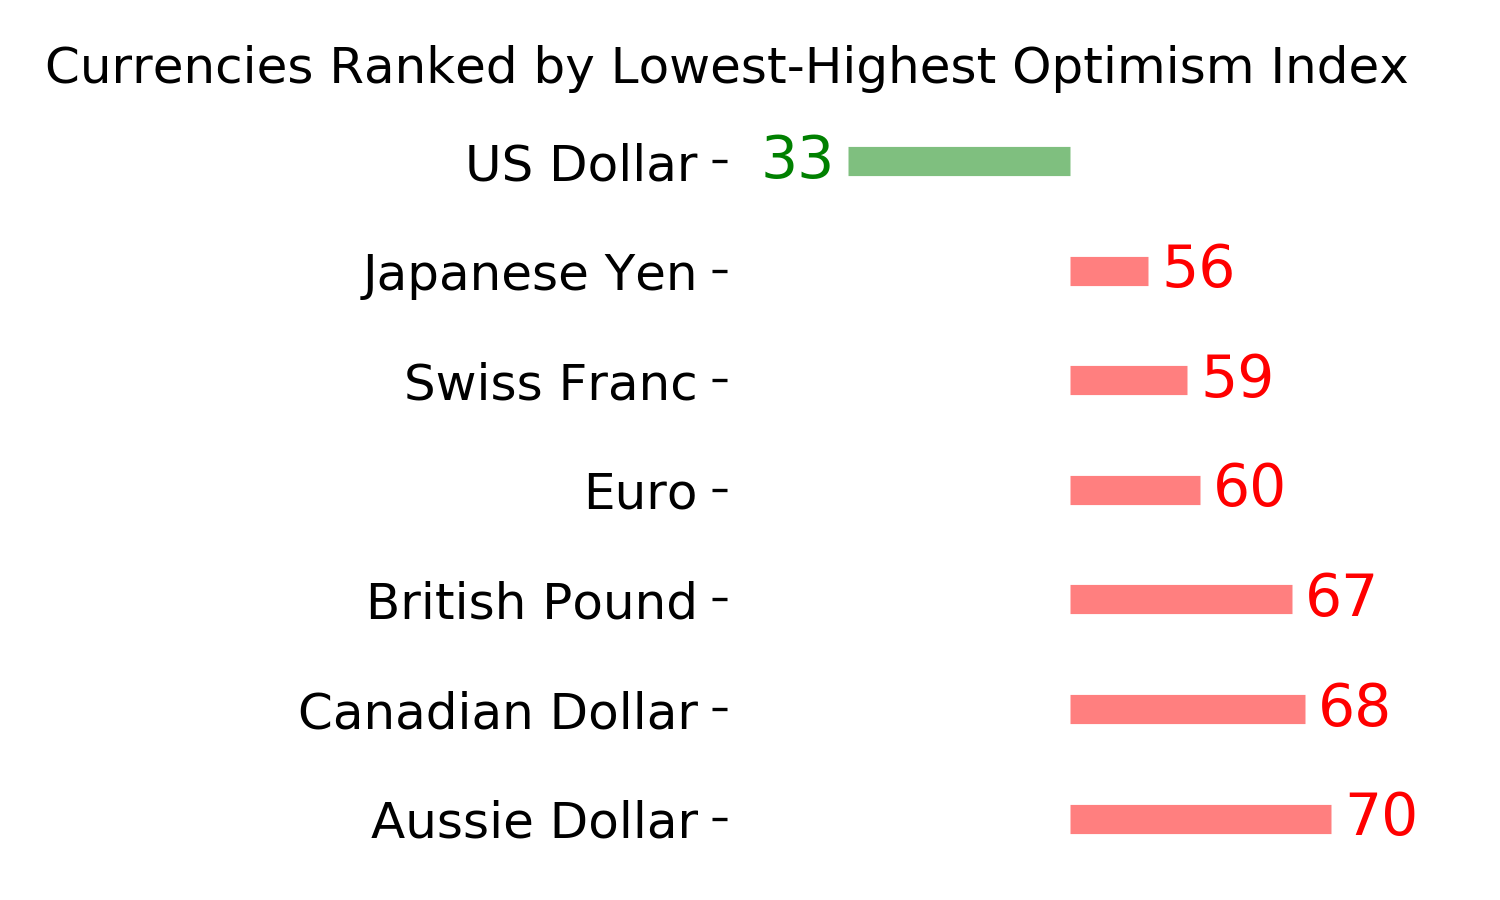
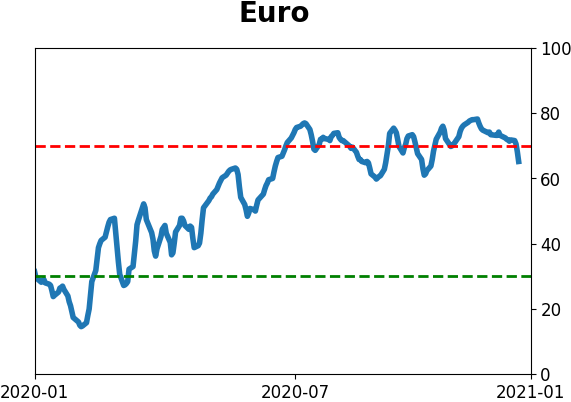
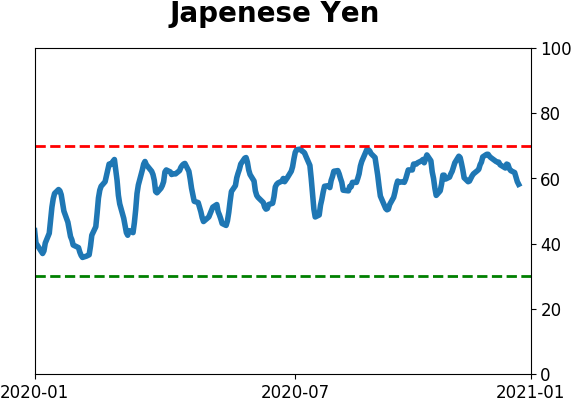
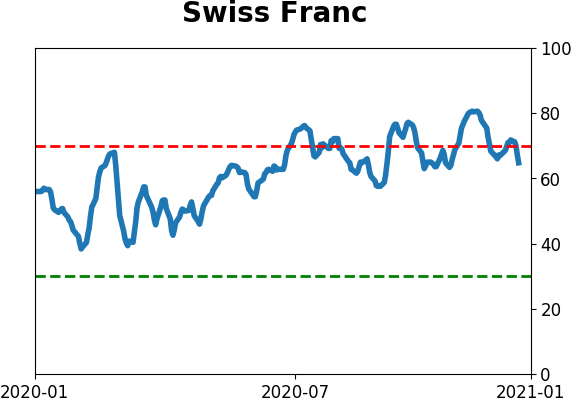
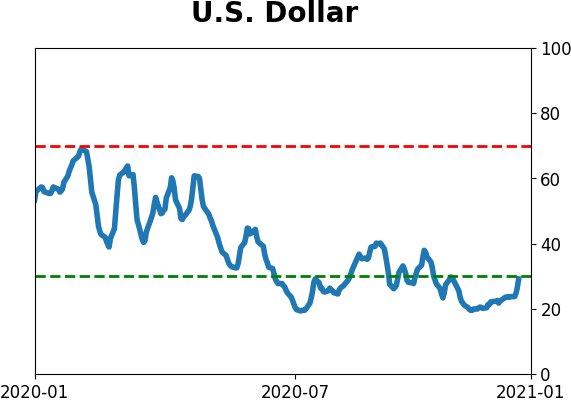
CURRENCIES
|
 |
|
|
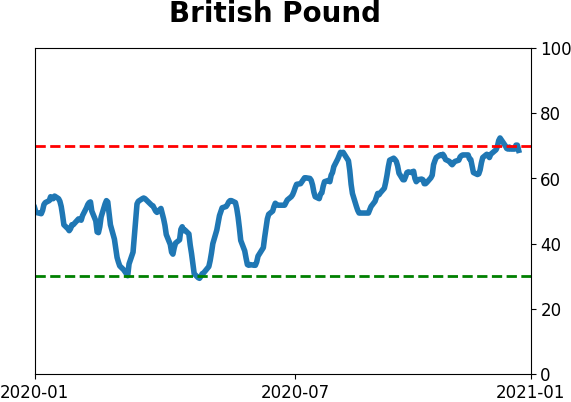
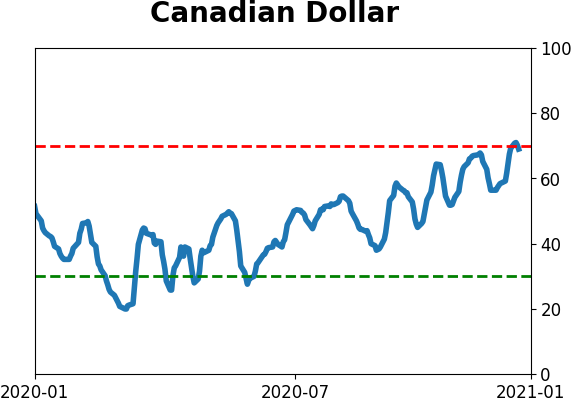
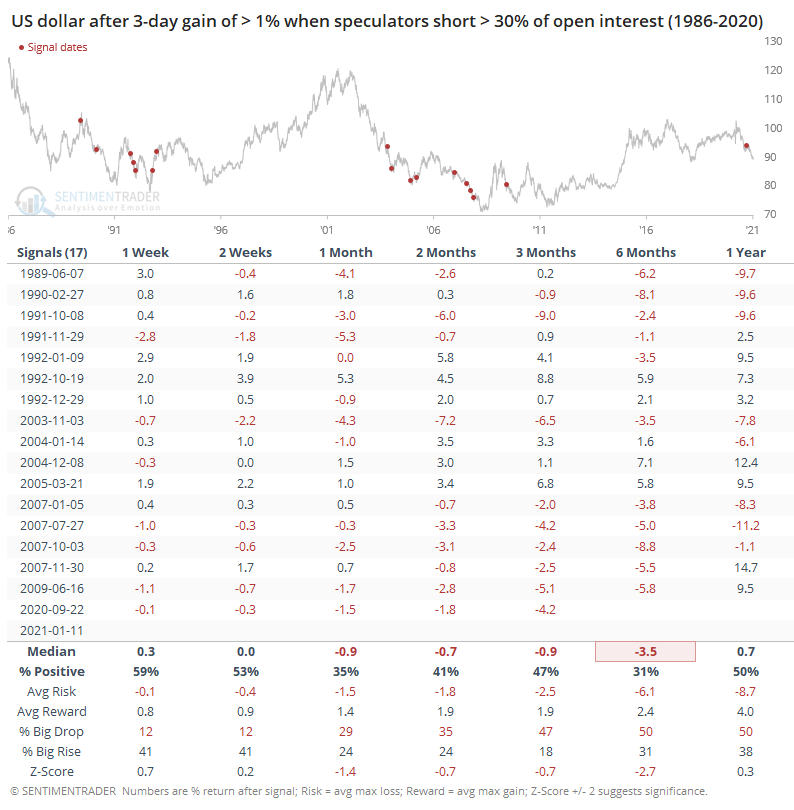
One reason traders have been thinking stocks might decline is that the U.S. dollar is showing signs of turning. It crossed above its 20-day average for the first time in months.
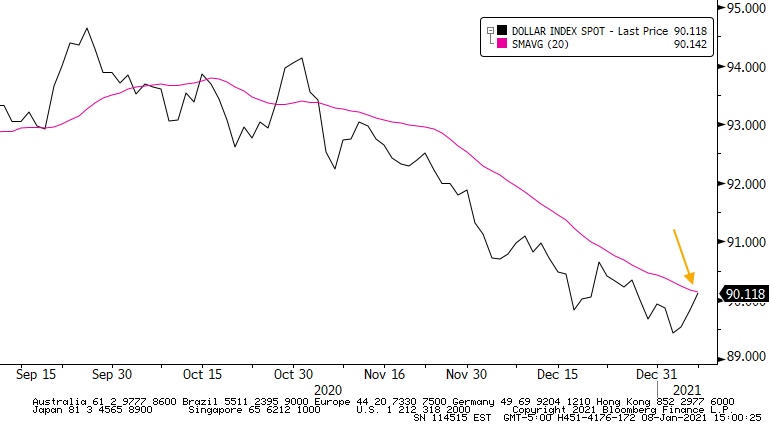
It's also showing initial signs of a short-covering rally. But those arguments have shown very weak evidence of actually being effective over the next 1-3 months. We'll just have to wait and see if if the buck shows any sign of changing this pattern.
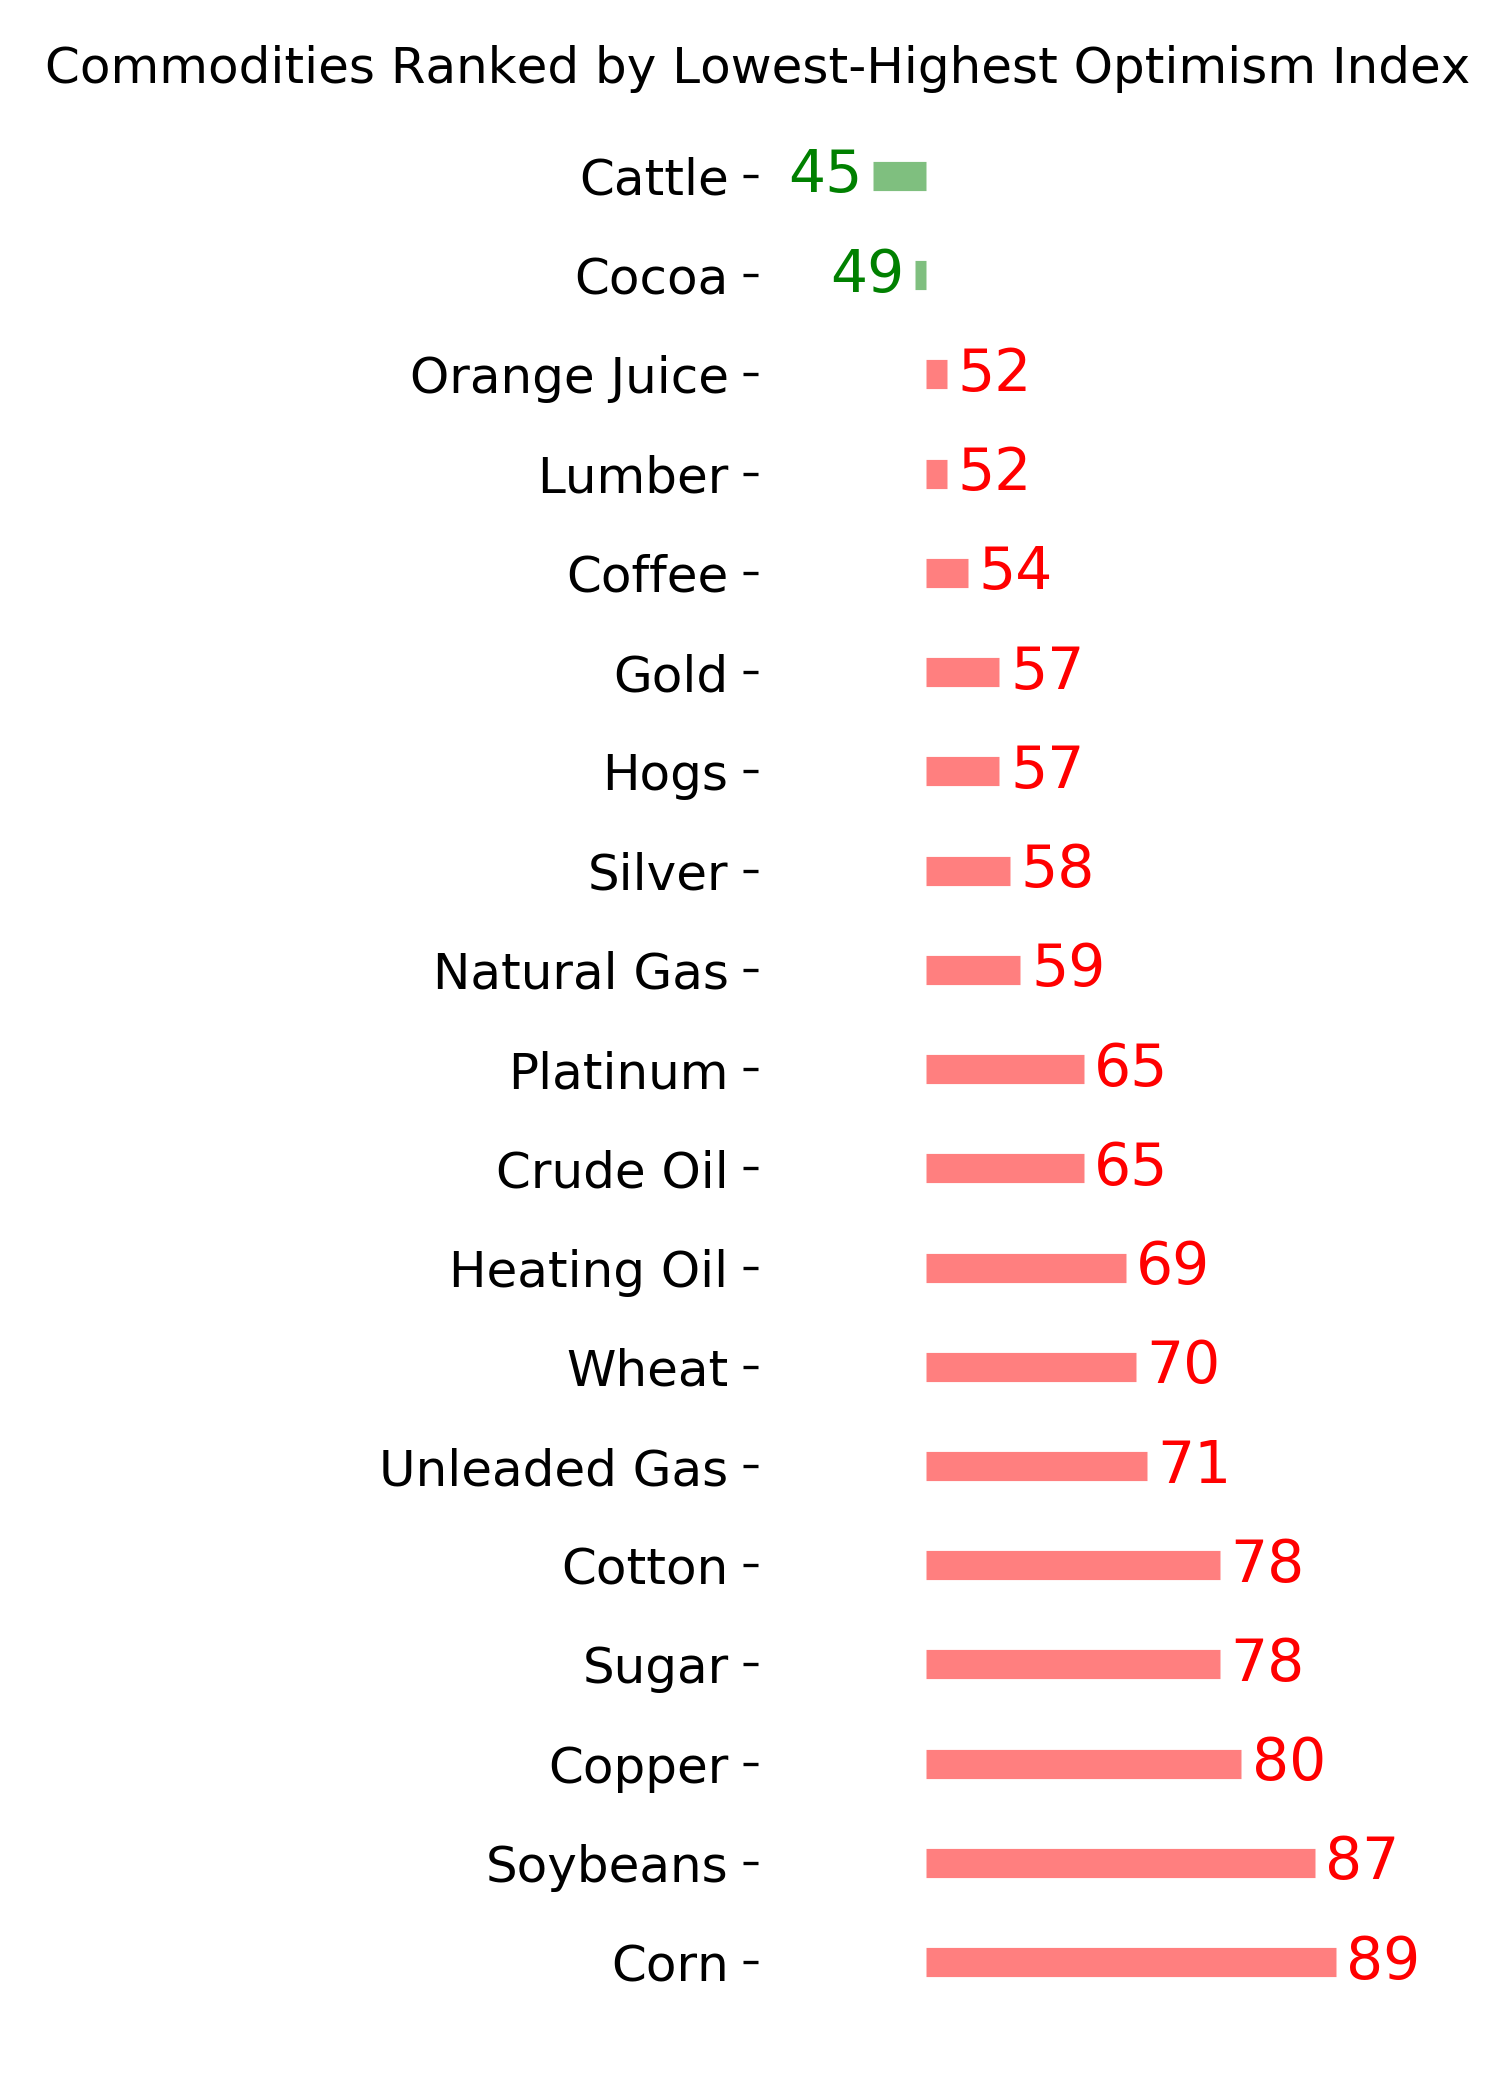
COMMODITIES
|
 |  |
|
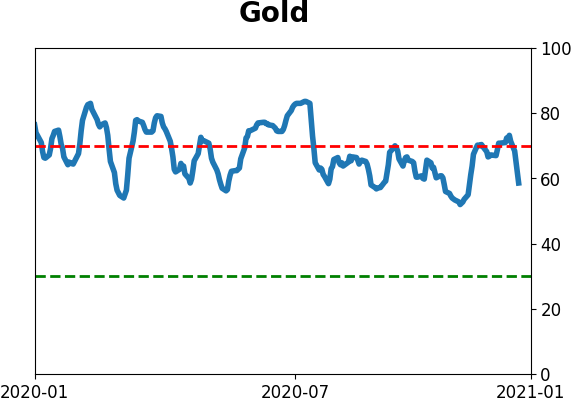
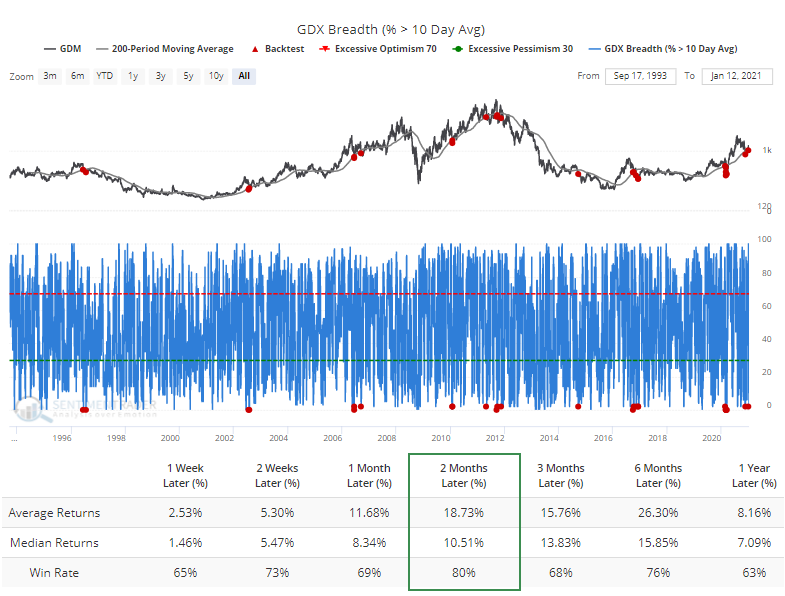
The rise in the buck and yields has been a challenge for gold. Only 2% of gold mining stocks remained above their 10-day moving averages, in the context of the GDX being below a rising 200-day average, showing a pullback within a longer-term uptrend. Similar behavior preceded an average double-digit gain over the next couple of months since 1993.
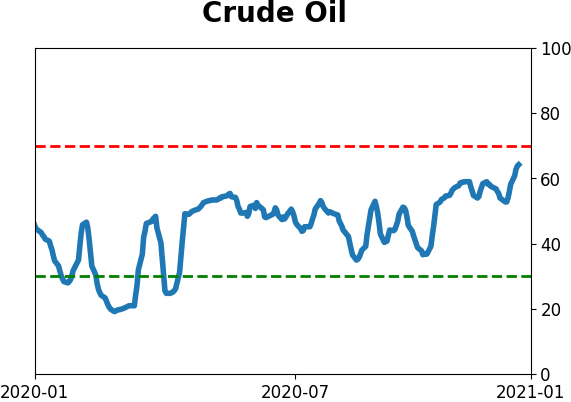
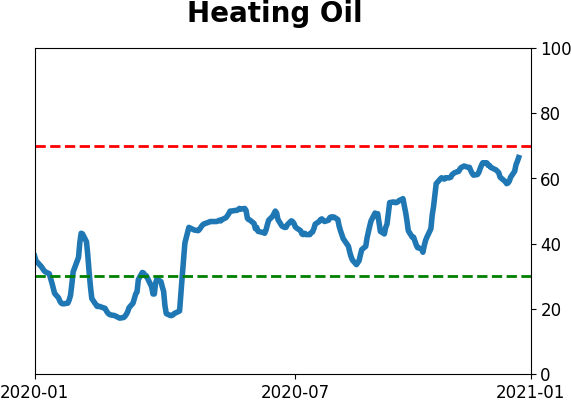
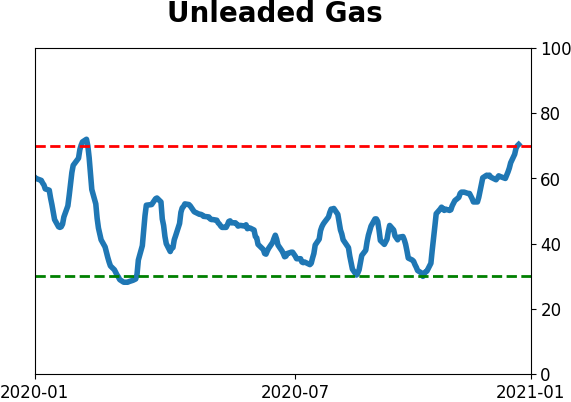
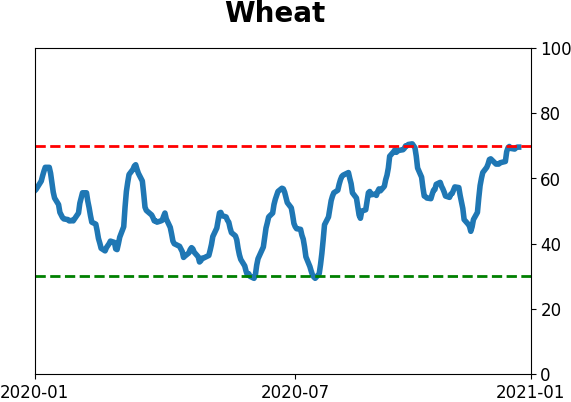
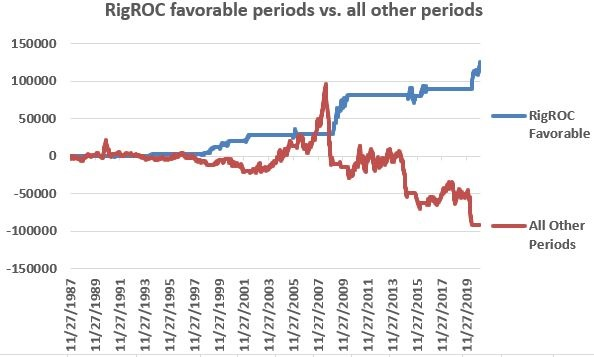
The push higher in commodities has been especially good for ag and contracts like crude oil. There is some supporting fundamentals there, as rig counts have risen by over 50% during a 19-week span. Jay showed that crude oil has outperformed significantly when they've done that in the past.
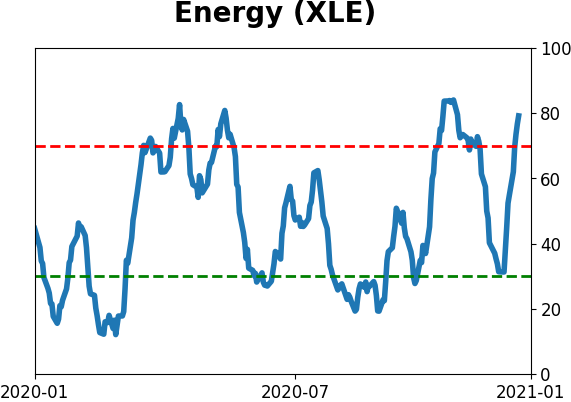
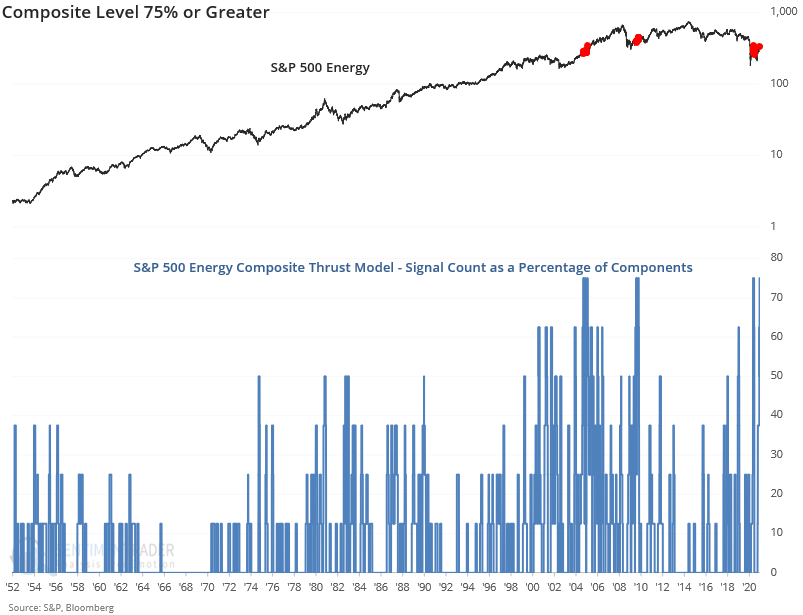
Dean noted that the momentum in energy stocks hit an extreme level on 1/14/21 as 100% of the sector members outperformed the S&P 500 Index on a rolling 21-day basis. As a result of the surge in energy stocks, the signal count for an 8-component composite thrust model reached a reading of 75%.
Composite readings of 75% are rare. Aside from the new signal on 1/14/21, it's only happened four other times since 1952 - June 2020, August 2009, February 2005, and October 2004.
Active Studies
| Time Frame | Bullish | Bearish | | Short-Term | 0 | 0 | | Medium-Term | 2 | 1 | | Long-Term | 14 | 2 |
|
Indicators at Extremes
Portfolio
| Position | Description | Weight % | Added / Reduced | Date | | Stocks | 10.6% VWO, 10.1% XLE, 8.5% RSP, 8.3% PSCE | 37.5 | Added 3% | 2021-01-05 | | Bonds | 10% BND, 10% SCHP, 10% ANGL | 27.8 | Reduced 0.1% | 2020-10-02 | | Commodities | GCC | 2.3 | Reduced 2.1%
| 2020-09-04 | | Precious Metals | GDX | 9.8 | Added 4.8% | 2020-12-01 | | Special Situations | | 0.0 | Reduced 5% | 2020-10-02 | | Cash | | 22.6 | | |
|
Updates (Changes made today are underlined)
There hasn't been much that changed in recent weeks, with sky-high sentiment on many measures receding a bit, but that's not necessarily a good sign, just ask February 2020. We still have the lingering positives from all the breadth thrust last year, as late as October and November. Those have a very good historical record at preceding higher prices over a longer time frame. Of more immediate concern is the explosion in speculation in the most leveraged parts of the market. So far, that hasn't translated to price troubles, though there have been more oddities n the latter half of December than we'd seen since August, like the major indexes rising but on very poor breadth. I continue to avoid tech- and cap-heavy indexes, and don't see that changing any time soon. Energy stocks are doing what they should, and I added a bit more there. I'm not a momentum trader and do not focus on pyramiding positions in this account - it's more about protecting capital - but I like the setup on a long-term time frame. RETURN YTD: 3.2% 2020: 8.1%, 2019: 12.6%, 2018: 0.6%, 2017: 3.8%, 2016: 17.1%, 2015: 9.2%, 2014: 14.5%, 2013: 2.2%, 2012: 10.8%, 2011: 16.5%, 2010: 15.3%, 2009: 23.9%, 2008: 16.2%, 2007: 7.8%
|
|
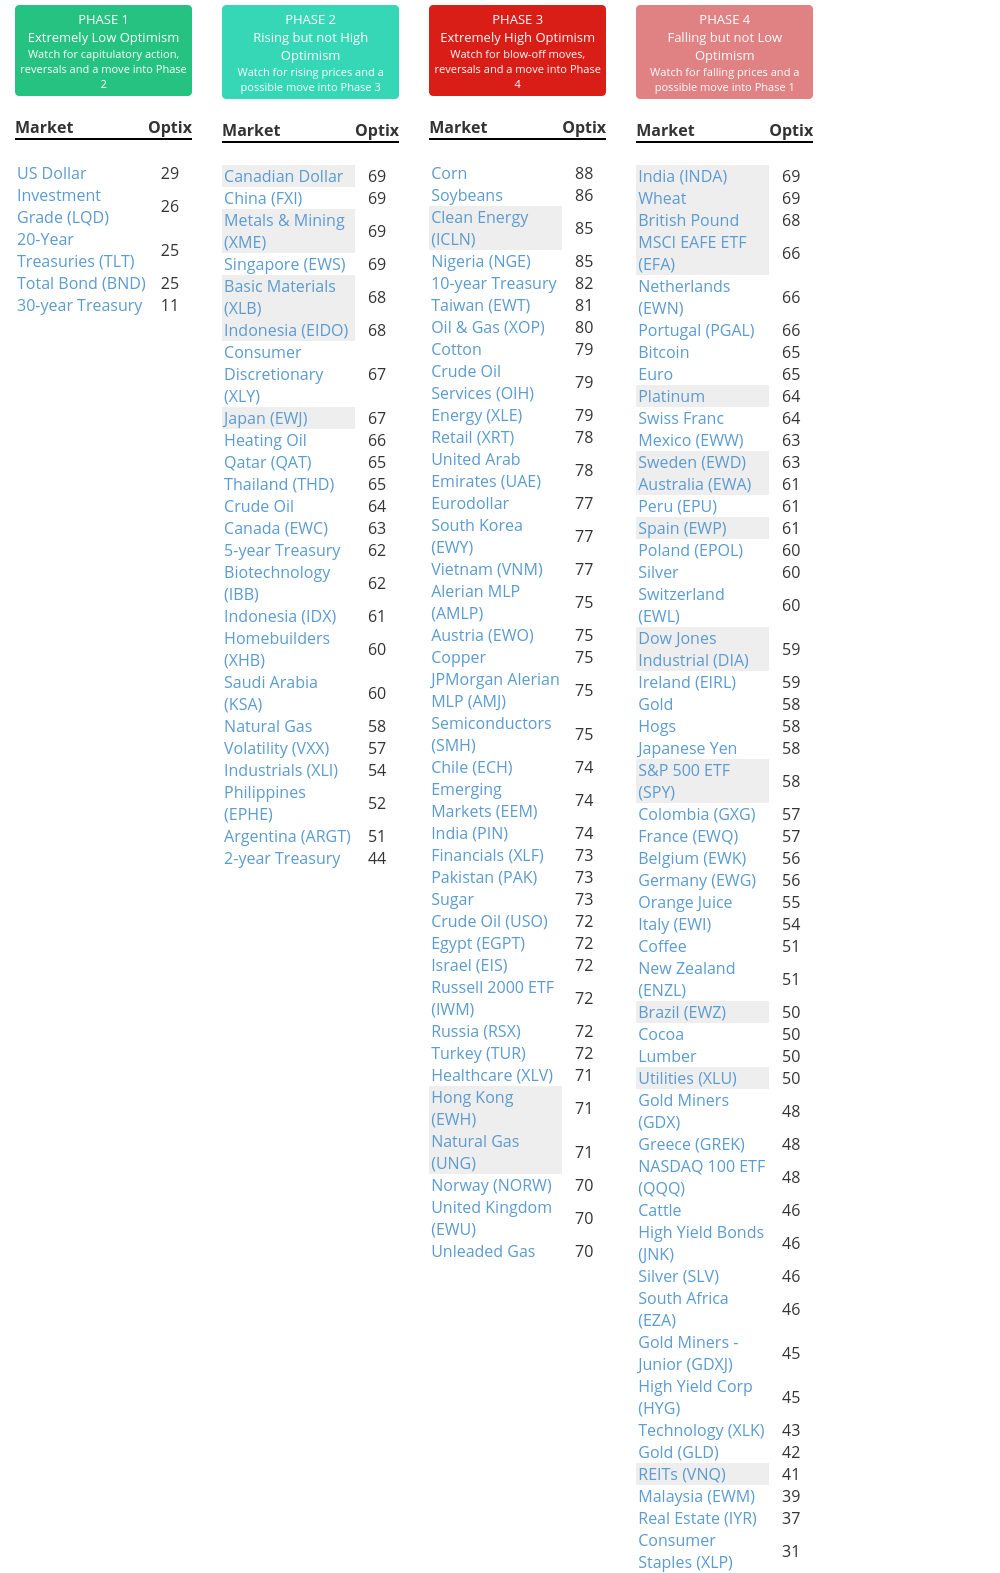
Phase Table
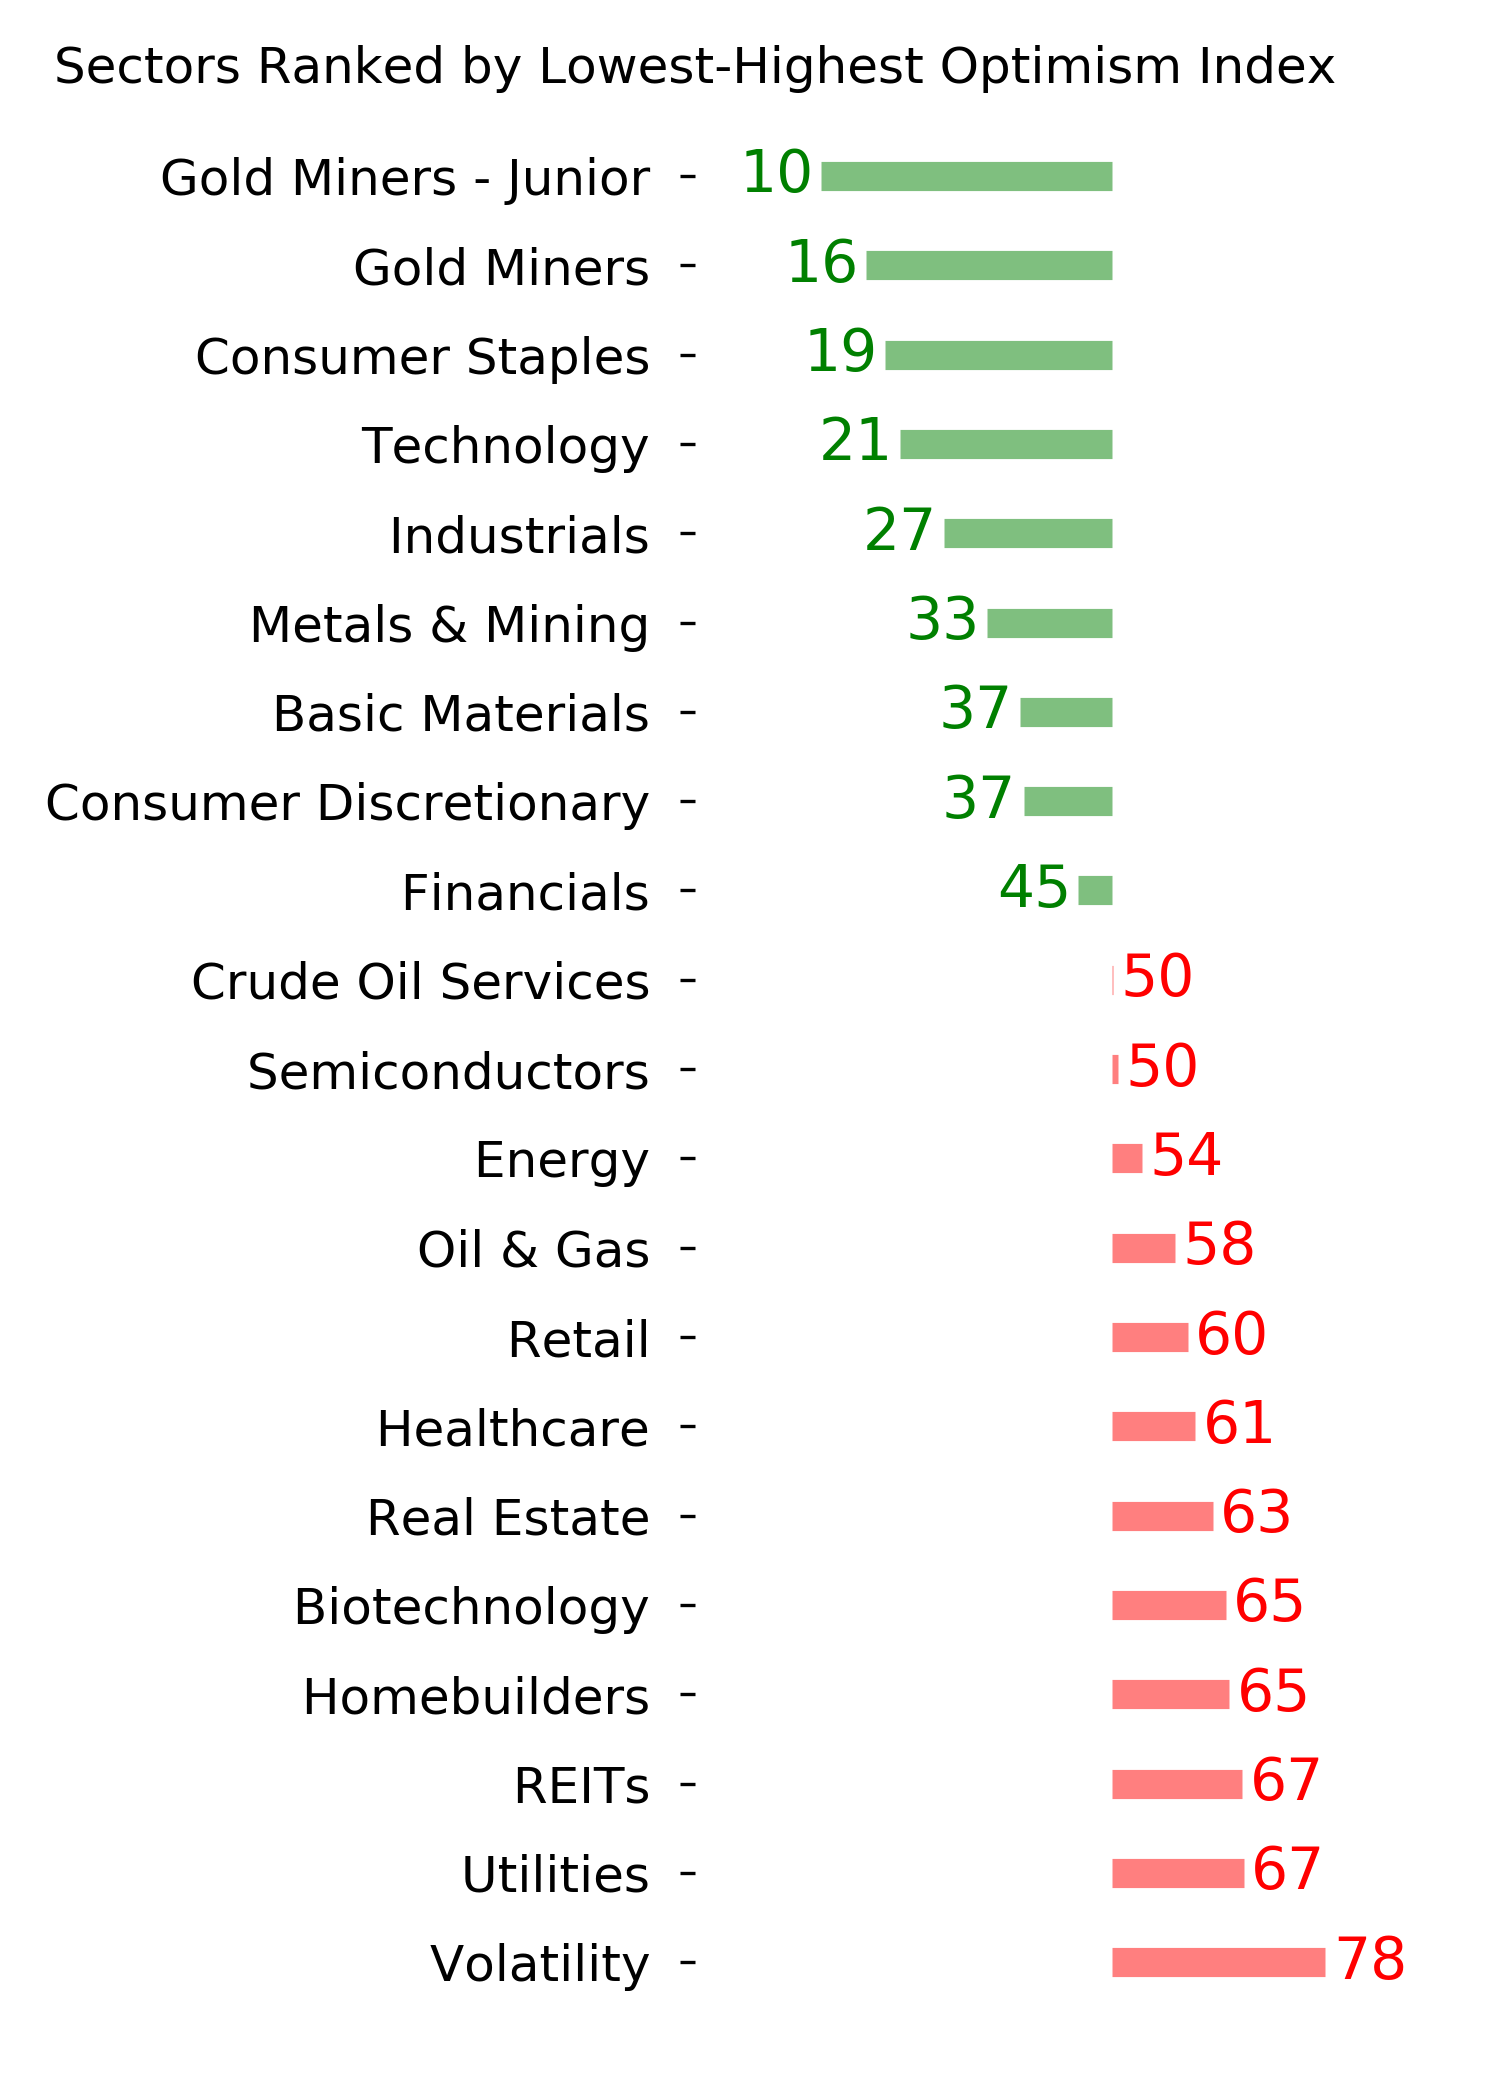
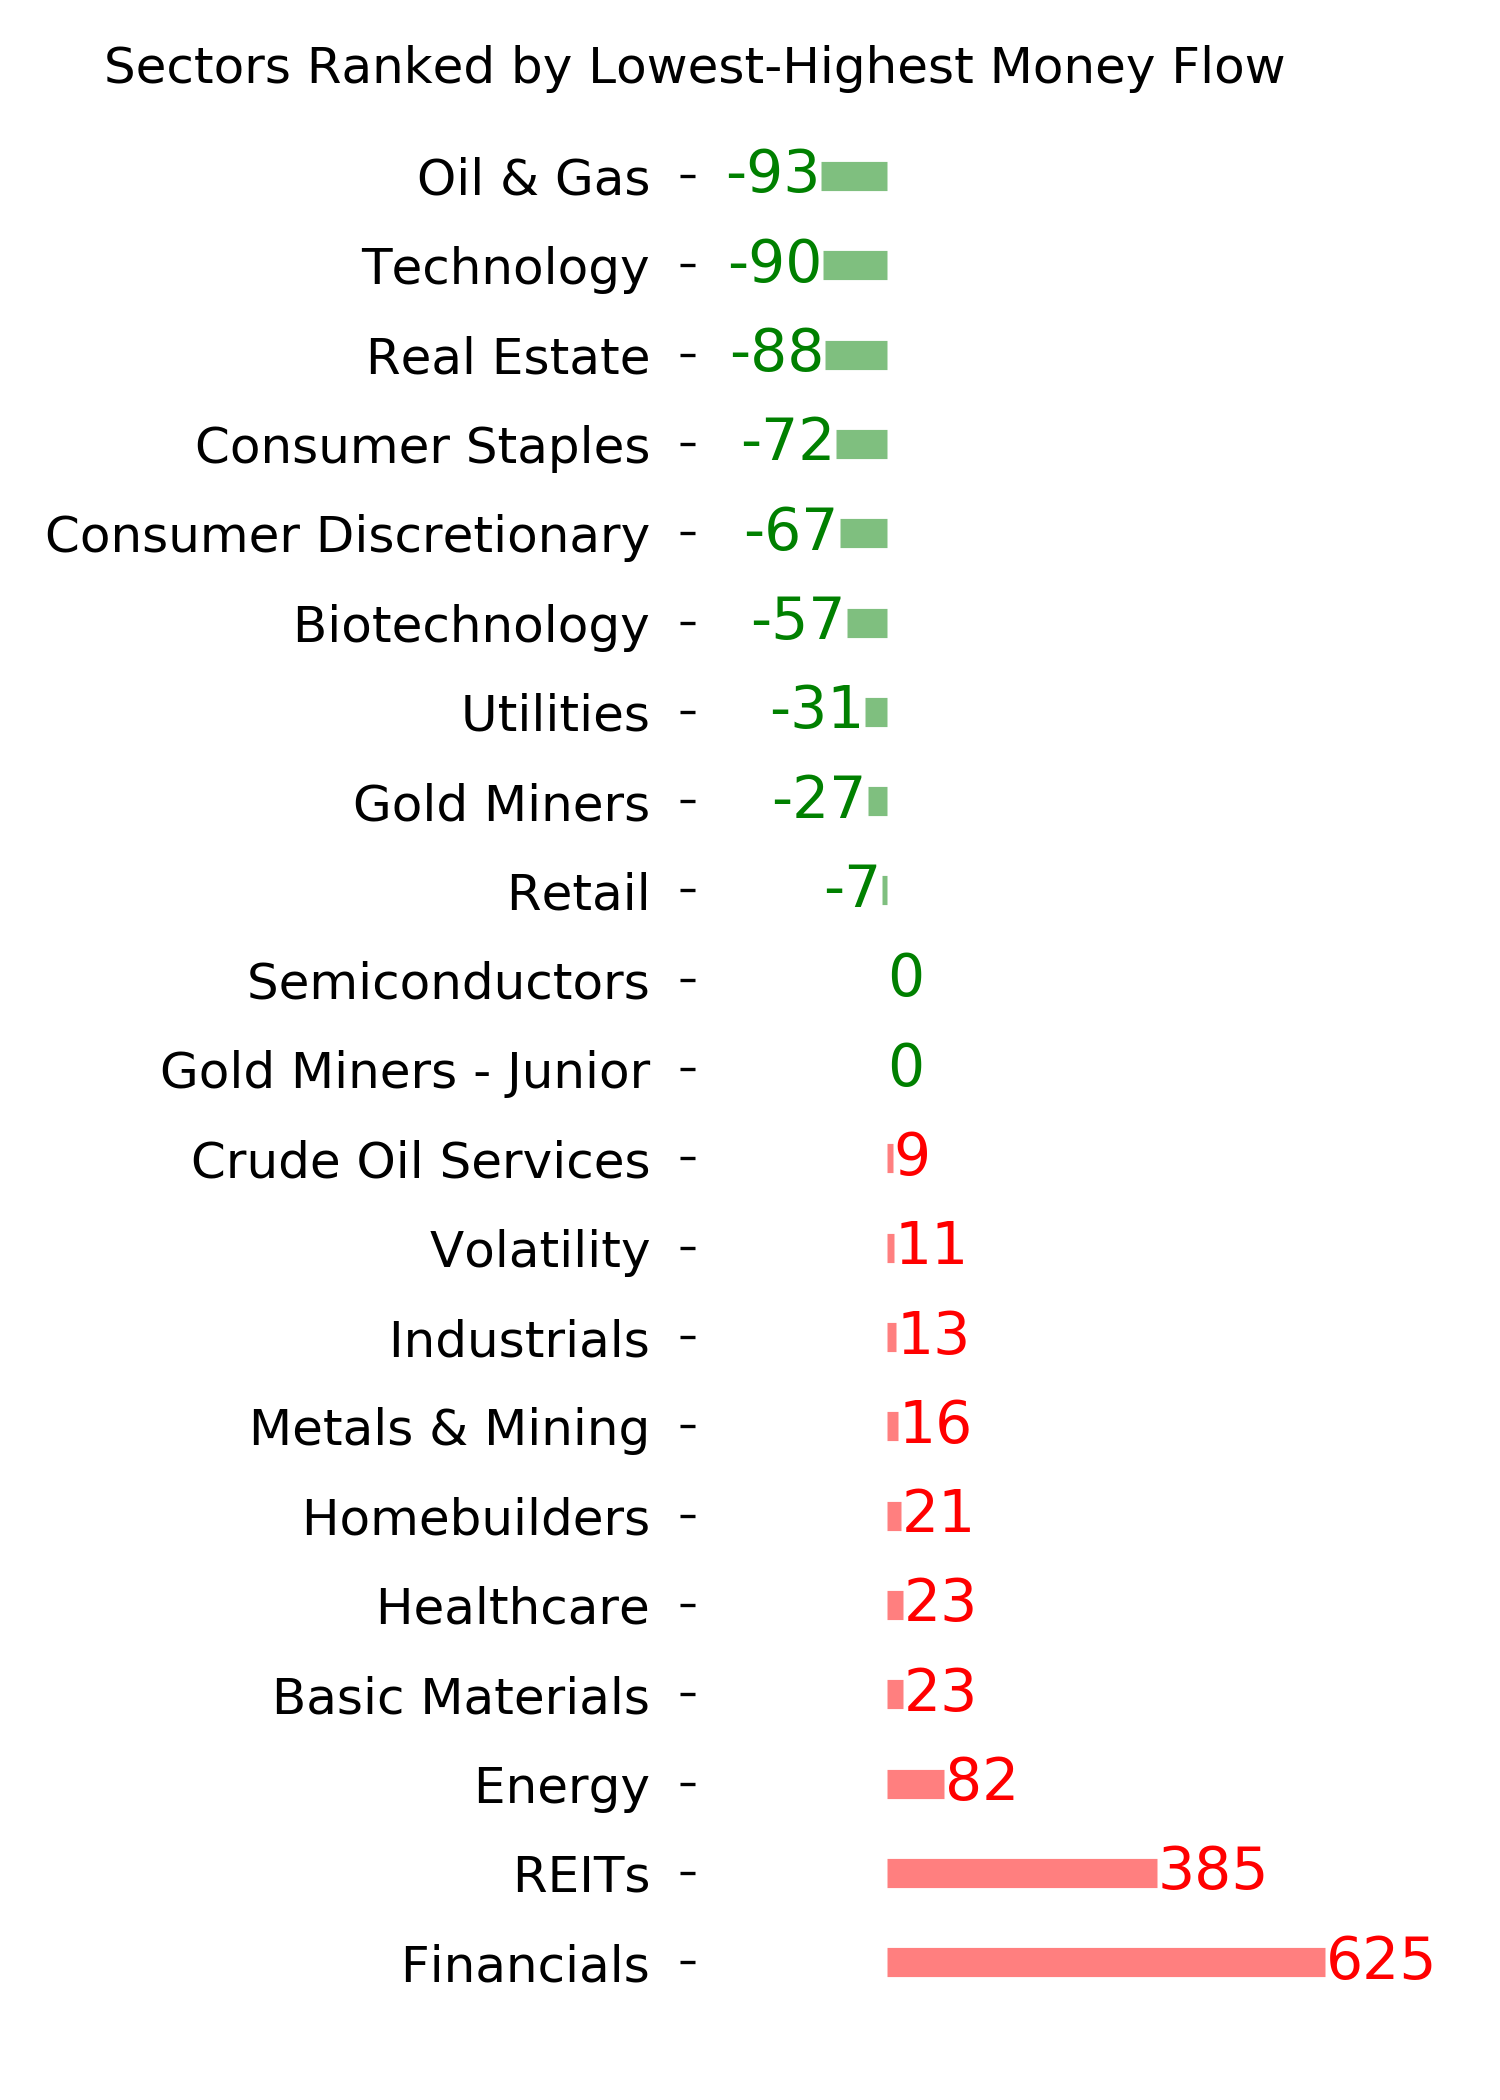
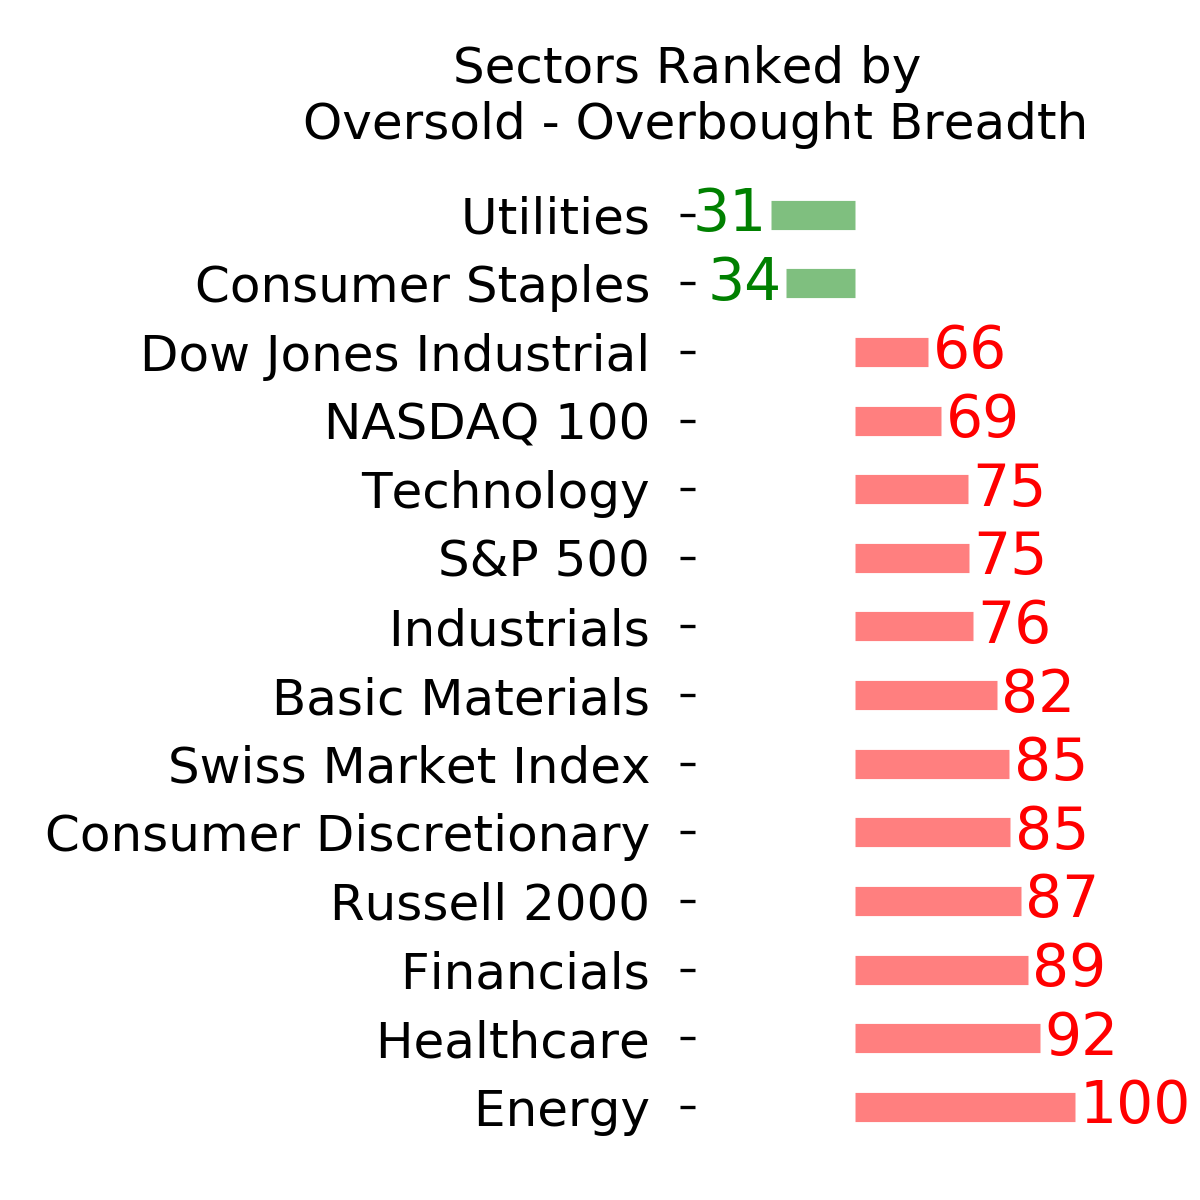
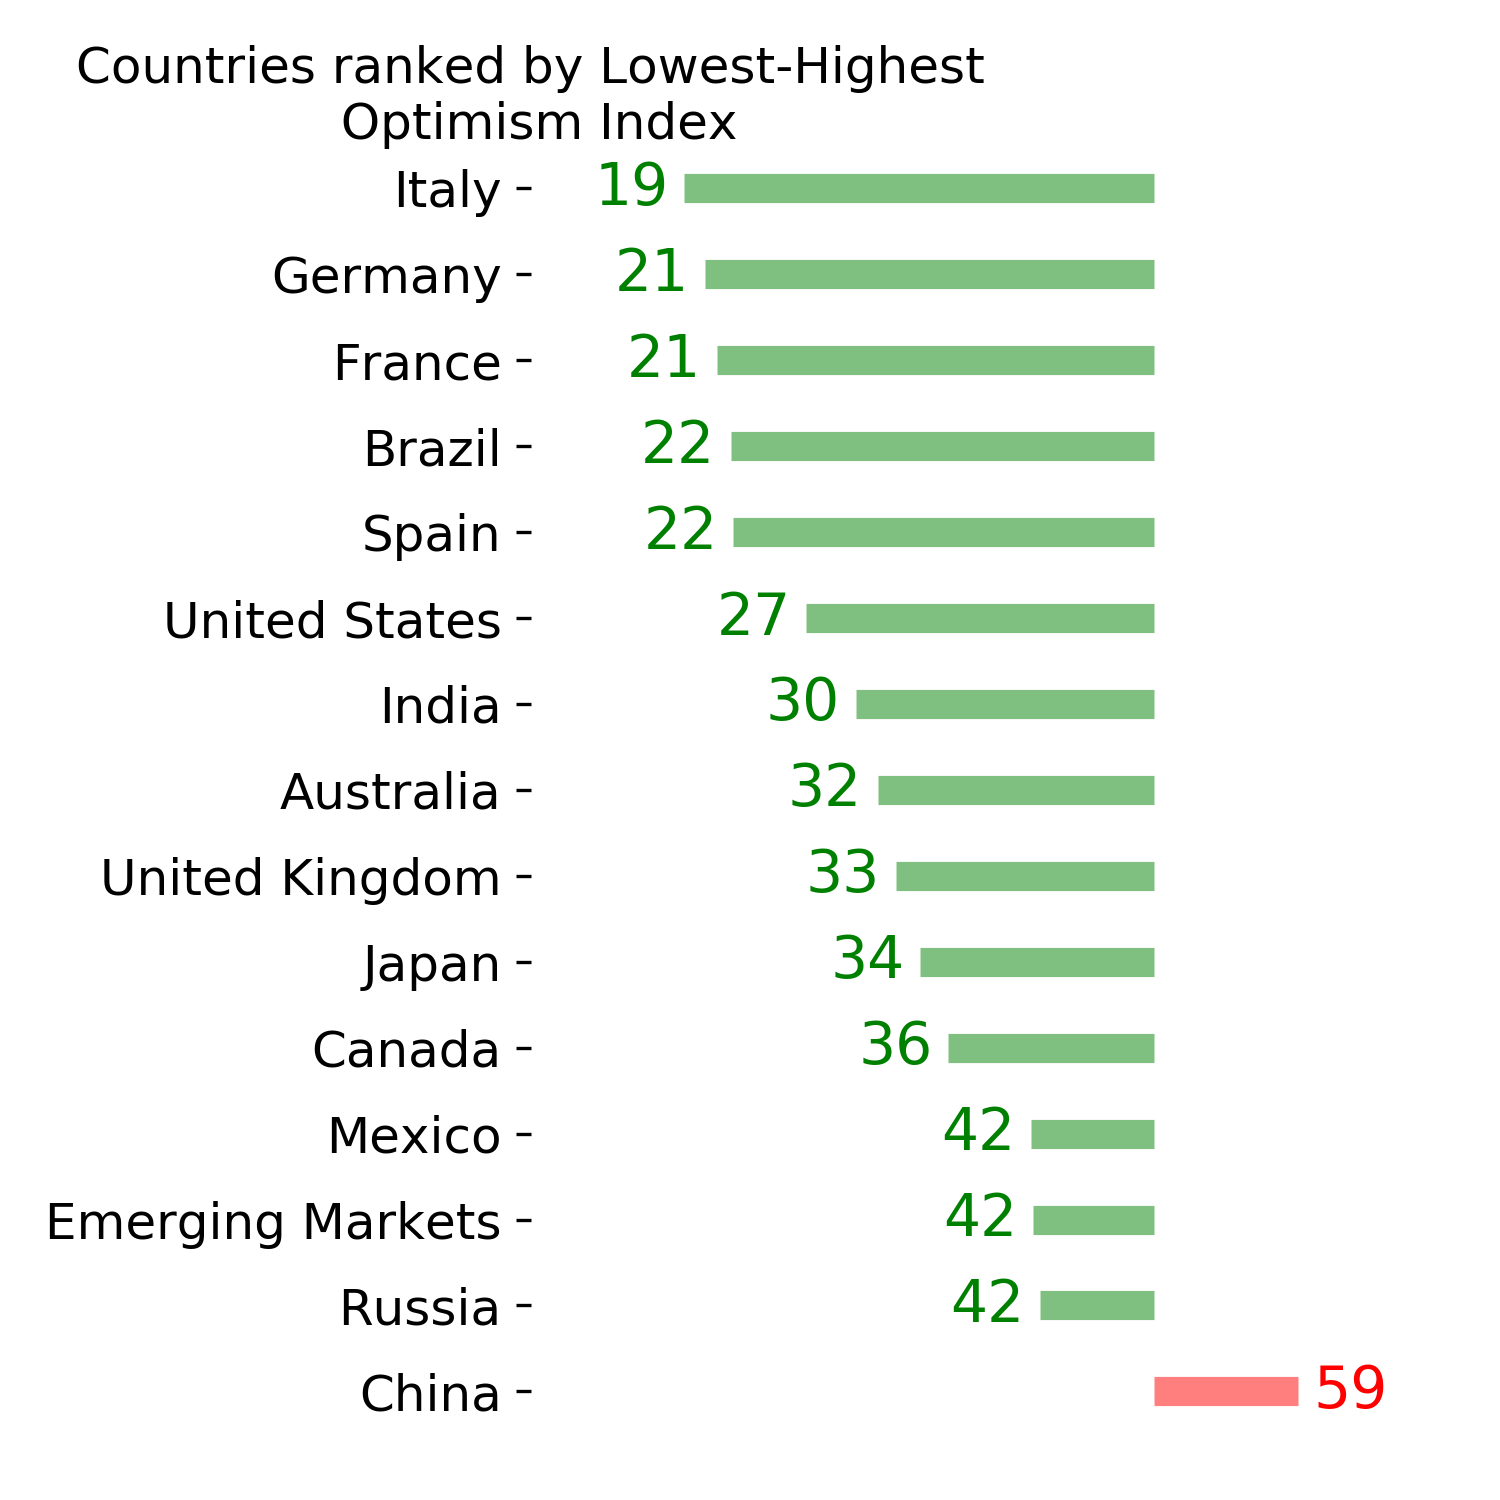
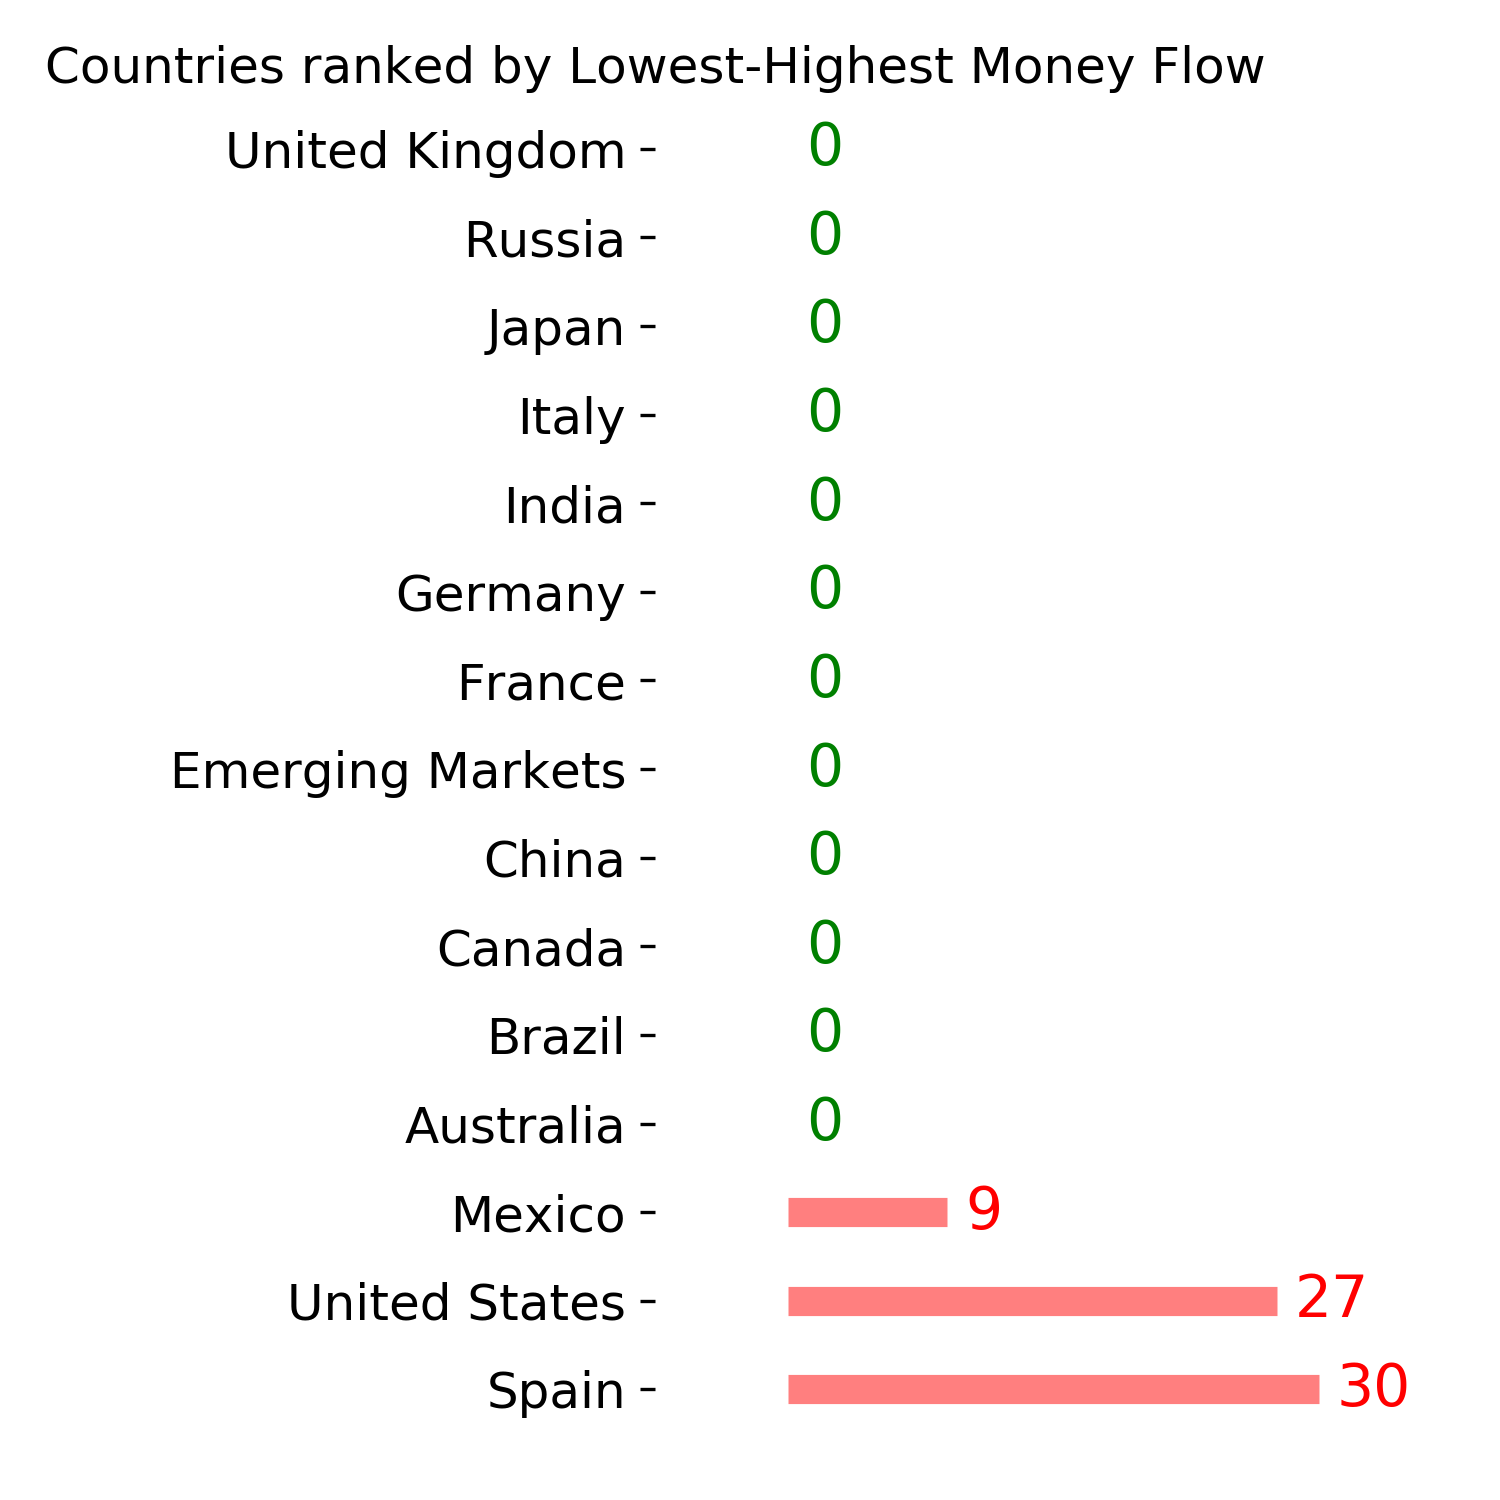
Ranks
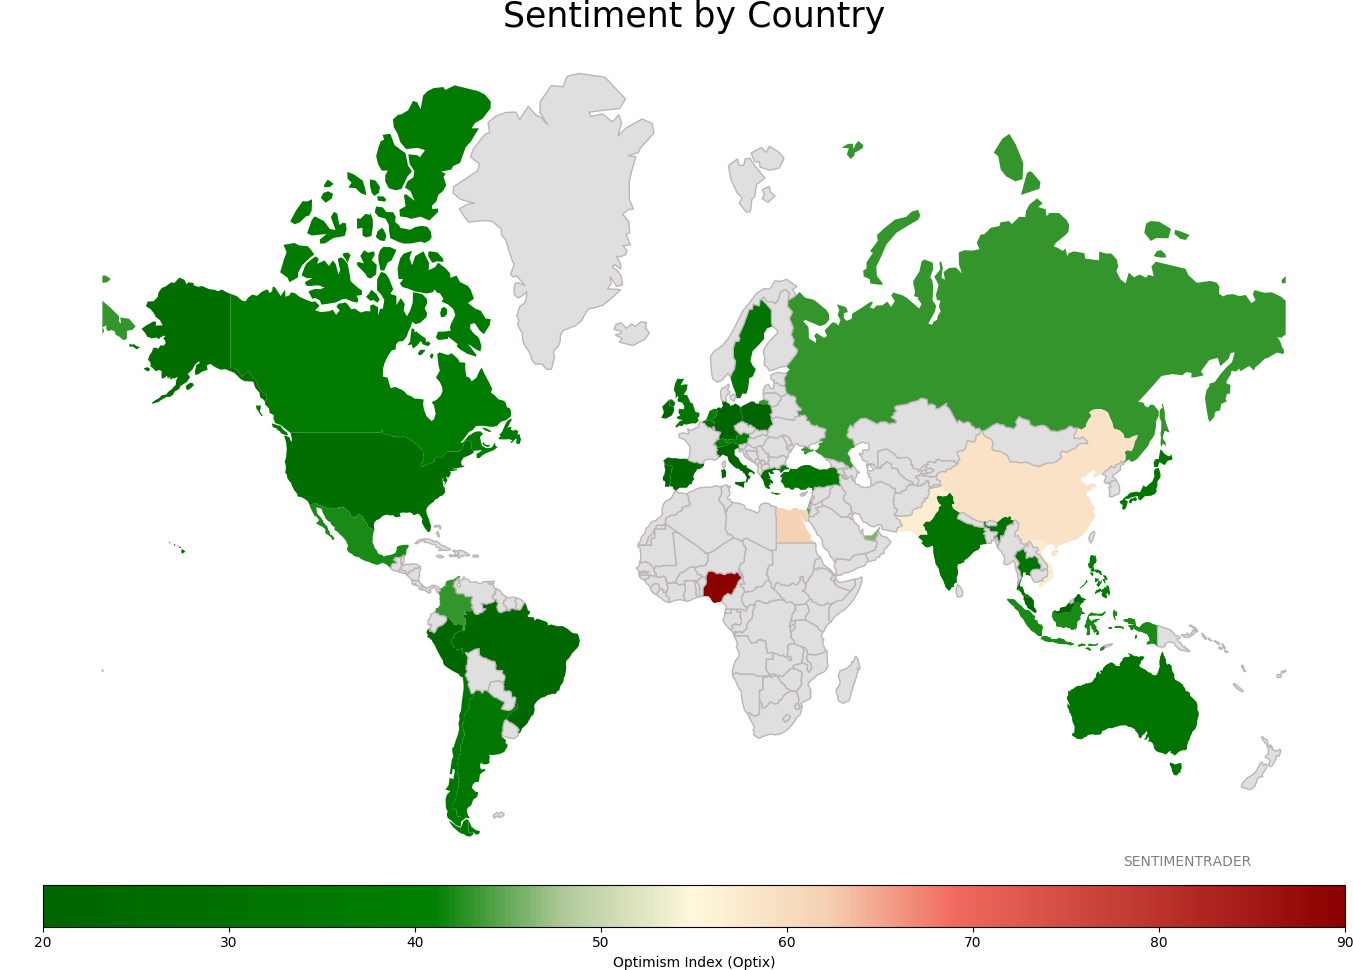
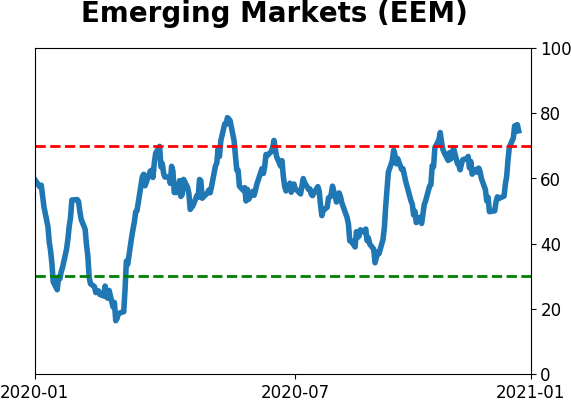
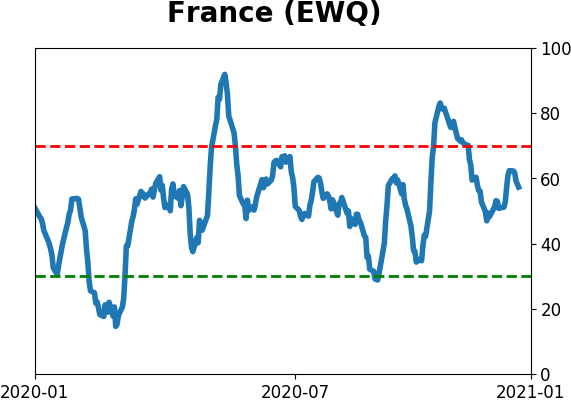
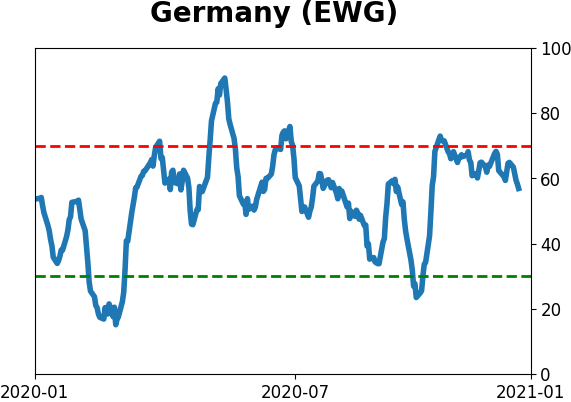
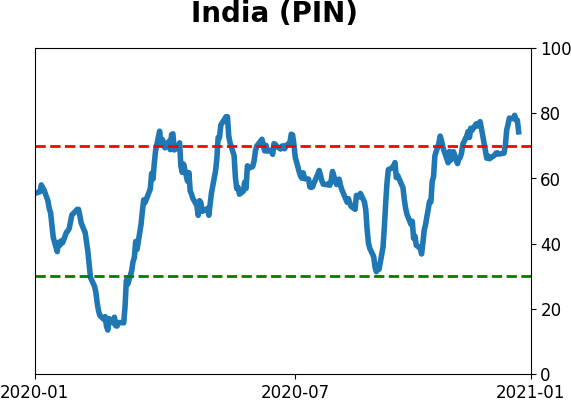
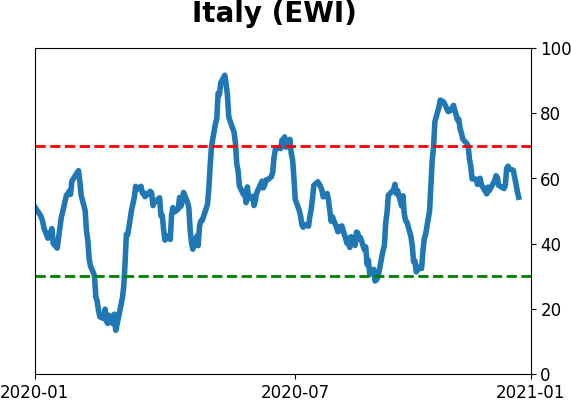
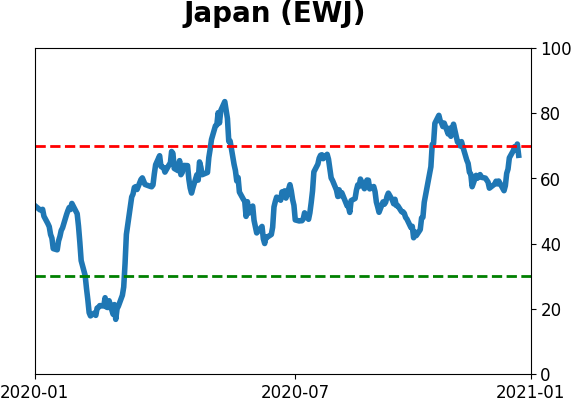
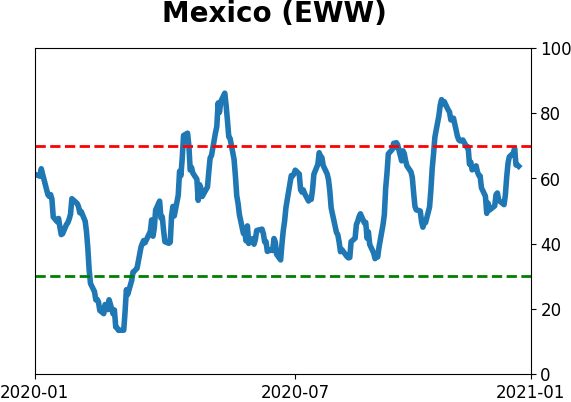
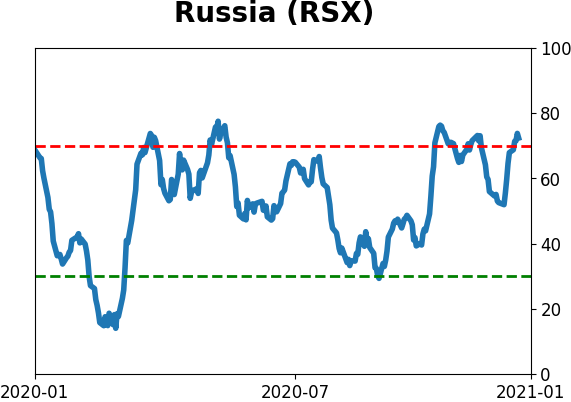
Sentiment Around The World
Optimism Index Thumbnails
|
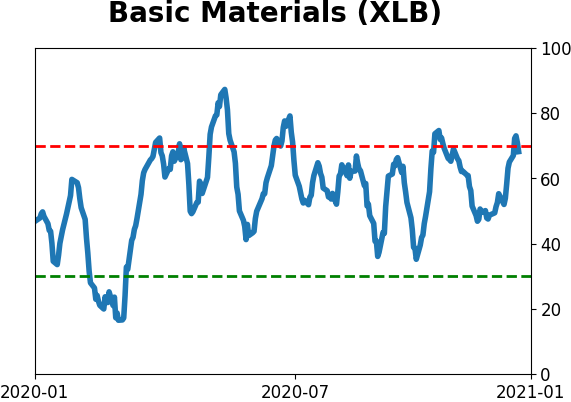
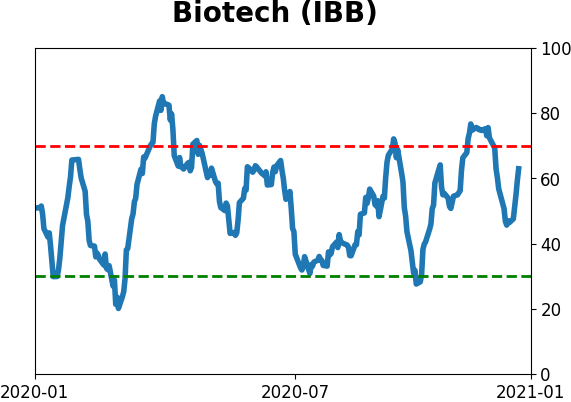
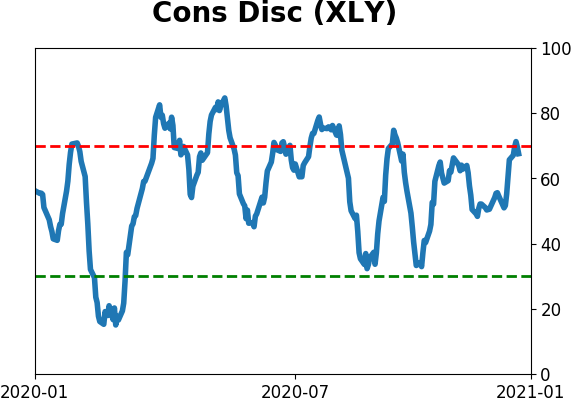
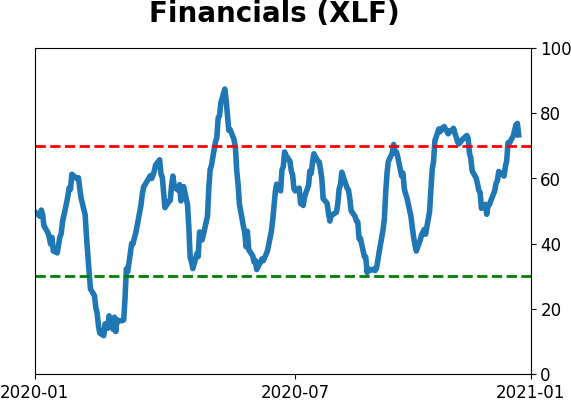
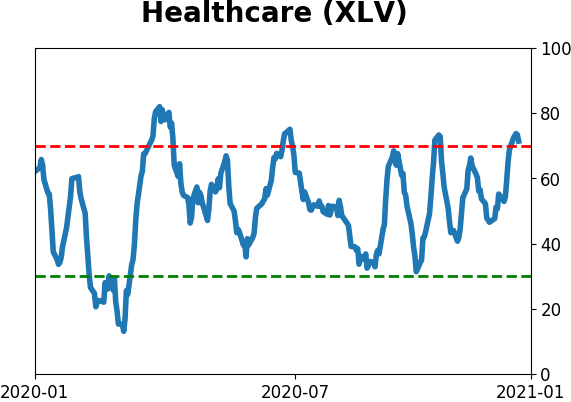
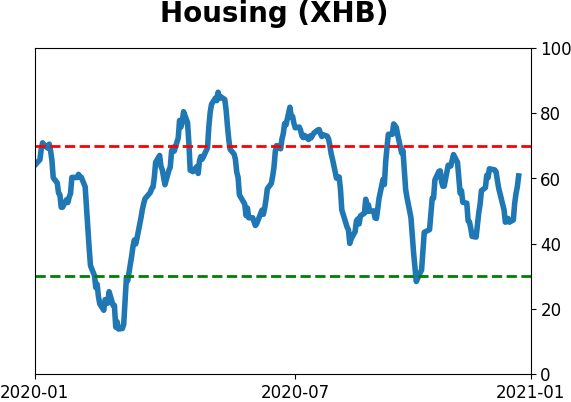
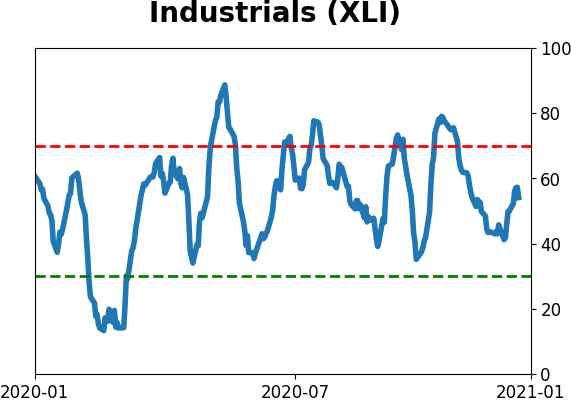
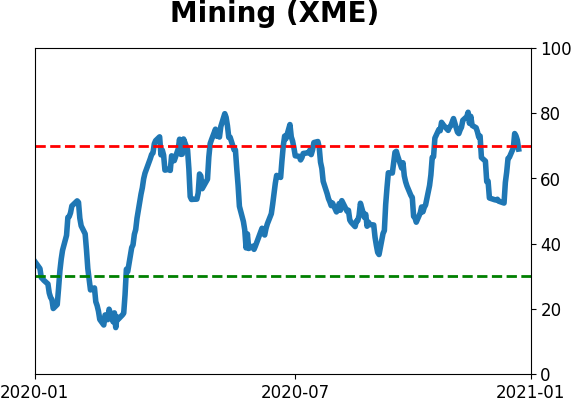
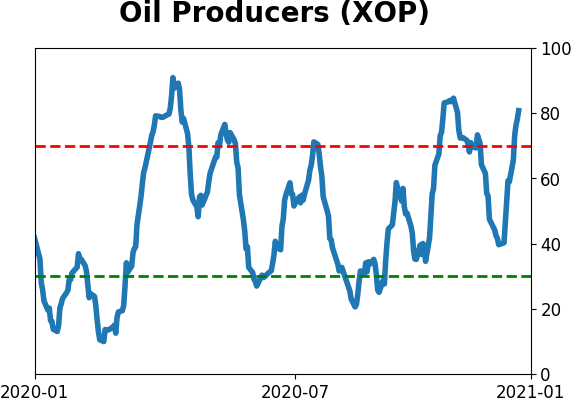
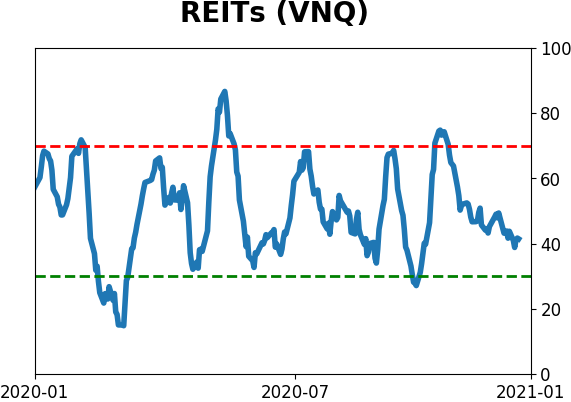
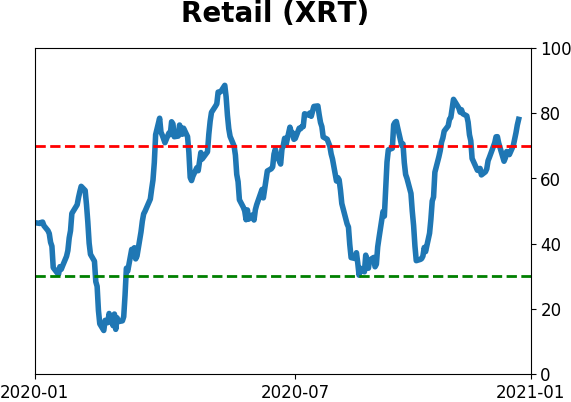
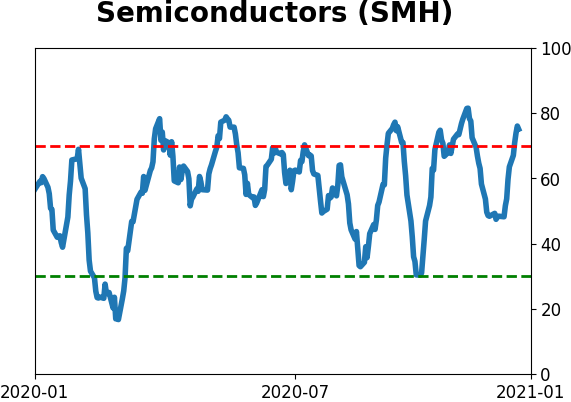
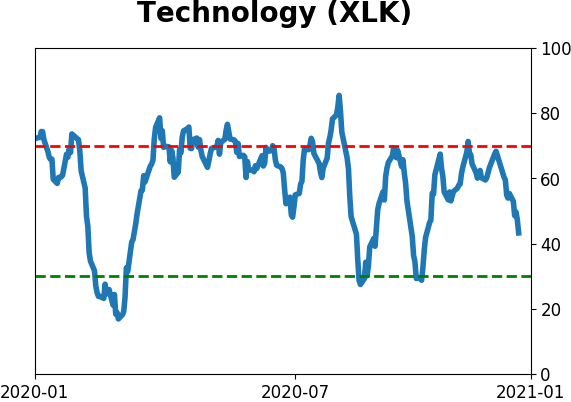
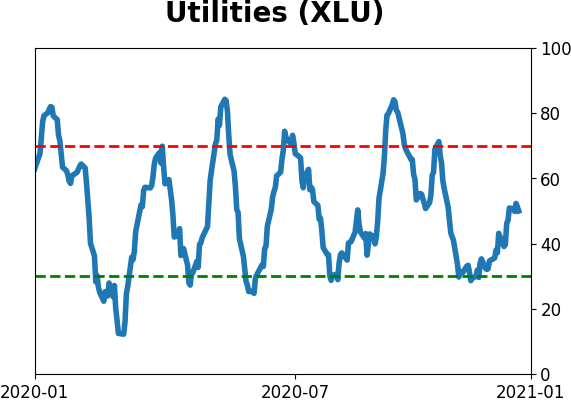
Sector ETF's - 10-Day Moving Average
|
|
|
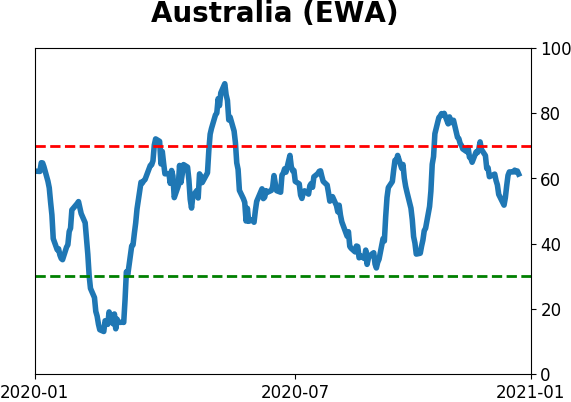
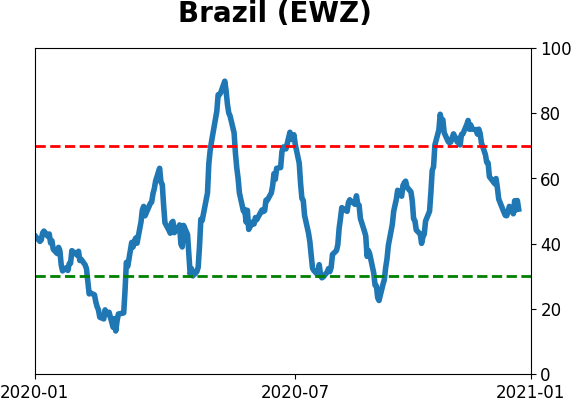
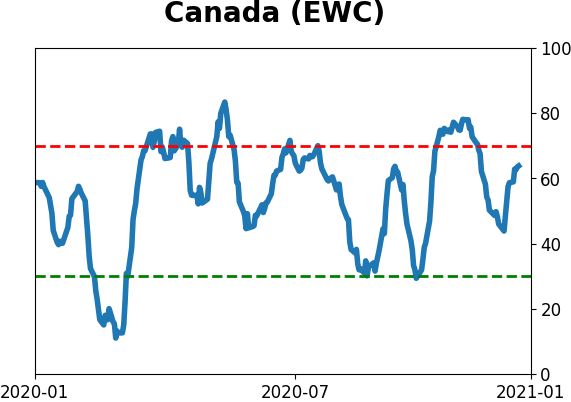
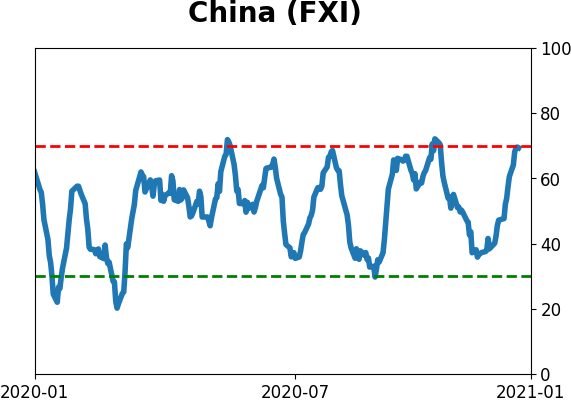
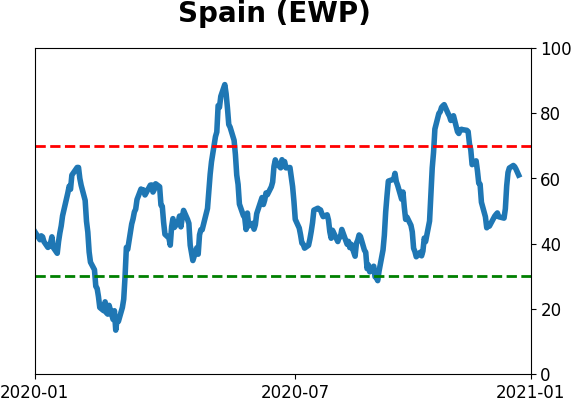
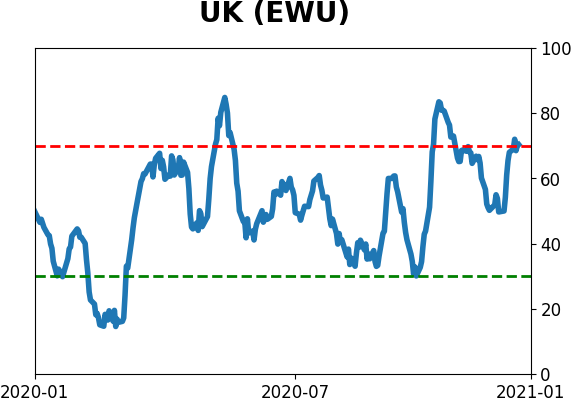
Country ETF's - 10-Day Moving Average
|
|
|
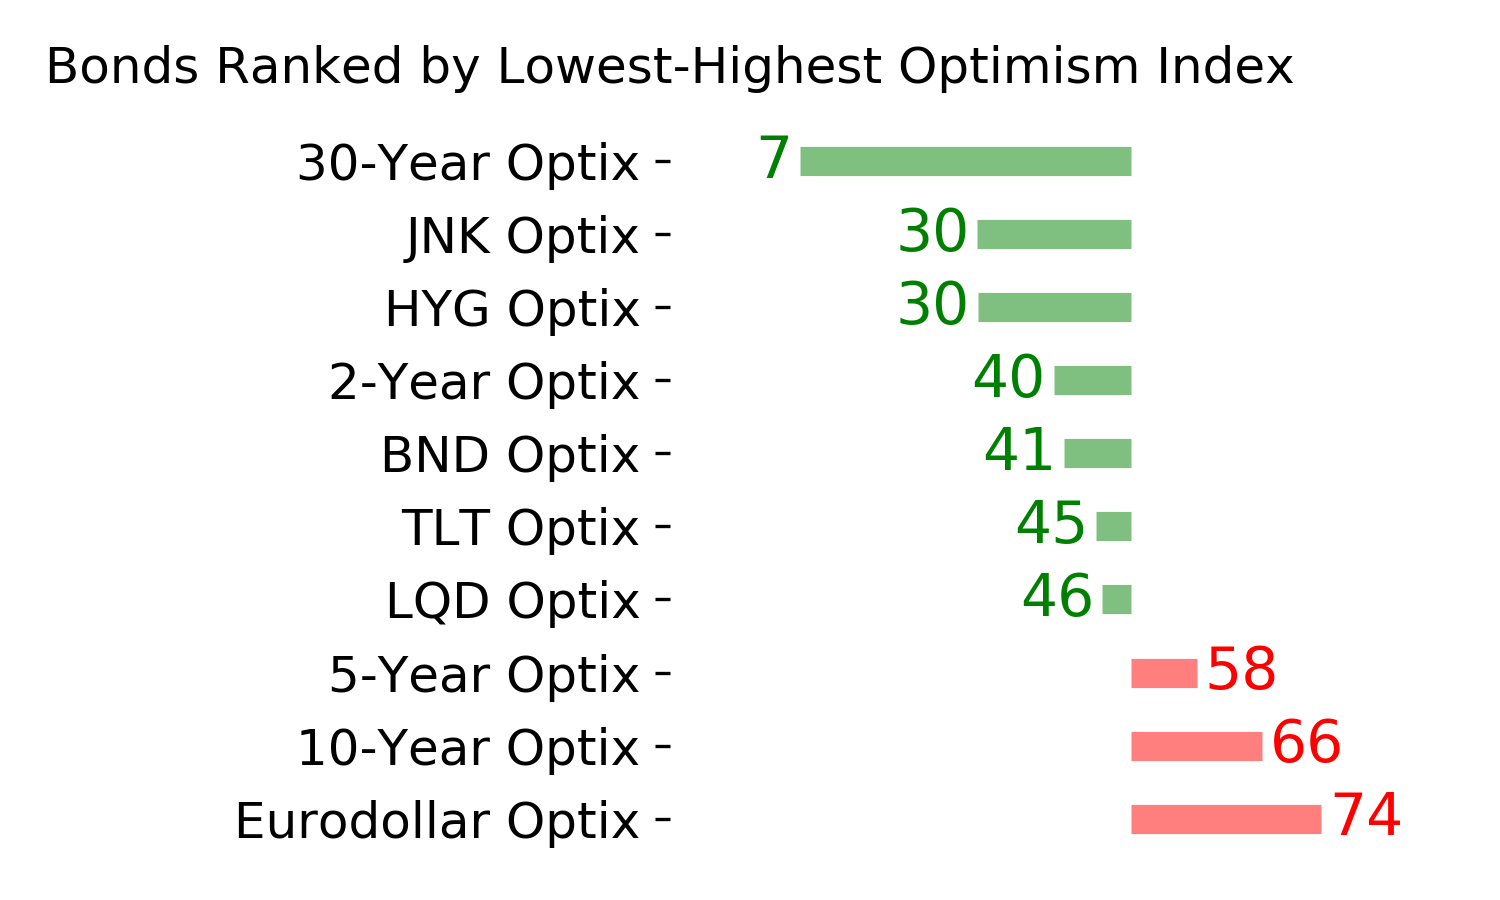
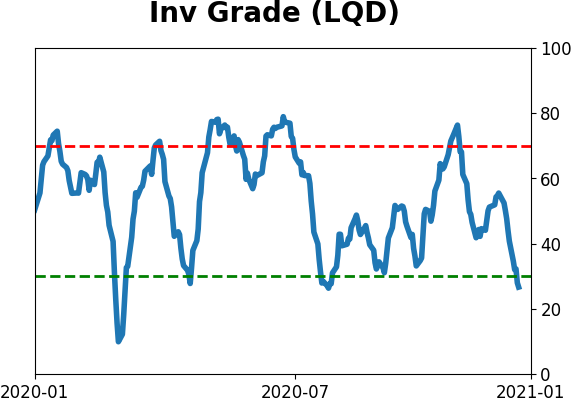
Bond ETF's - 10-Day Moving Average
|
|
|
Currency ETF's - 5-Day Moving Average
|
|
|
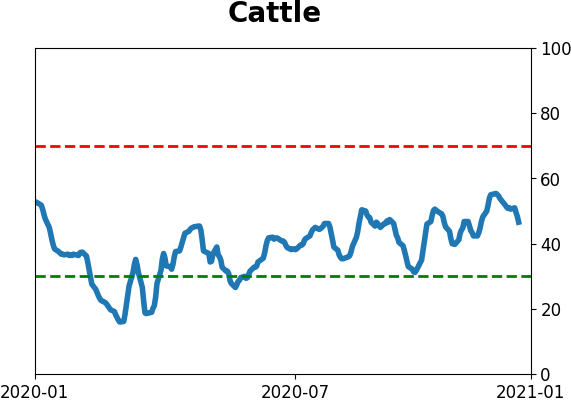
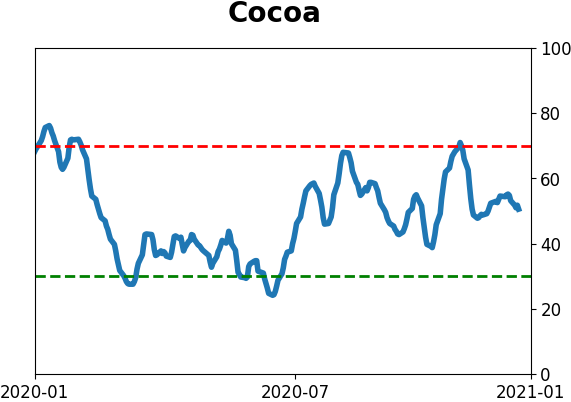
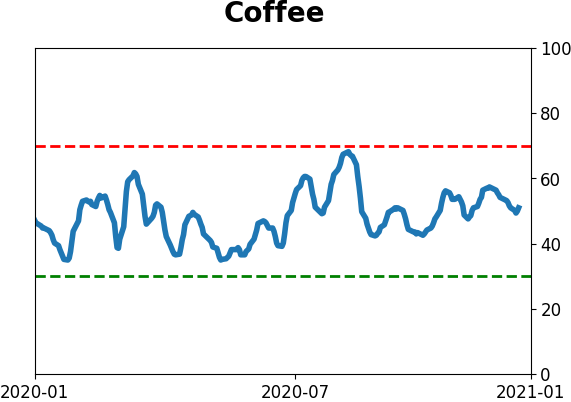
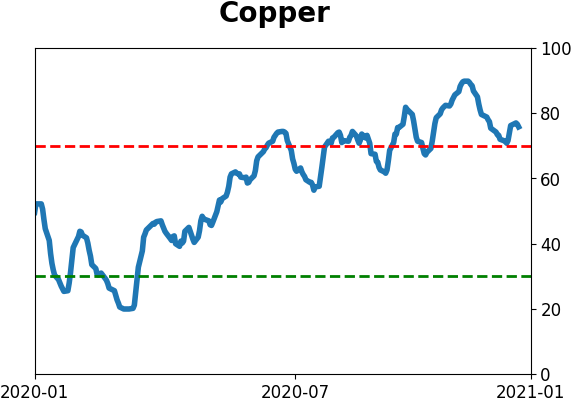
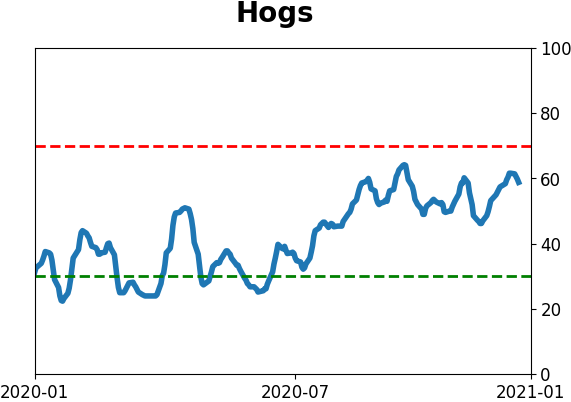
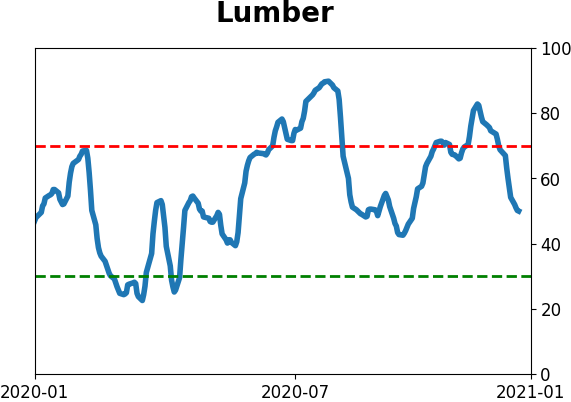
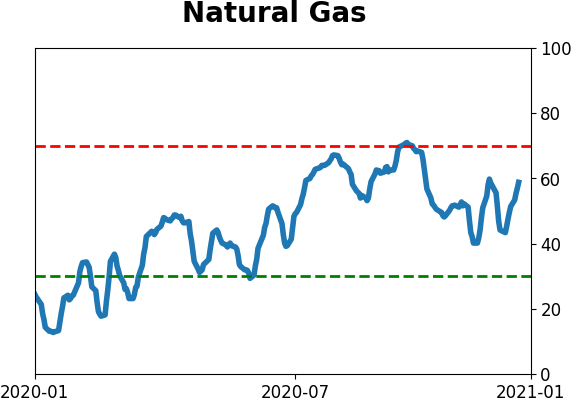
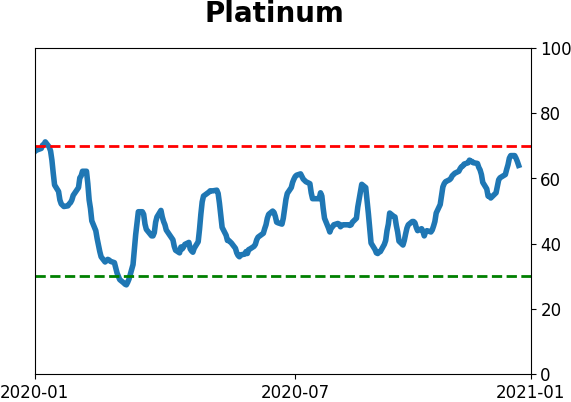
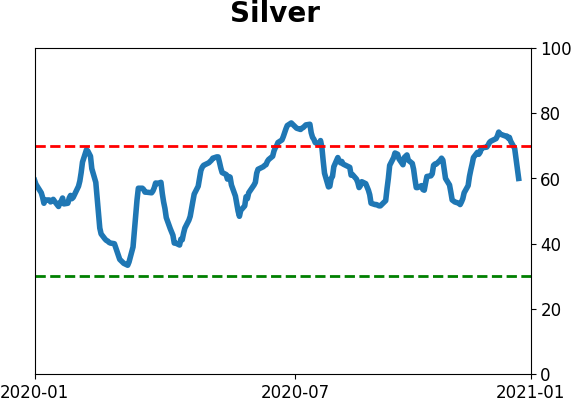
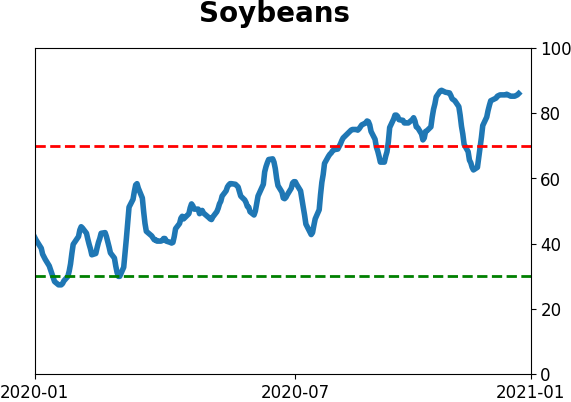
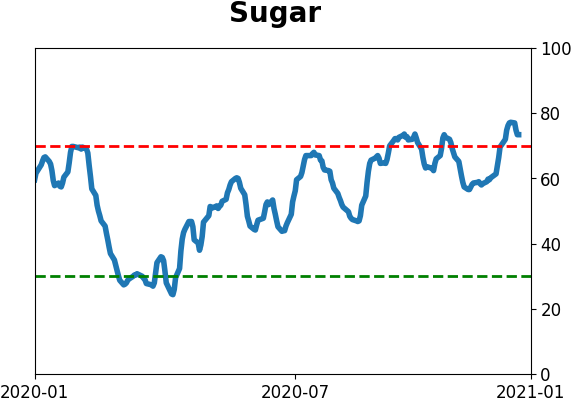
Commodity ETF's - 5-Day Moving Average
|
|