Headlines
|
|
More than 1 trillion served:
There has been a massive spike in speculative activity. Call options volume is hitting records, as is dealers' Gamma Exposure. It's not just options, as activity in penny stocks has also seen a tremendous jump in recent weeks.
Betting against bonds: As aggressively as traders have been buying call options on stocks, traders on 10-year Treasuries are pressing their bearish bets. On Tuesday, more than 800,000 put options were traded for only the 5th time in history. After the other four, funds like TLT tended to see only limited losses, and averaged a return of +13.1% over the next 6 months. It's a single data point, with a tiny sample size, but it's a little more evidence that sentiment may have shifted a bit too much one way. The dates were 2016-11-10, 2018-10-04, 2019-09-13, and 2019-11-07.
Bottom Line:
The market environment is pristine, with only sporadic signs of internal deterioration, but with near-historic optimism, gains tend to be muted, with a high probability of being reversed at some point over the ensuing weeks. | Other Sectors and Assets |
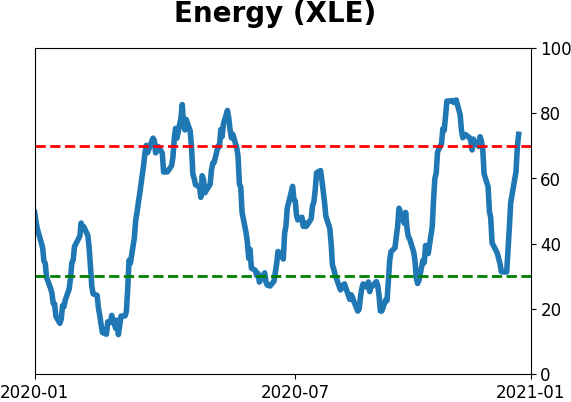
| | Positives | Negatives | | 1. Energy (here, here, and here) | 1. Skewed tech (here and here) |
|
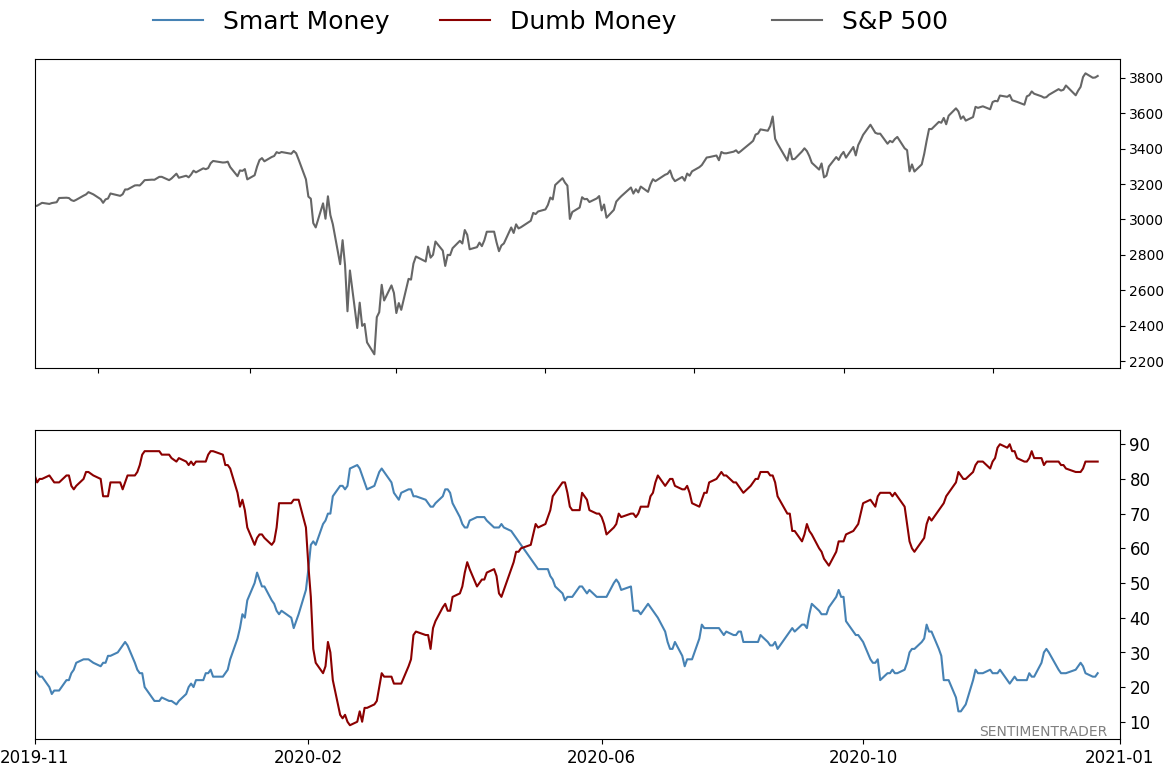
Smart / Dumb Money Confidence
|
Smart Money Confidence: 24%
Dumb Money Confidence: 85%
|
|
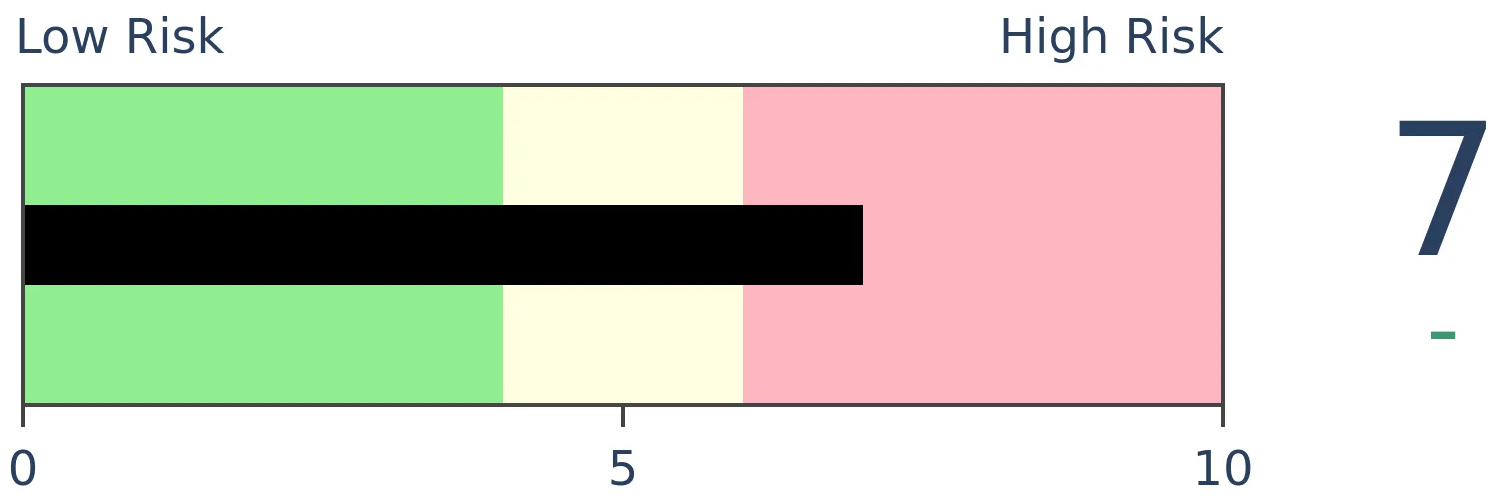
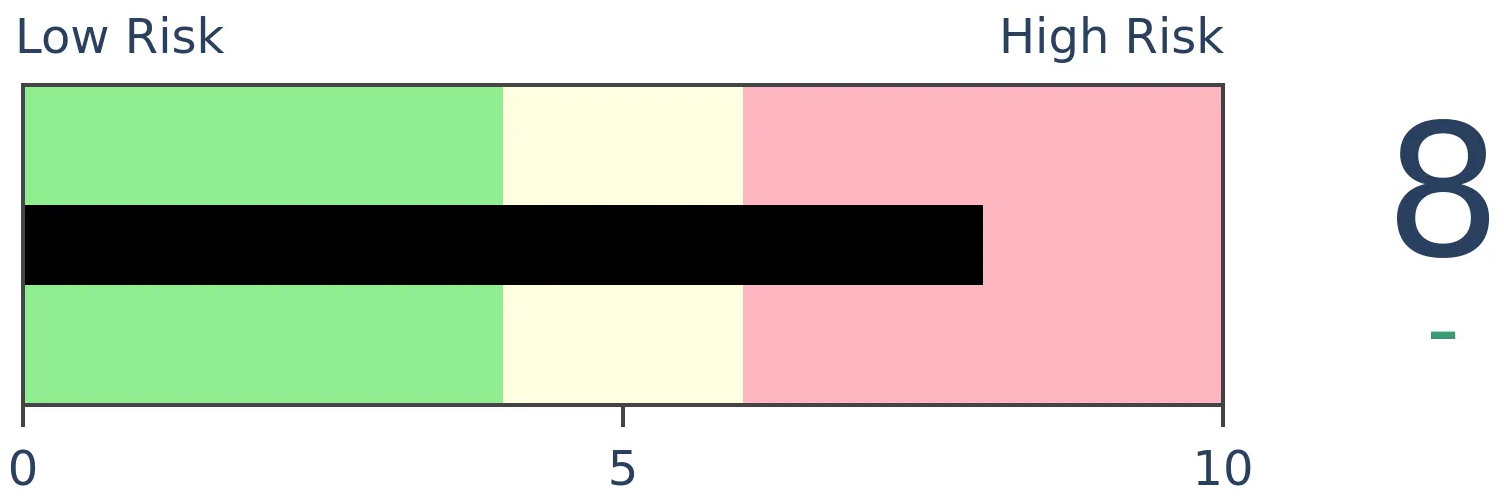
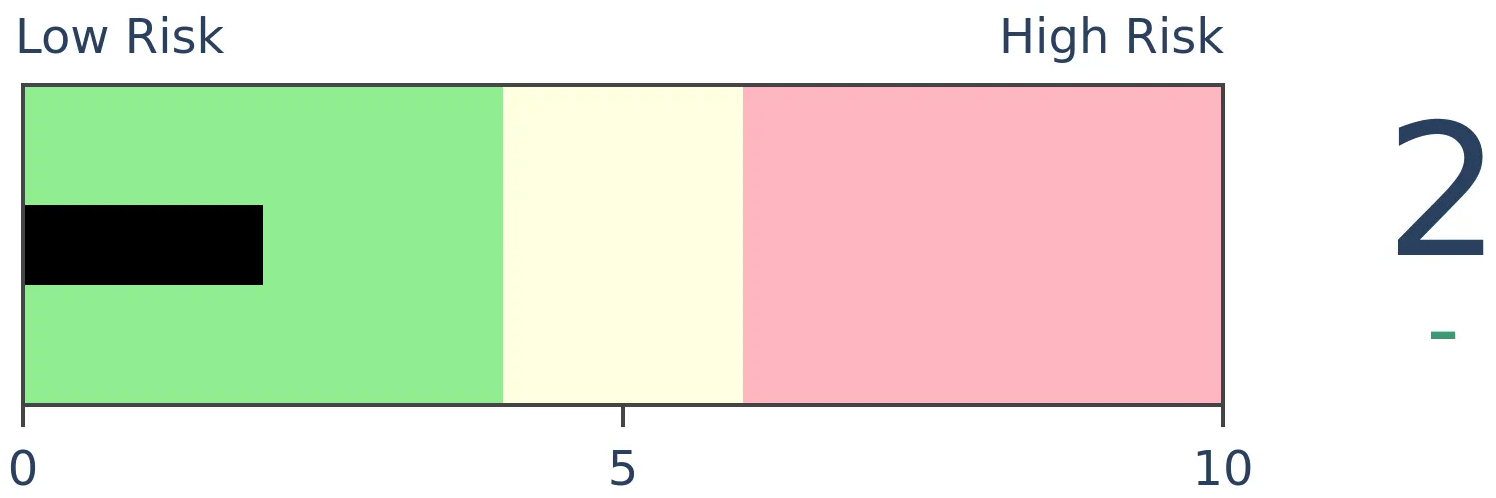
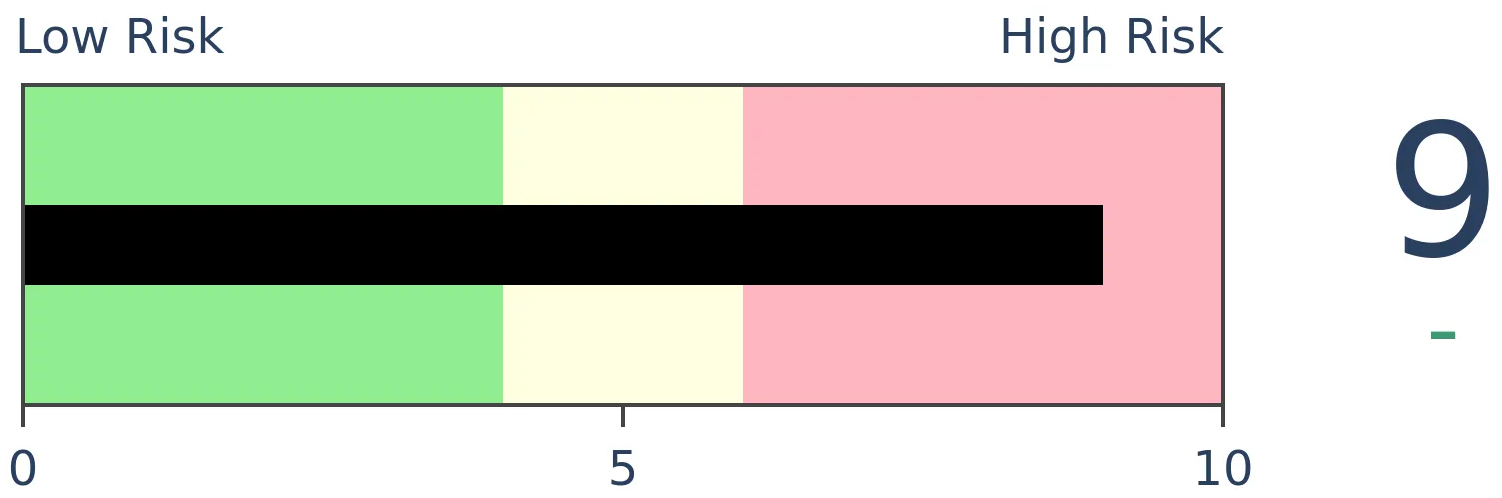
Risk Levels
Stocks Short-Term
|
Stocks Medium-Term
|
|
Bonds

|
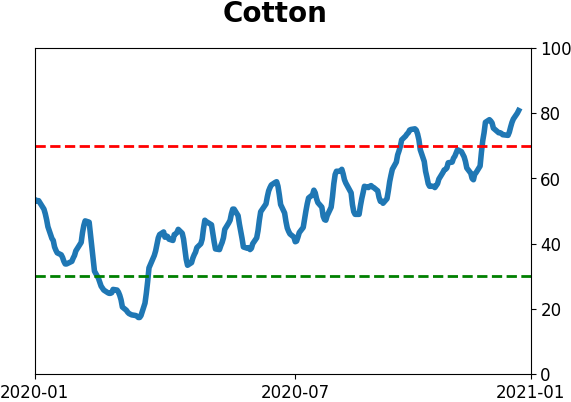
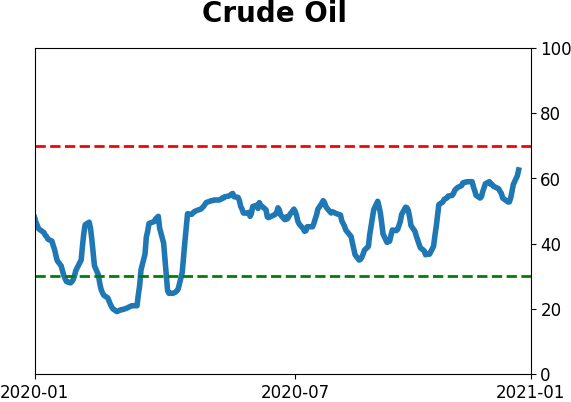
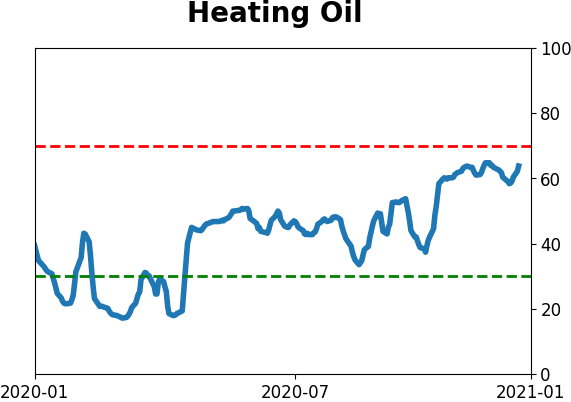
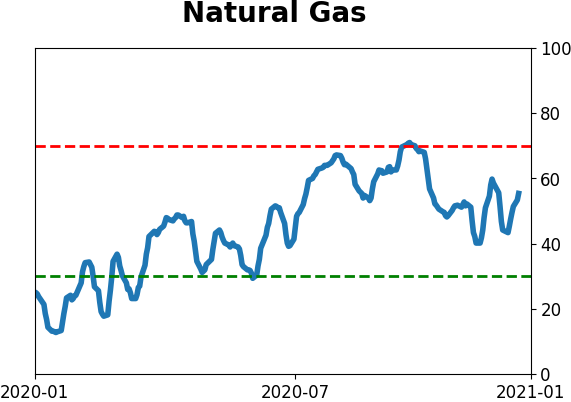
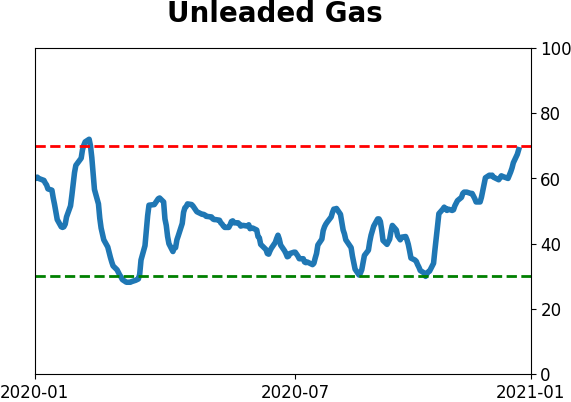
Crude Oil

|
|
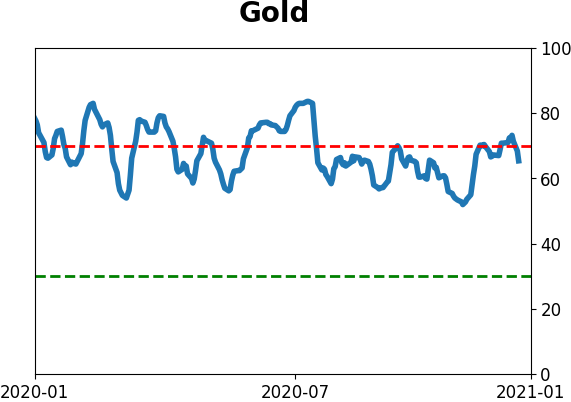
Gold
|
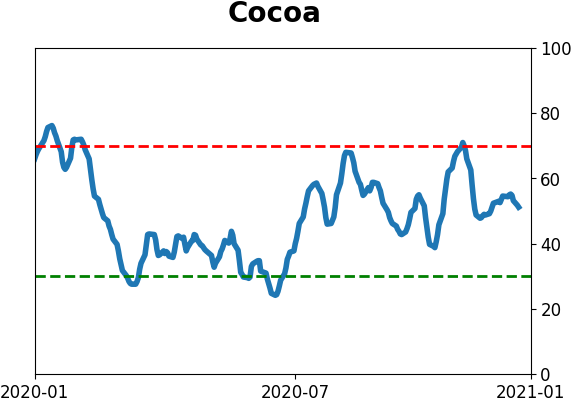
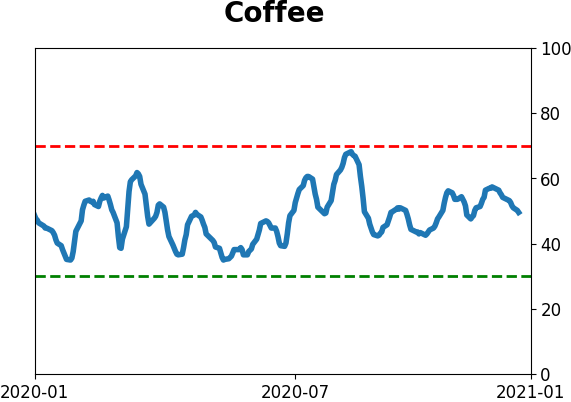
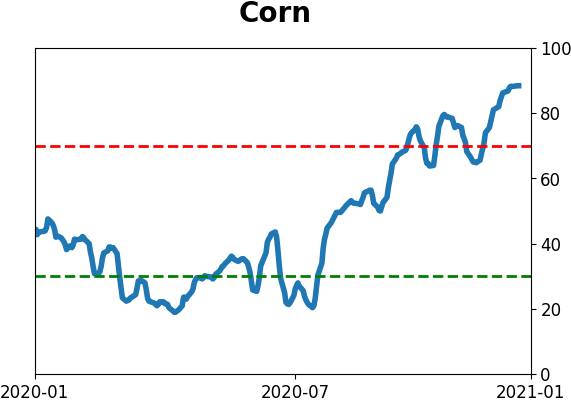
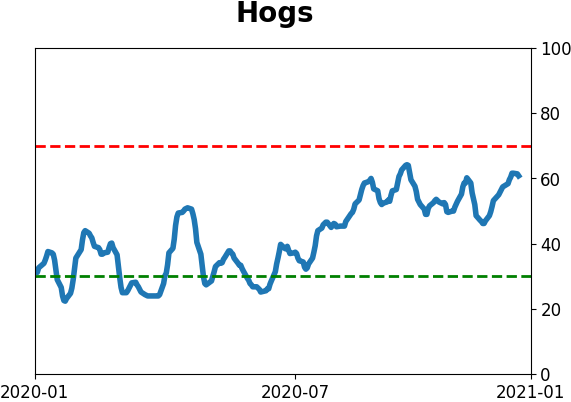
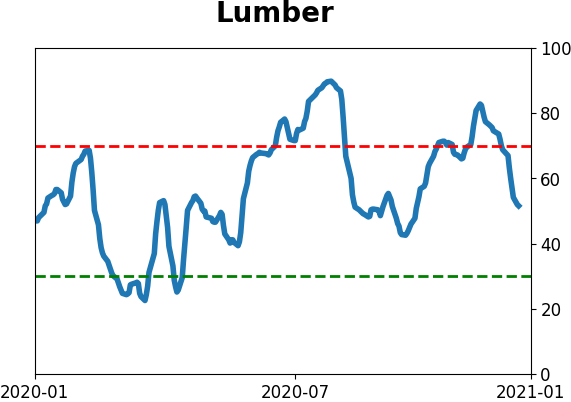
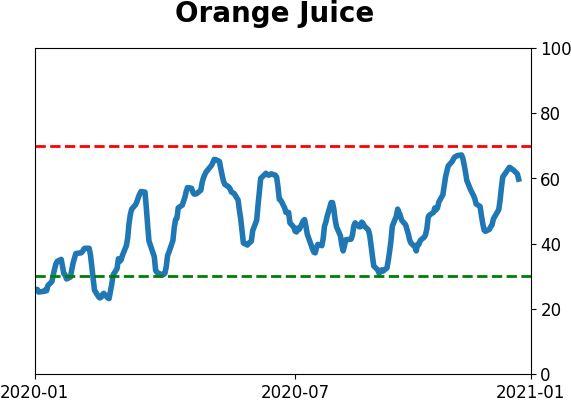
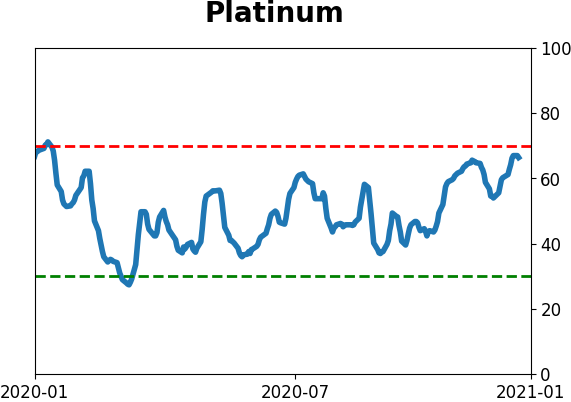
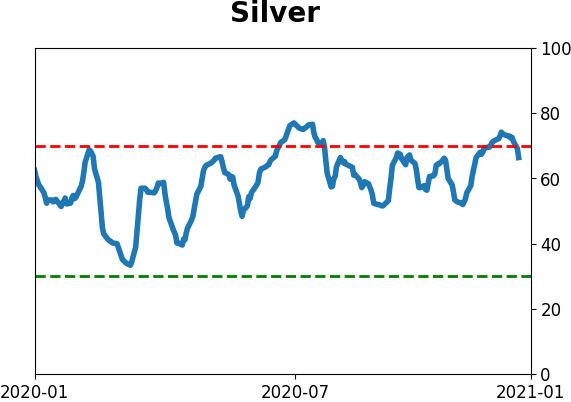
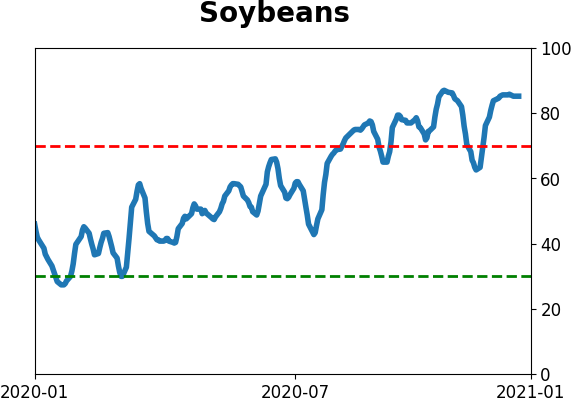
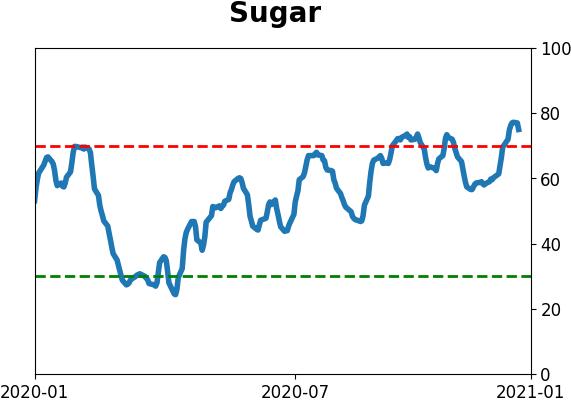
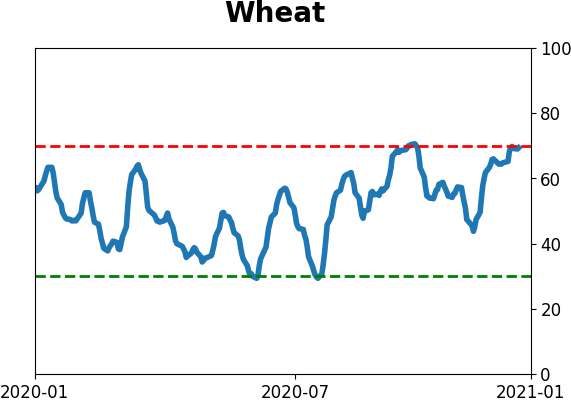
Agriculture
|
|
Research
BOTTOM LINE
There has been a massive spike in speculative activity. Call options volume is hitting records, as is dealers' Gamma Exposure. It's not just options, as activity in penny stocks has also seen a tremendous jump in recent weeks.
FORECAST / TIMEFRAME
None
|
There is a feeding frenzy out there, and the devouring horde is roaming toward more and more speculative outlets.
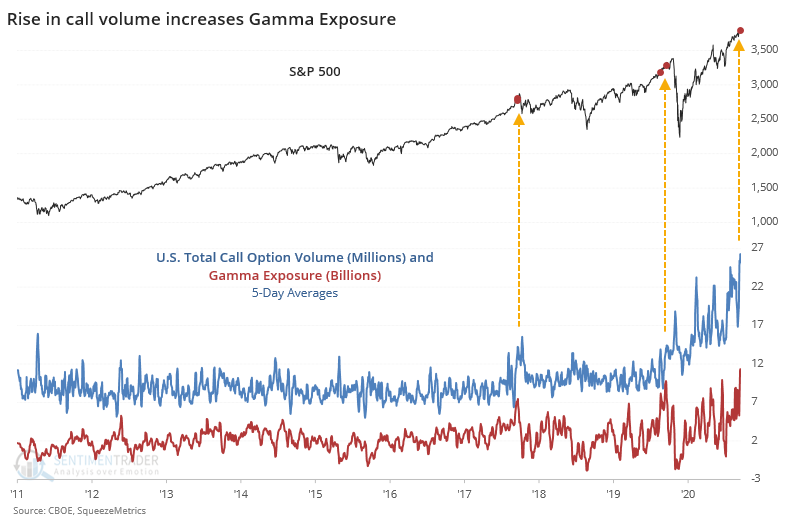
It started last June with a spike in options trading, specifically calls. Probably not a coincidence that that was around the time the first round of stimulus checks were reading bank accounts. It reached a fever peak in late August, pulled back in September as losses piled up, then spiked again in December and continues to this day.
Over the past 5 days, U.S. options exchanges have executed an average of nearly 27 million call contracts, a record high. As a result, potential selling pressure from dealers has also spiked to a record. Both measures have been at their highest levels in a year at the same time only near the beginnings of 2018 and 2020. The aftermaths are clear on the chart.
Even while the TikTok crowd still hasn't become bored with options, they've branched out to other avenues. Anything that moves, and moves fast, preferably on margin. Tesla, bitcoin, it doesn't matter.
That has been readily apparent over the past few weeks. As Bloomberg notes,
While it's not unheard of to see a microcap like pet-medicine maker Zomedica Corp. top the most-active list with a billion shares traded, as it did Monday, it is notable when it and five other companies selling for less than $1 make up almost a fifth of overall volume. That also occurred yesterday, data compiled by Themis Trading LLC's Joseph Saluzzi show.
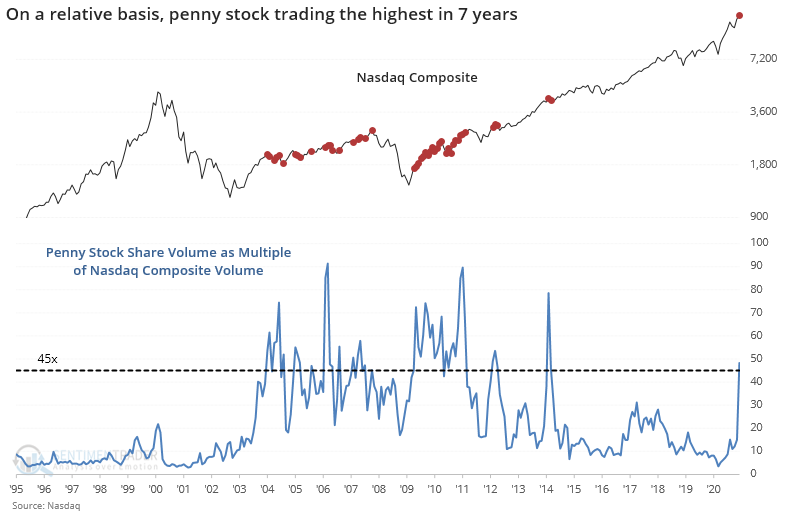
When January's figures are released, it's likely going to show near-record levels of volume in the lottery tickets also known as penny stocks, pink sheets, or over-the-counter stocks. There are over 12,000 of these securities traded off the major exchanges, typically because their price is too low or they can't meet stringent financial requirements.
Even in December, this activity was starting to spike. For the first time in a decade, more than 1 trillion shares traded. Yeah, that's trillion with a "t."
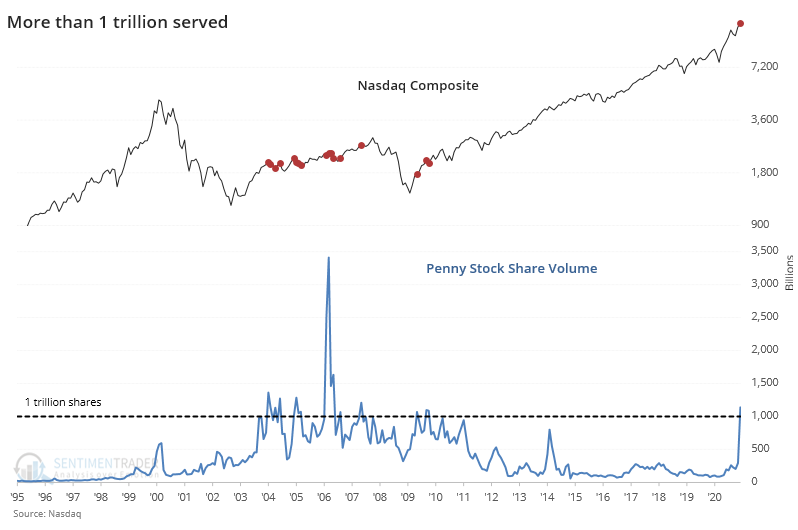
For comparison's sake, that's nearly 50 times the volume traded among securities in the Nasdaq Composite index.
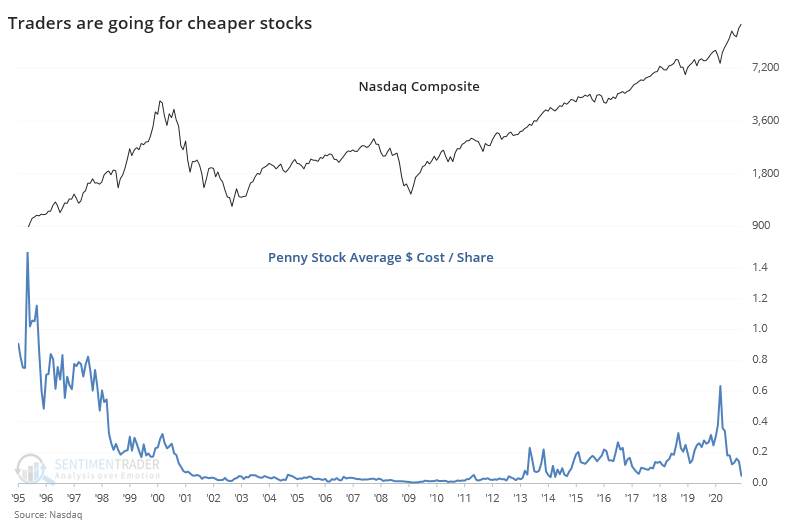
More and more of this volume was in the most speculative corner of these most speculative stocks. The average share price plummeted to less than $0.05 per share.
This means that the total amount of money gambled on these stocks wasn't quite as extreme, but it's still remarkably high, at nearly $60 billion.
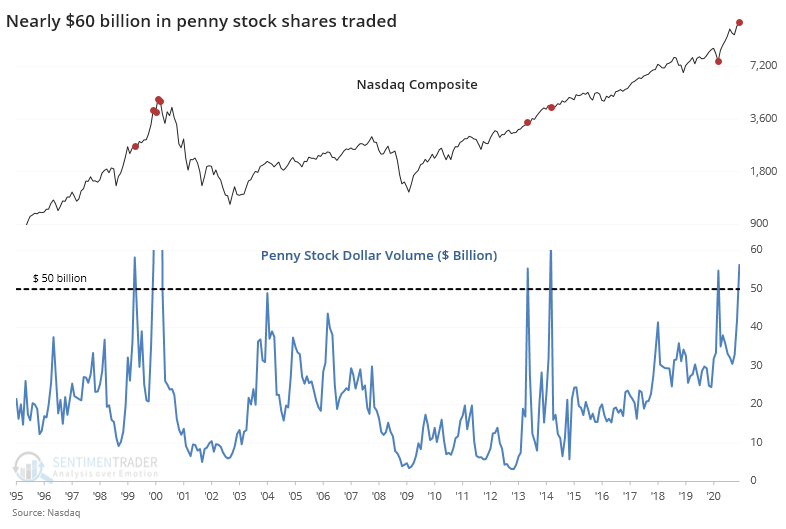
The dots on the chart show that this kind of behavior wasn't a perfect contrary indicator. The Nasdaq was able to hold for a while, or even enjoy some sustained gains, after other spikes in penny stock activity. The concern is more of a cumulative one. We're seeing massive - record, even - activity in the most speculative vehicles that are allowed in the U.S. Markets have proven time and again that when confidence is this high, we're going to get spanked. It may take awhile, but it happens.
There is still no consistent deterioration under the market, even in canary-in-the-coalmine areas like junk bonds. If there were, then we'd be in full-out sell mode at the moment. As it stands, the risk remains very high that further shorter-term gains will evaporate, we're just not seeing the type of activity that typically means that it's imminent and protracted.
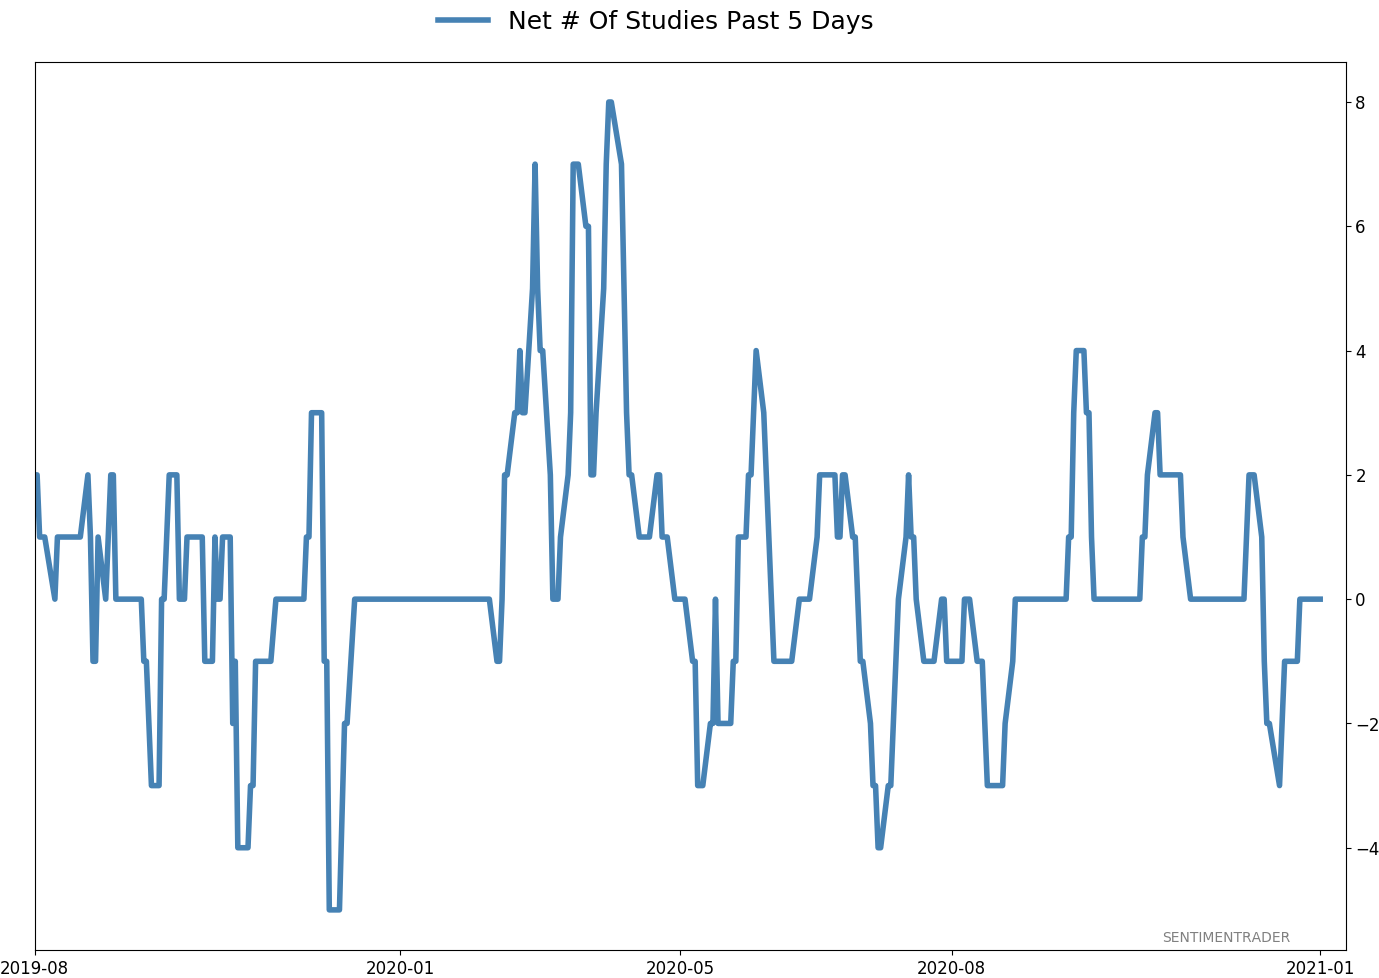
Active Studies
| Time Frame | Bullish | Bearish | | Short-Term | 0 | 0 | | Medium-Term | 2 | 1 | | Long-Term | 14 | 2 |
|
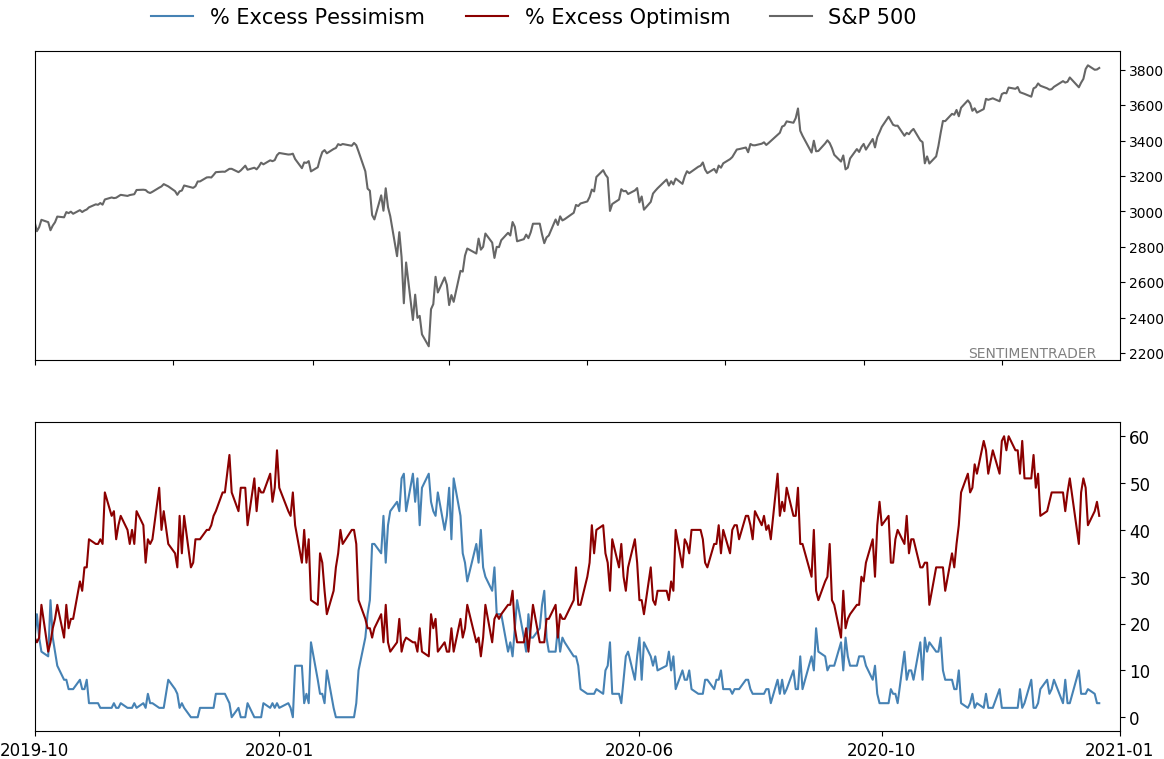
Indicators at Extremes
Portfolio
| Position | Description | Weight % | Added / Reduced | Date | | Stocks | 10.6% VWO, 10.1% XLE, 8.5% RSP, 8.3% PSCE | 37.5 | Added 3% | 2021-01-05 | | Bonds | 10% BND, 10% SCHP, 10% ANGL | 27.8 | Reduced 0.1% | 2020-10-02 | | Commodities | GCC | 2.3 | Reduced 2.1%
| 2020-09-04 | | Precious Metals | GDX | 9.8 | Added 4.8% | 2020-12-01 | | Special Situations | | 0.0 | Reduced 5% | 2020-10-02 | | Cash | | 22.6 | | |
|
Updates (Changes made today are underlined)
There hasn't been much that changed in recent weeks, with sky-high sentiment on many measures receding a bit, but that's not necessarily a good sign, just ask February 2020. We still have the lingering positives from all the breadth thrust last year, as late as October and November. Those have a very good historical record at preceding higher prices over a longer time frame. Of more immediate concern is the explosion in speculation in the most leveraged parts of the market. So far, that hasn't translated to price troubles, though there have been more oddities n the latter half of December than we'd seen since August, like the major indexes rising but on very poor breadth. I continue to avoid tech- and cap-heavy indexes, and don't see that changing any time soon. Energy stocks are doing what they should, and I added a bit more there. I'm not a momentum trader and do not focus on pyramiding positions in this account - it's more about protecting capital - but I like the setup on a long-term time frame. RETURN YTD: 3.6% 2020: 8.1%, 2019: 12.6%, 2018: 0.6%, 2017: 3.8%, 2016: 17.1%, 2015: 9.2%, 2014: 14.5%, 2013: 2.2%, 2012: 10.8%, 2011: 16.5%, 2010: 15.3%, 2009: 23.9%, 2008: 16.2%, 2007: 7.8%
|
|
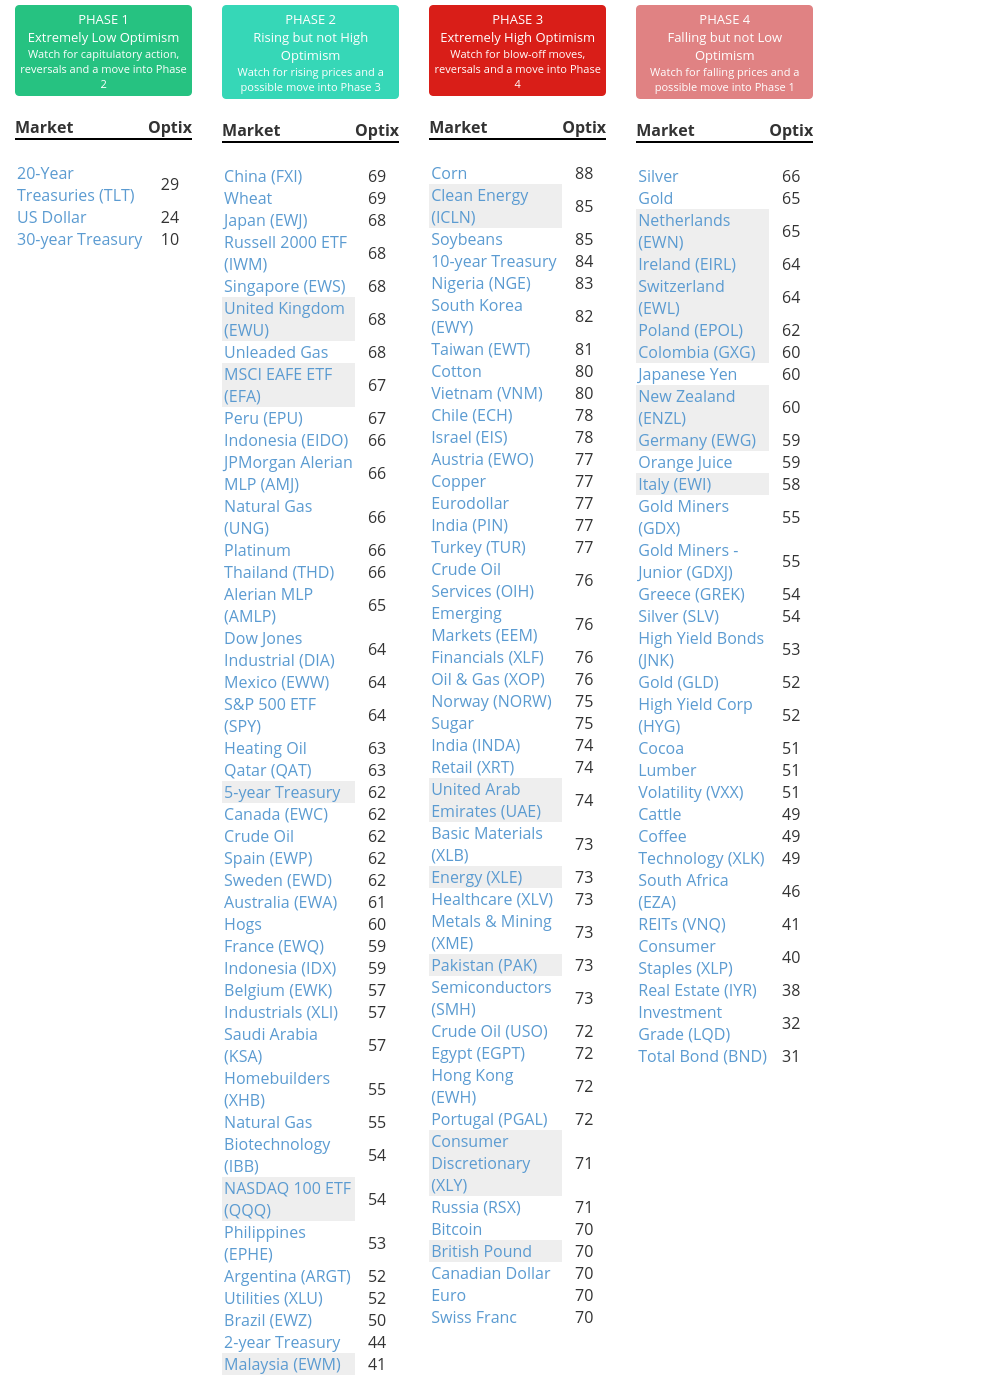
Phase Table
Ranks
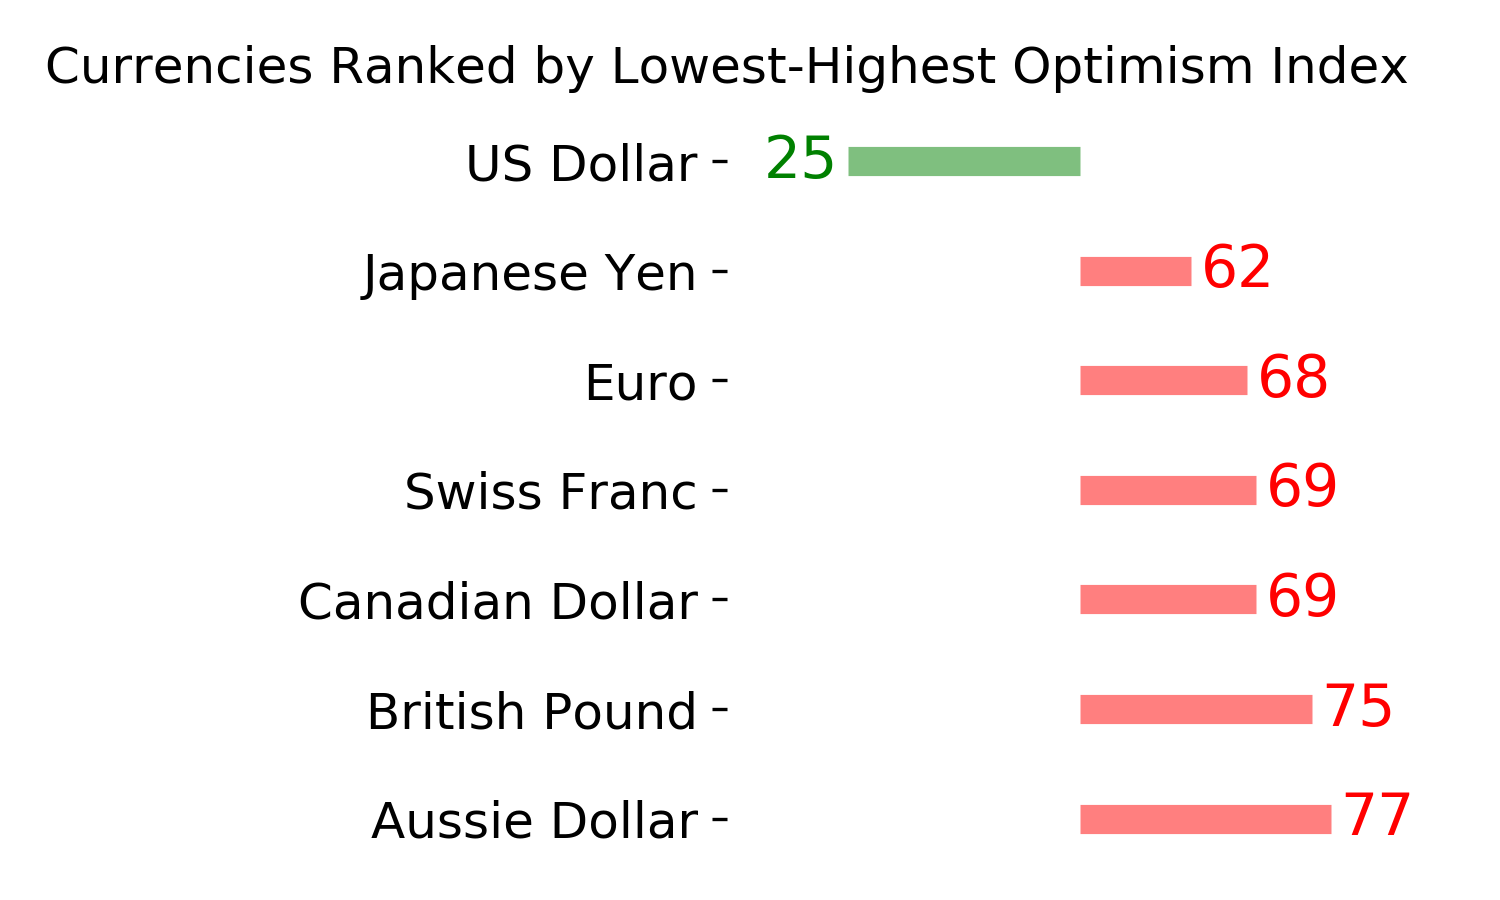
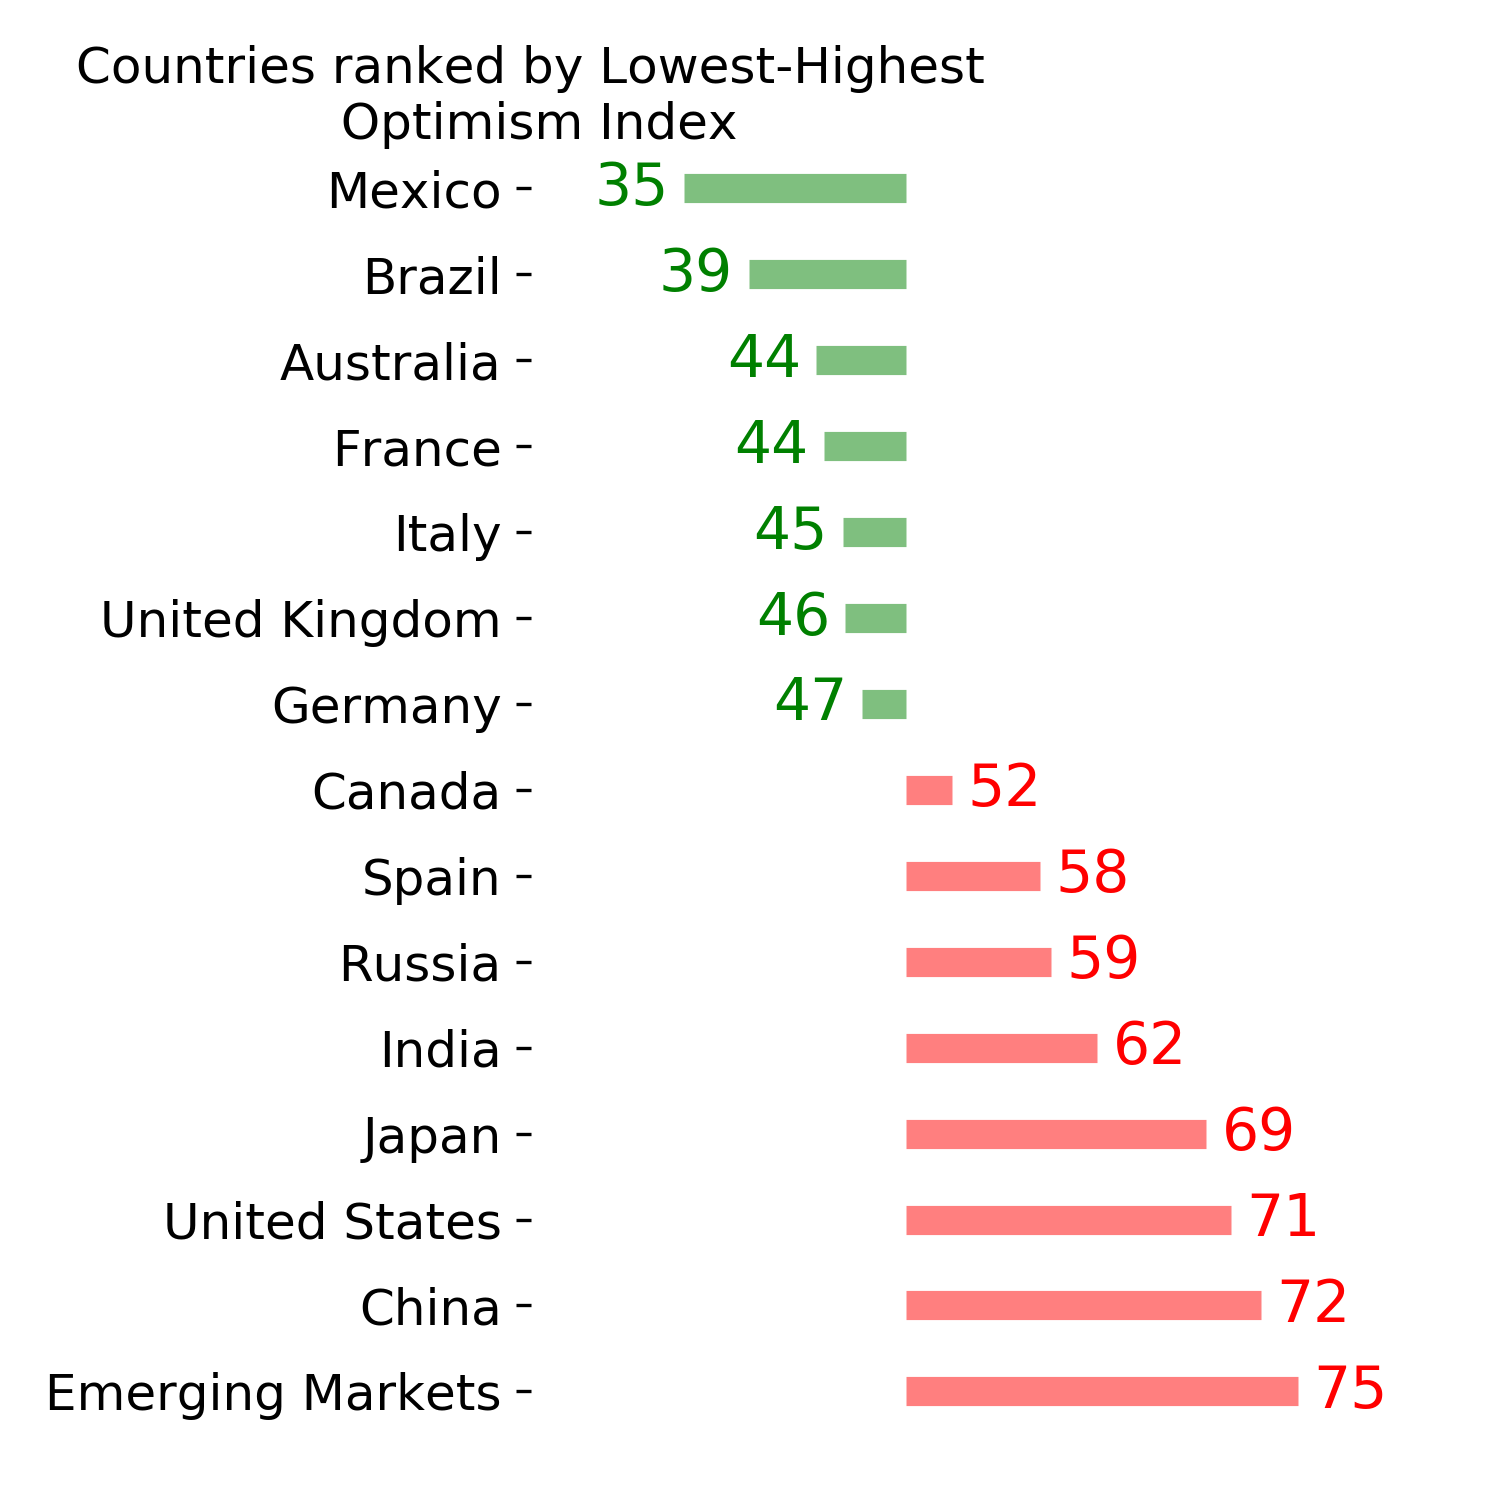
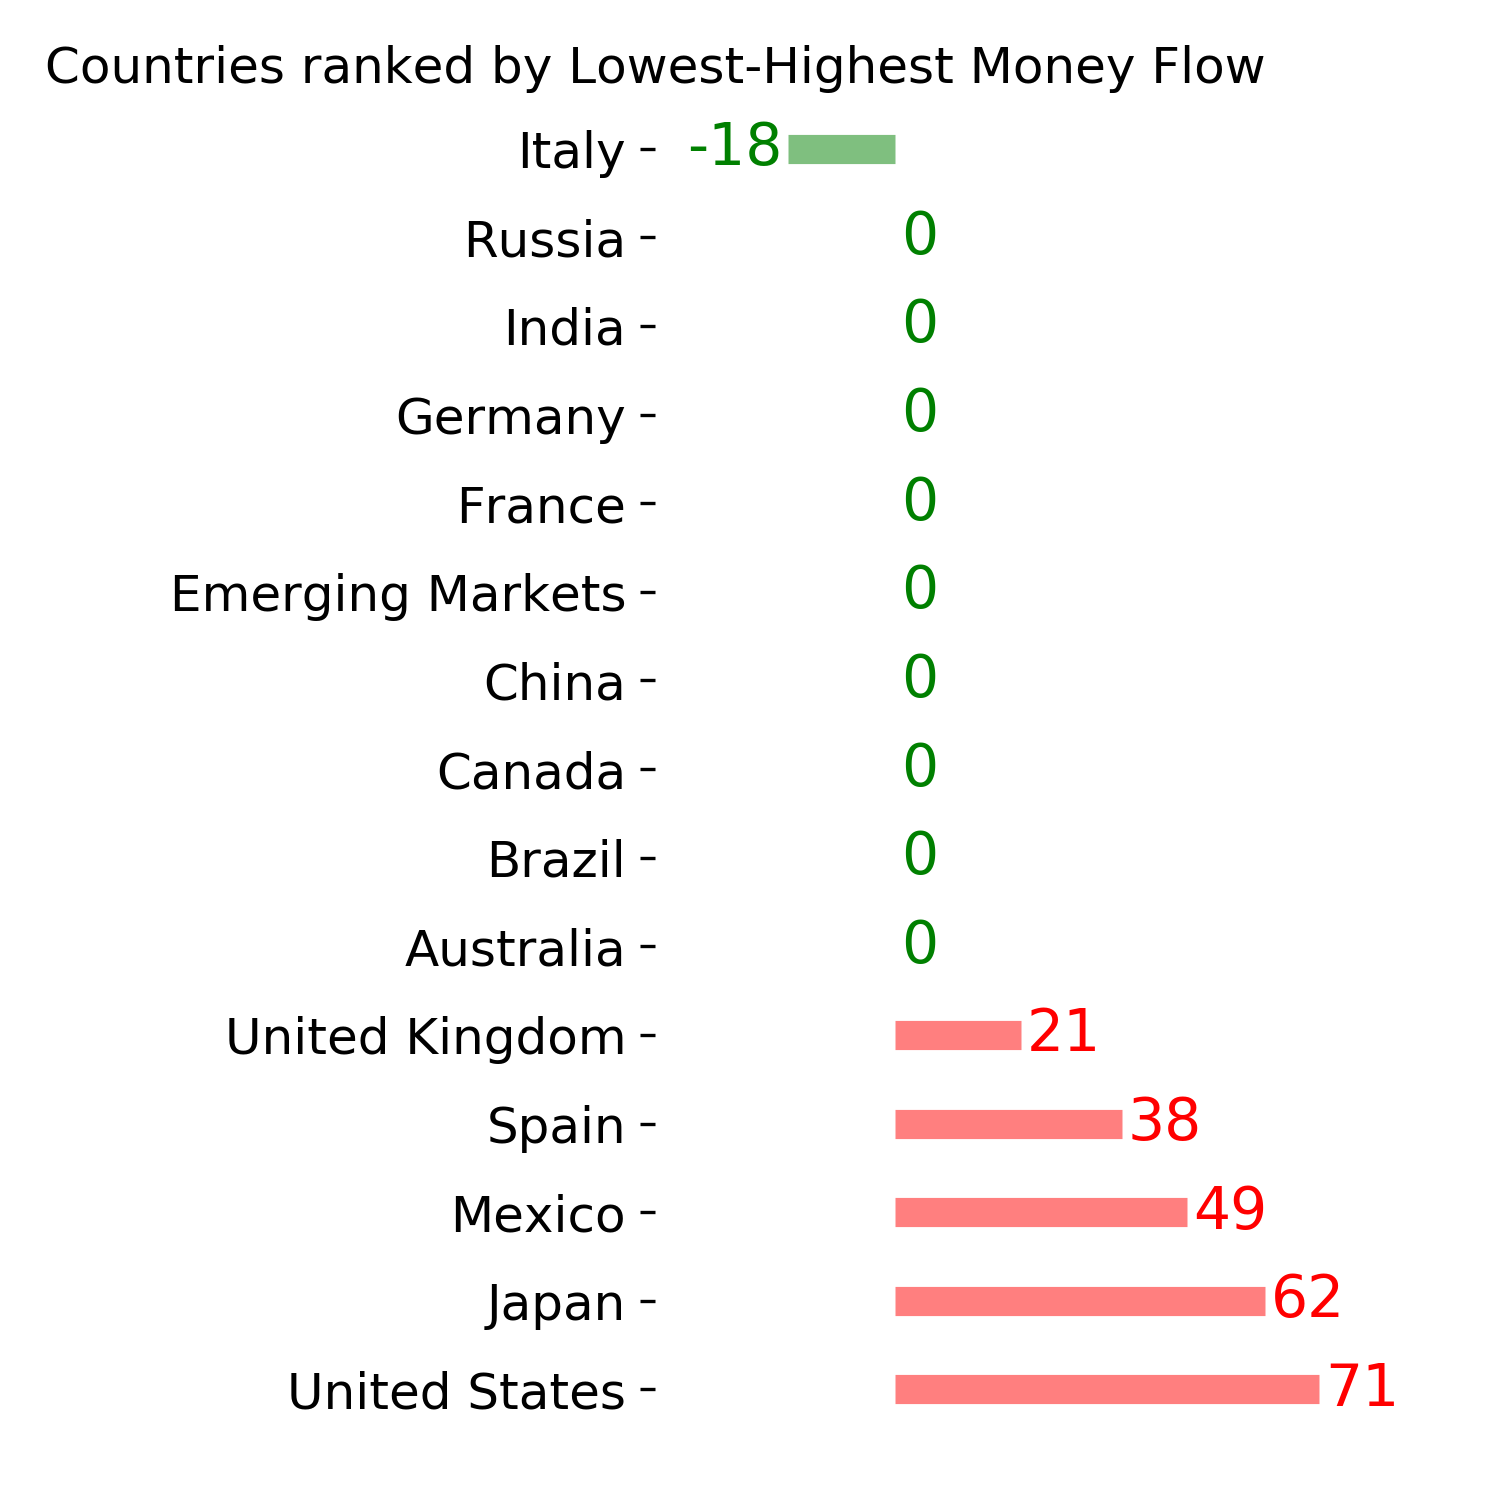
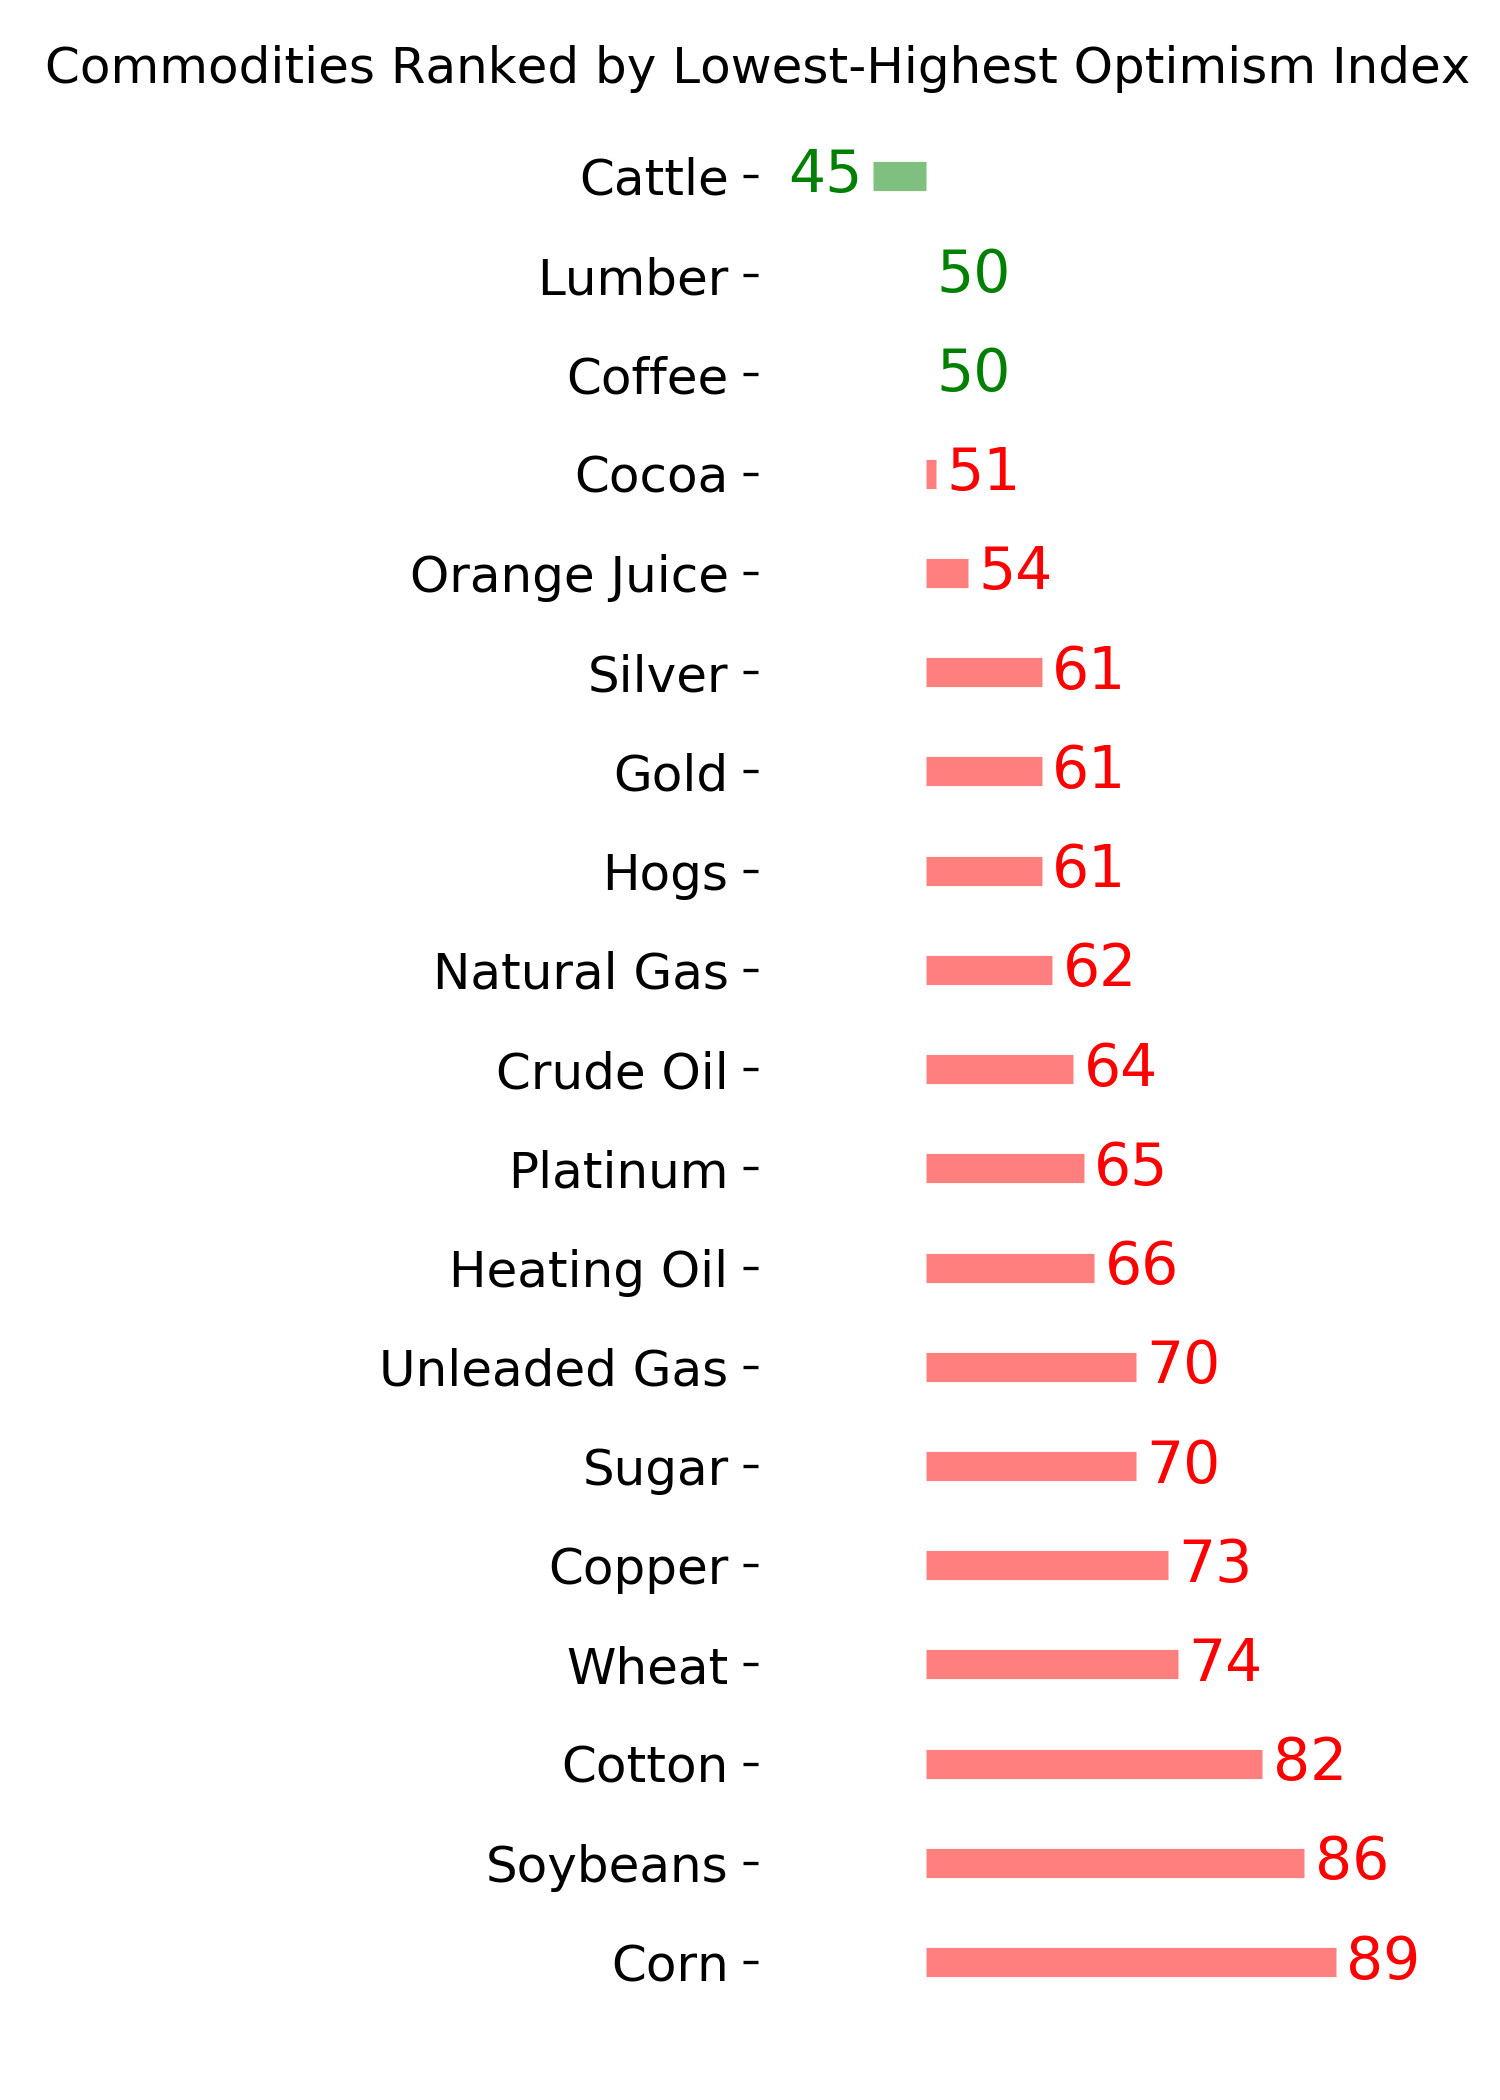
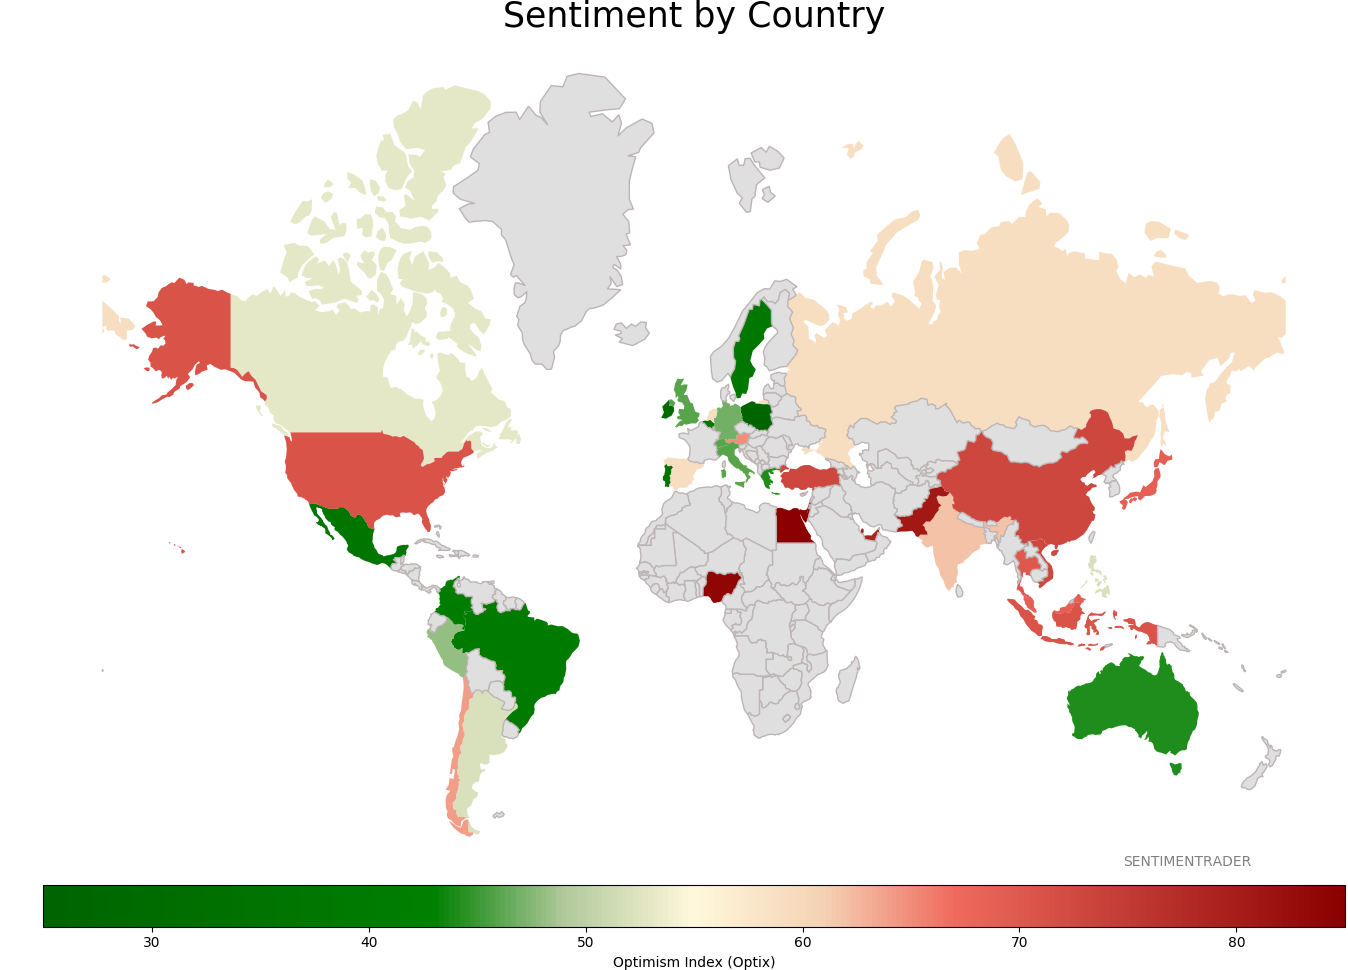
Sentiment Around The World
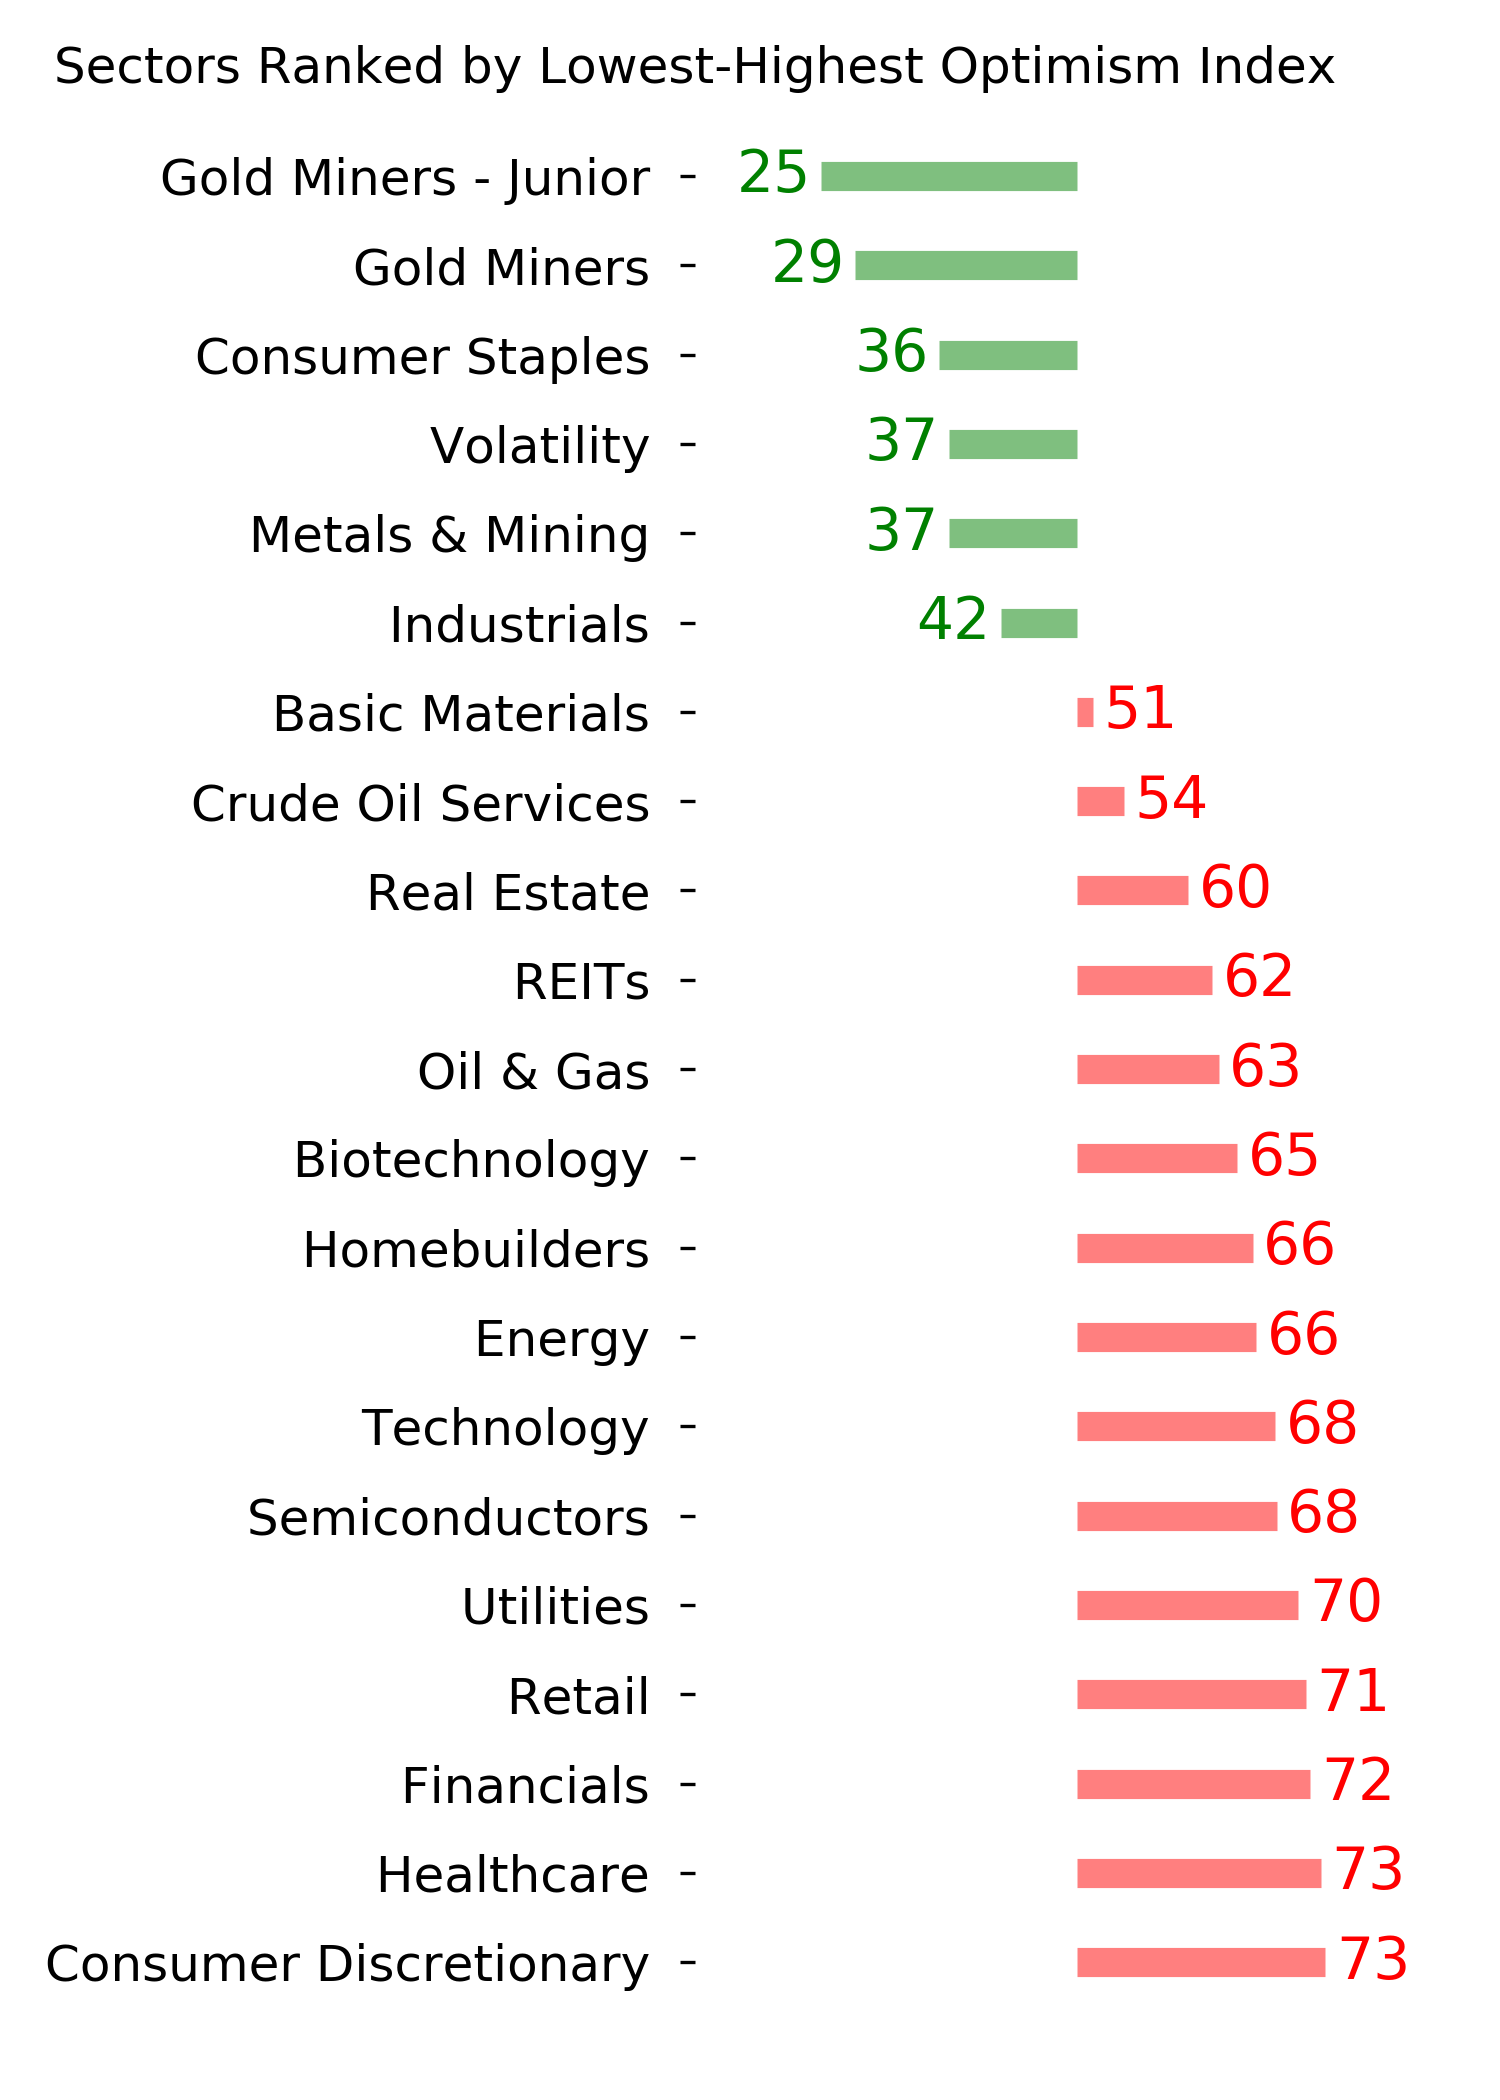
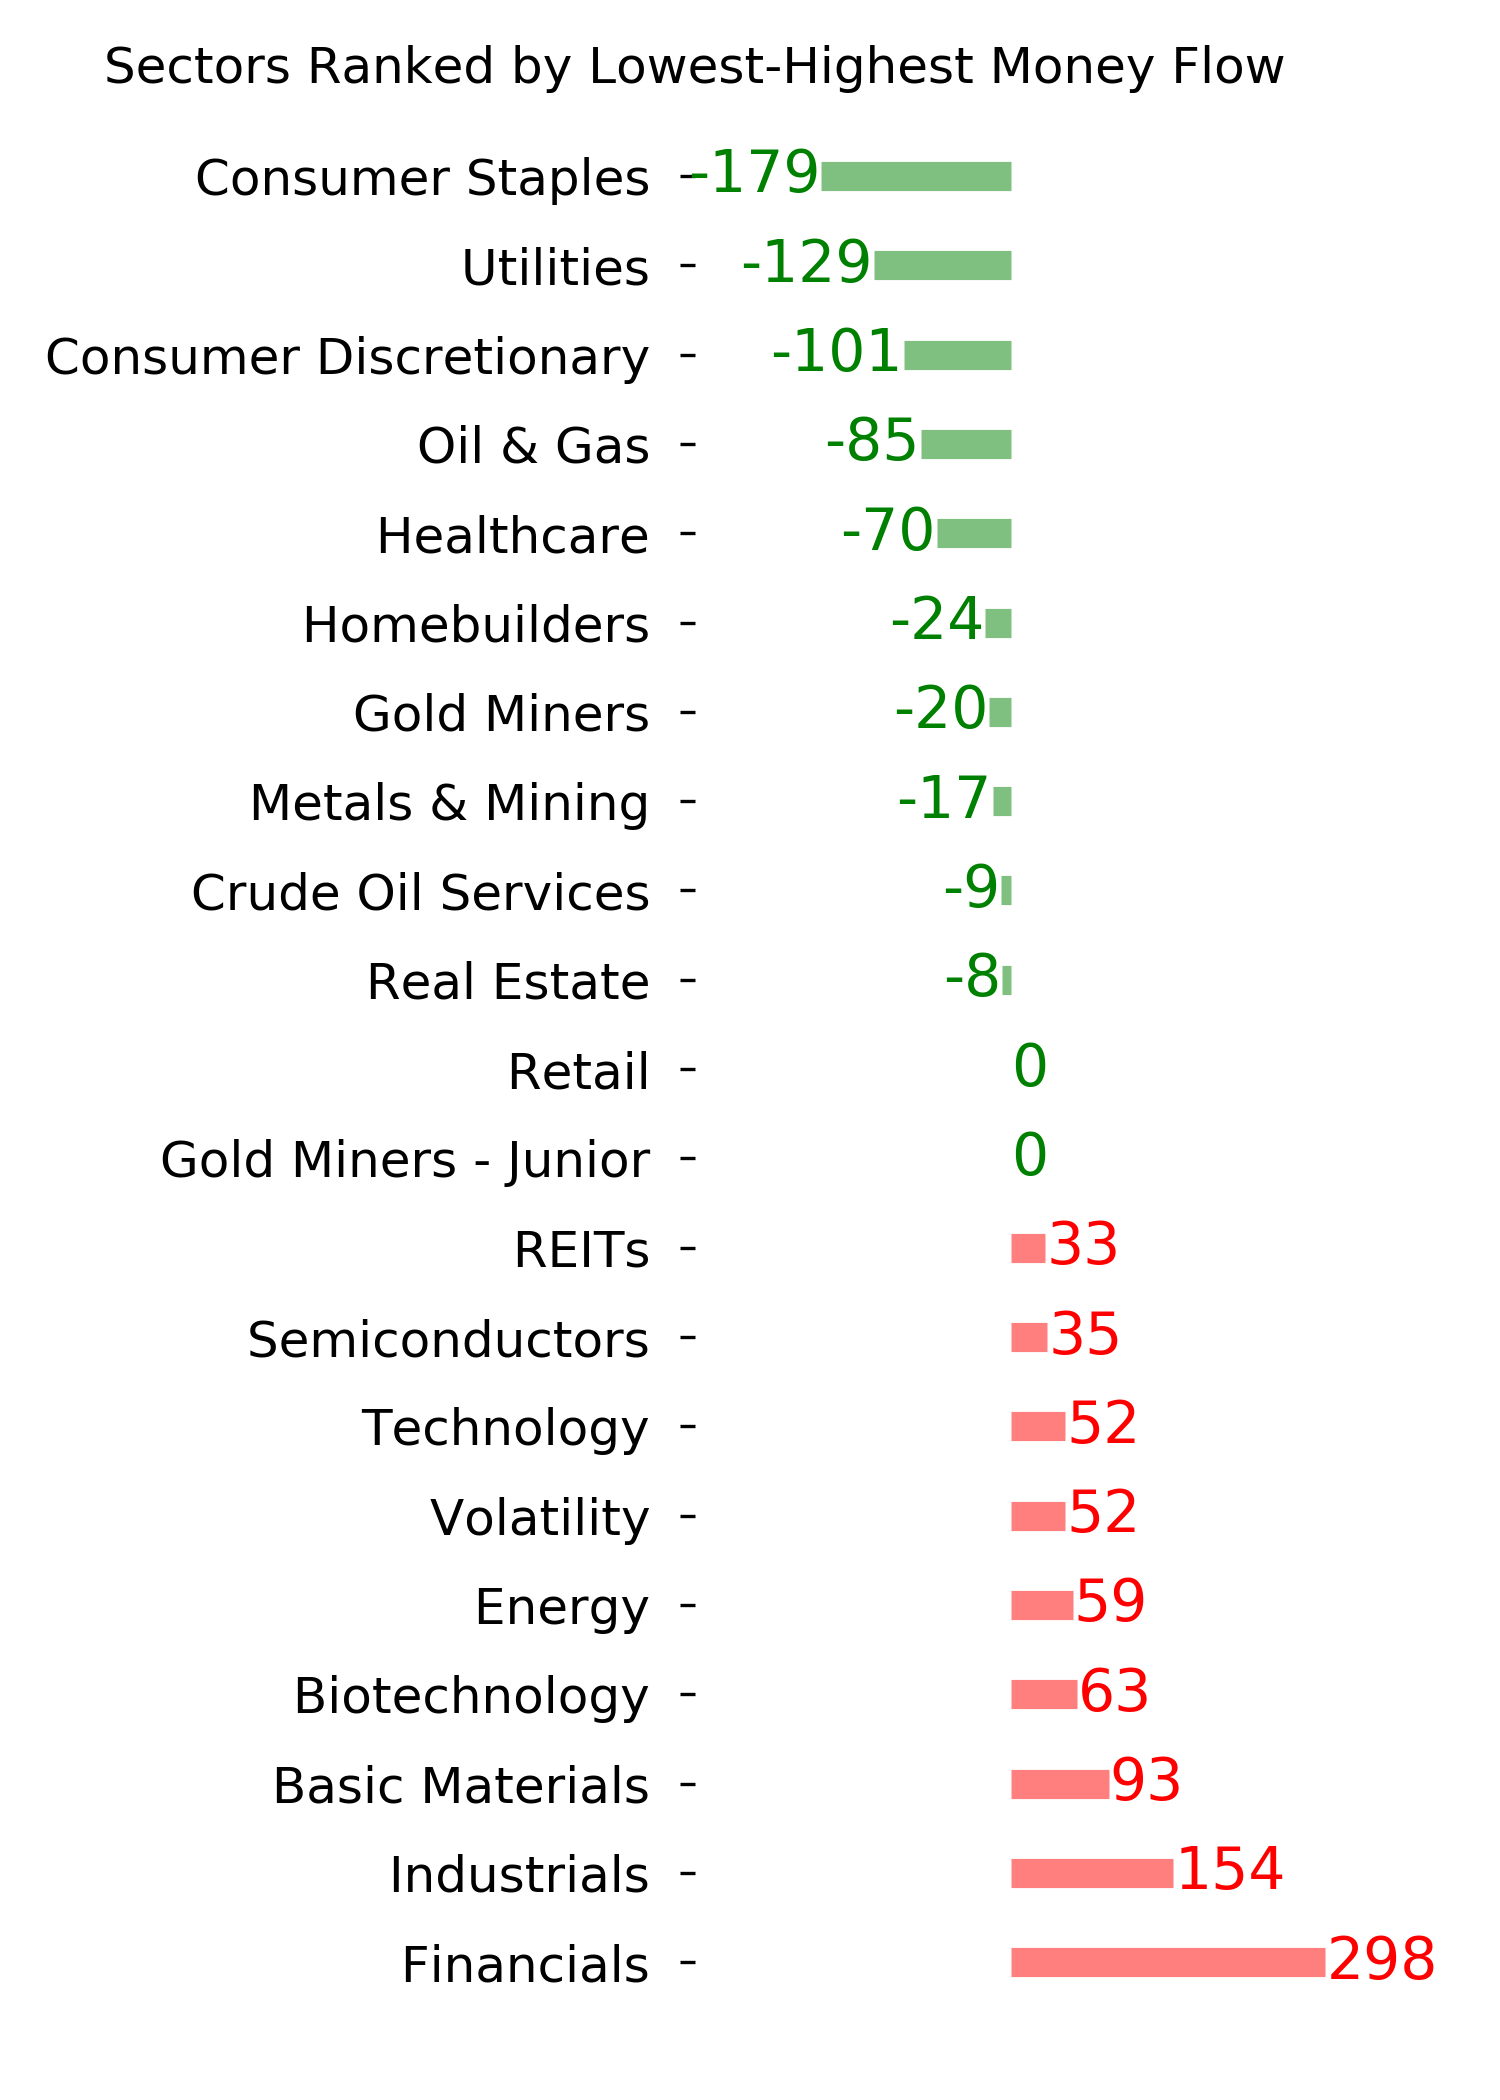
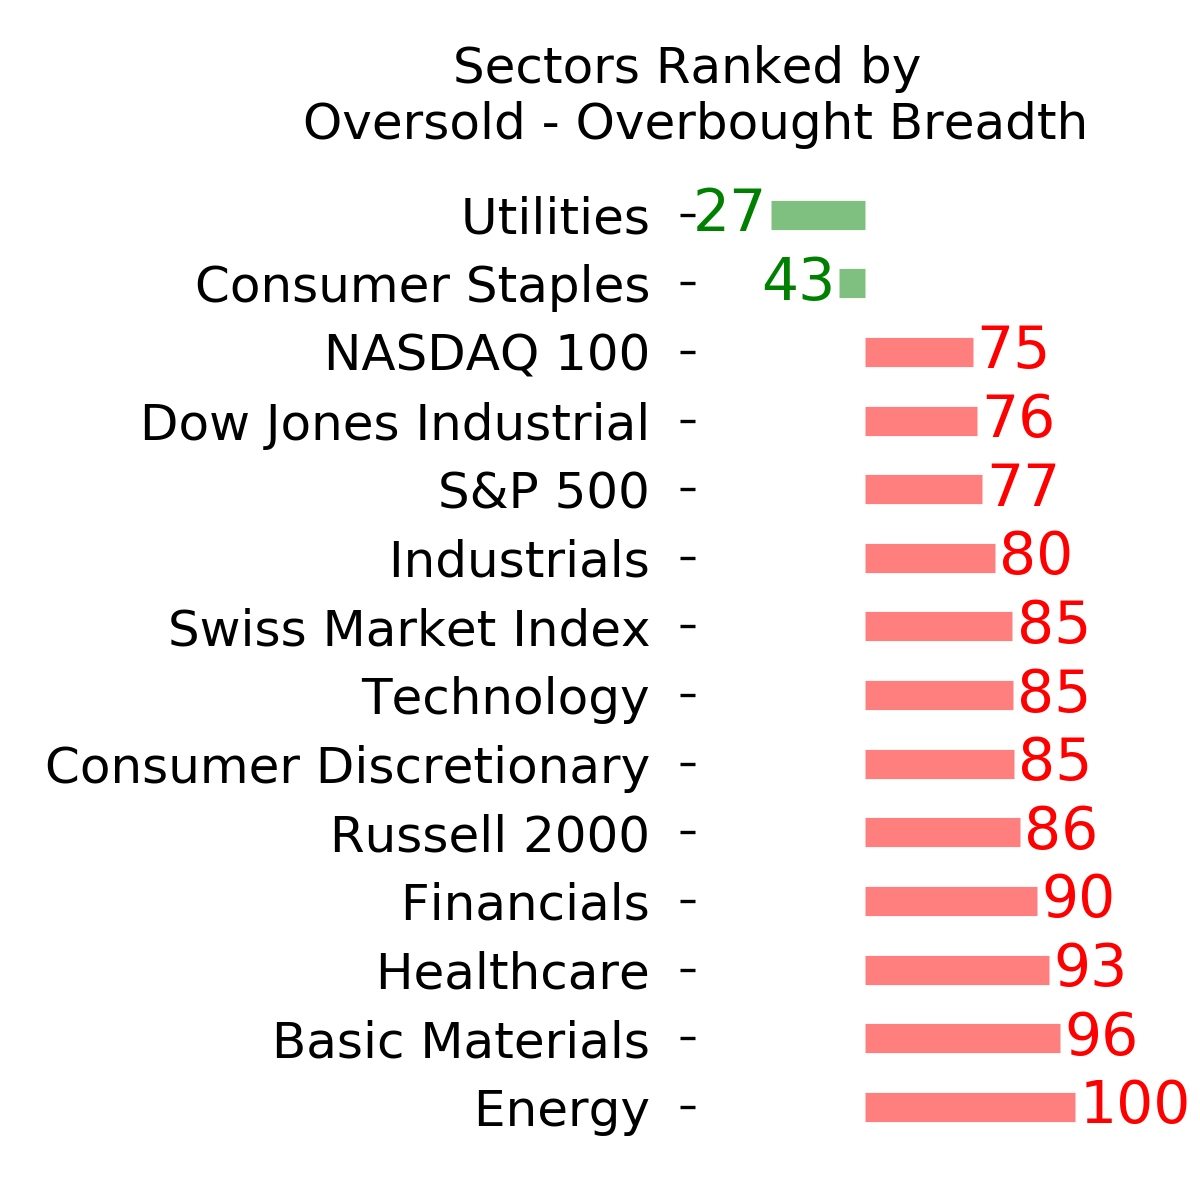
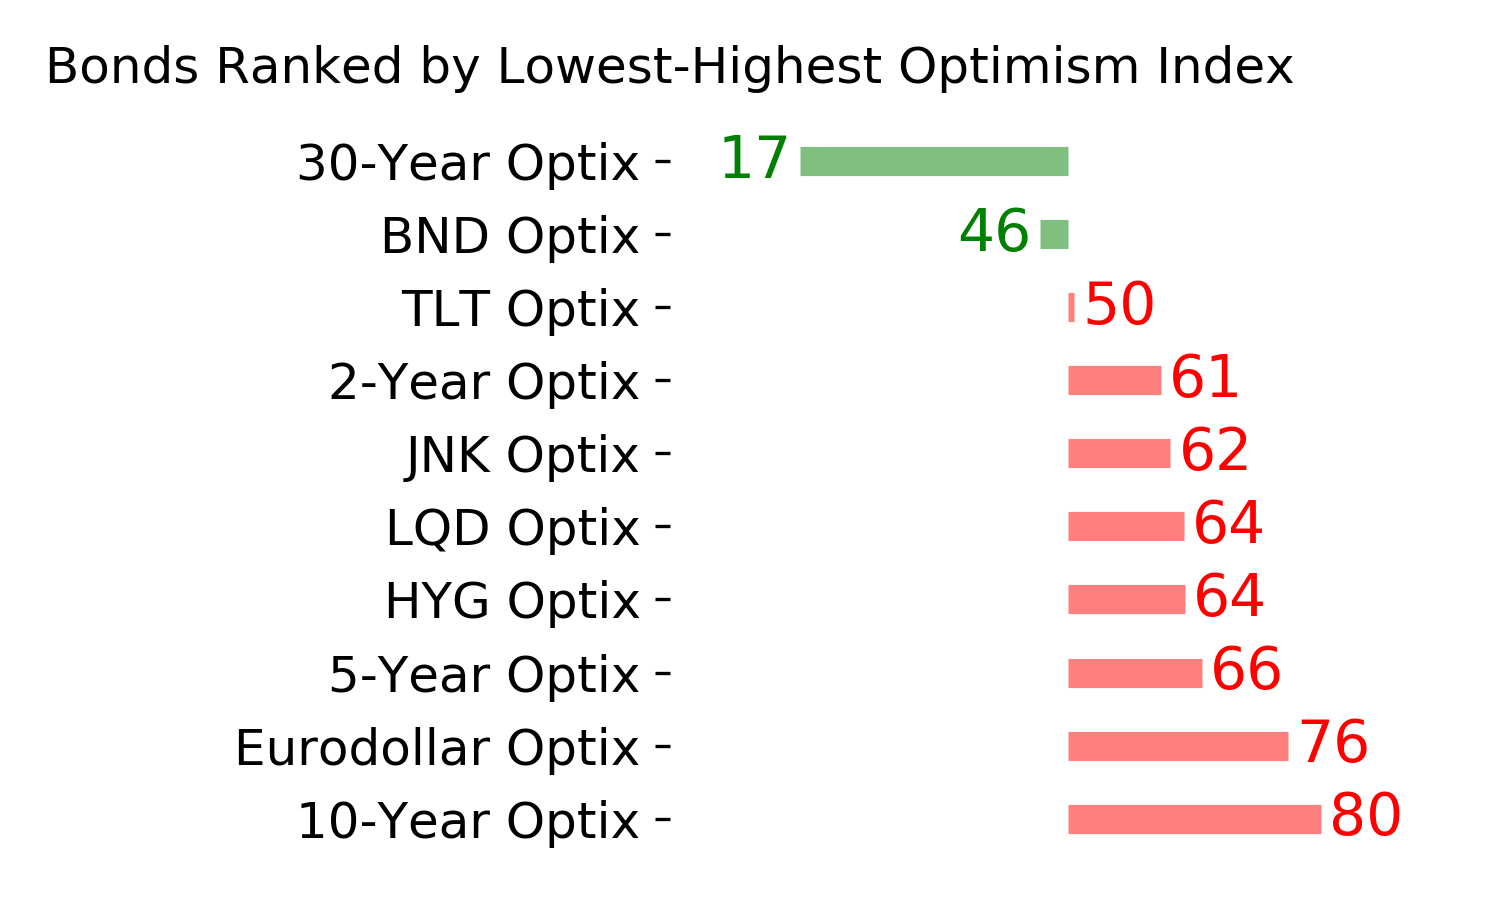
Optimism Index Thumbnails
|
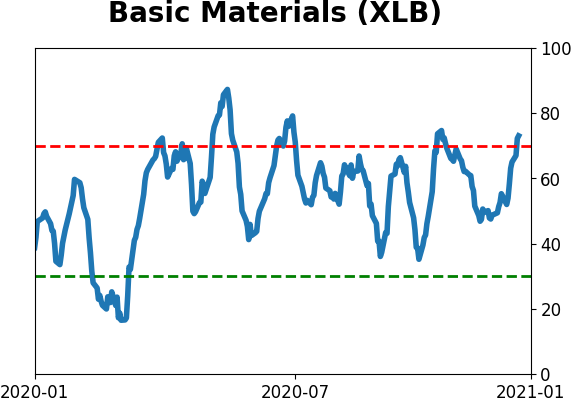
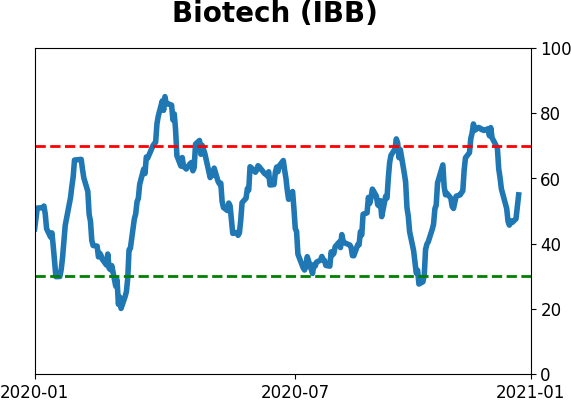
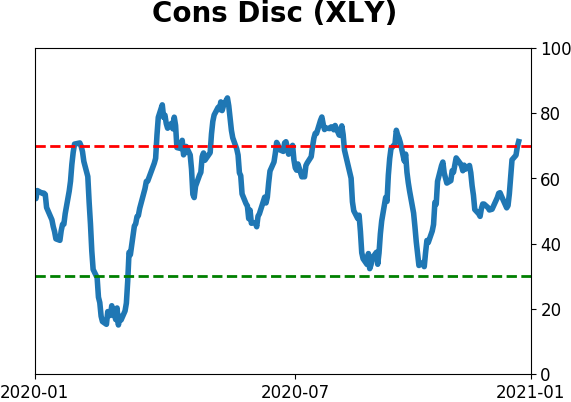
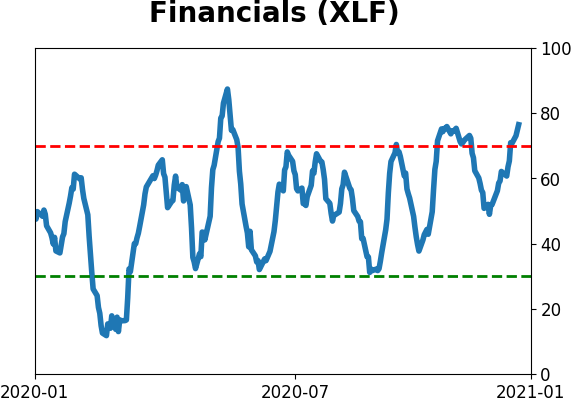
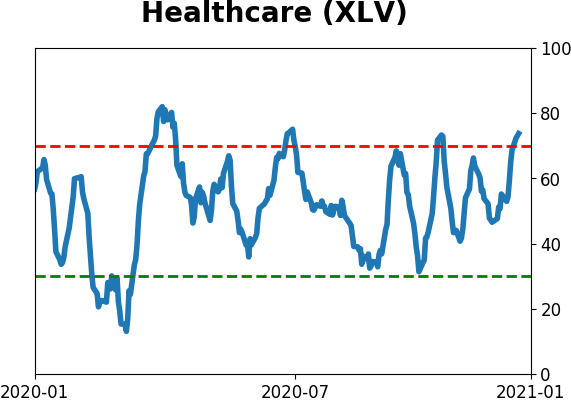
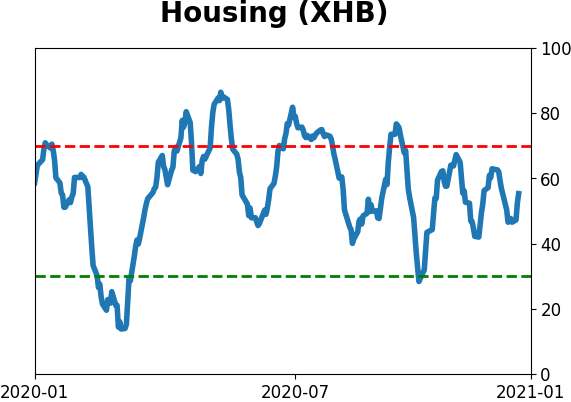
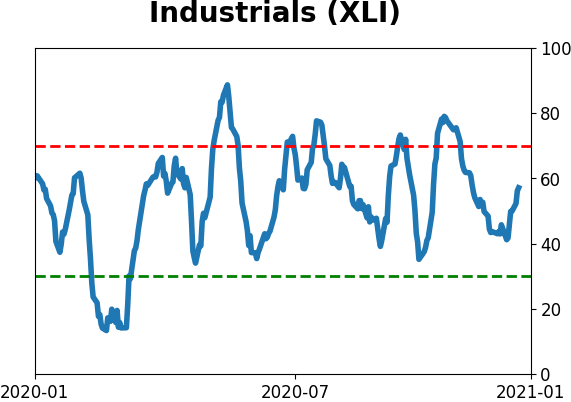
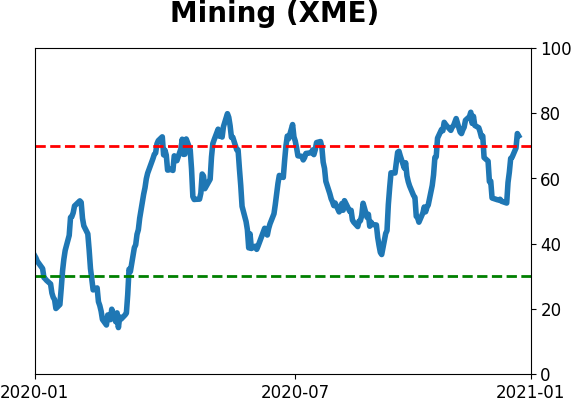
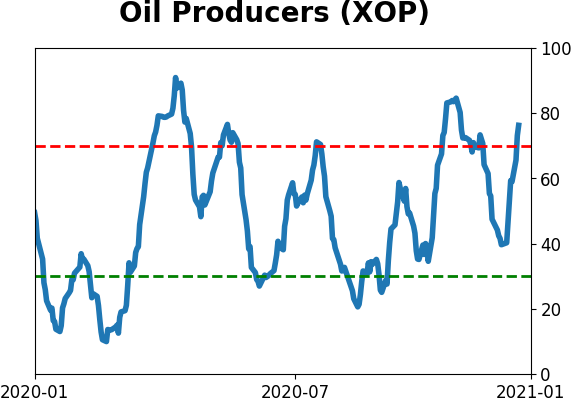
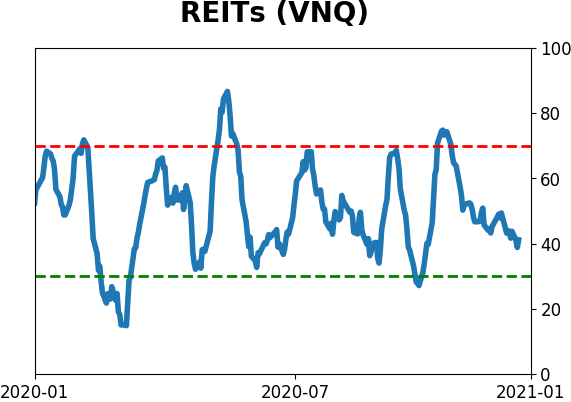
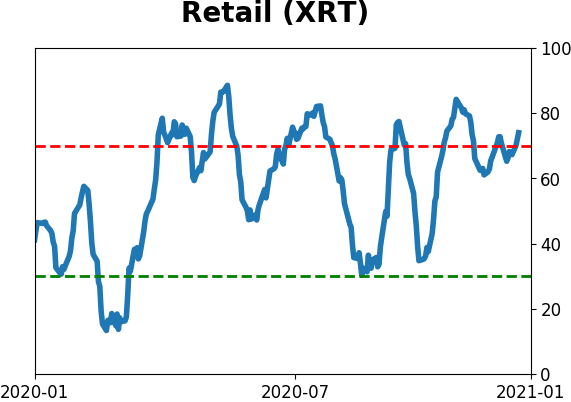
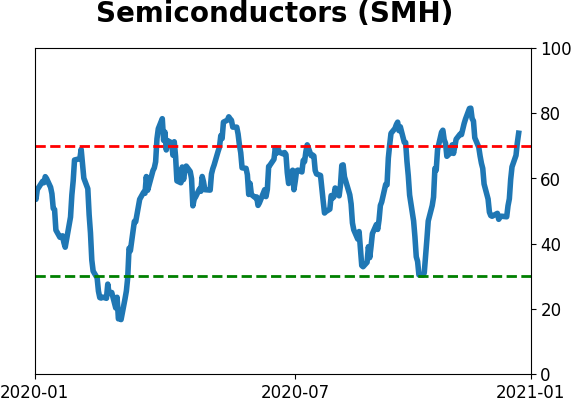
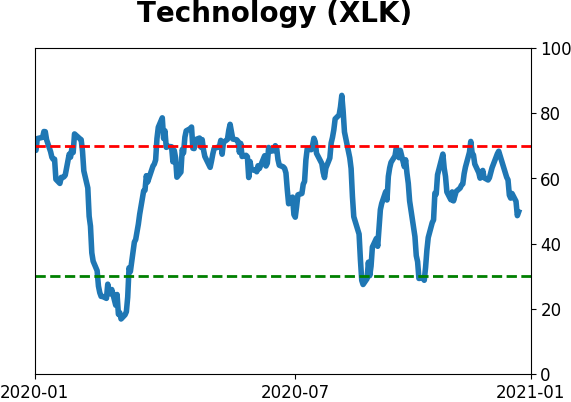
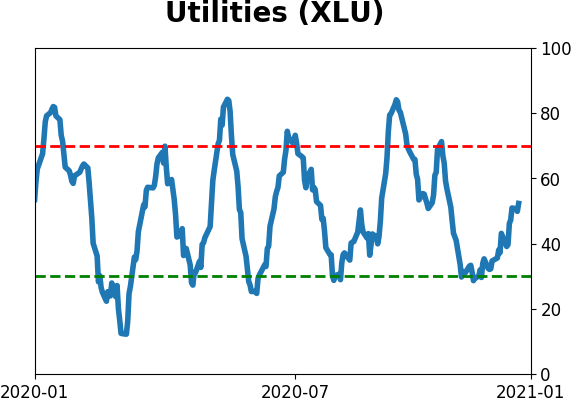
Sector ETF's - 10-Day Moving Average
|
|
|
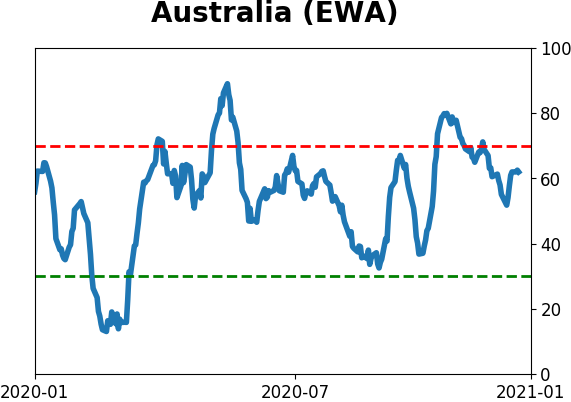
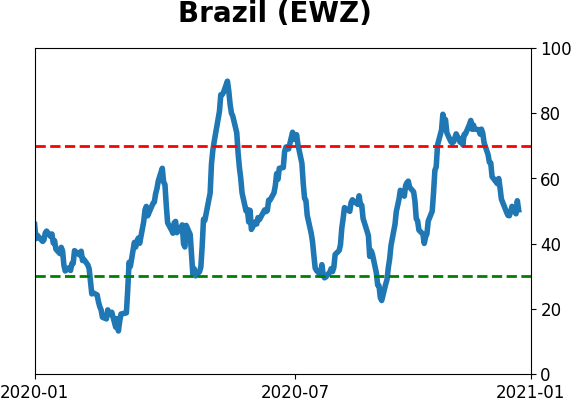
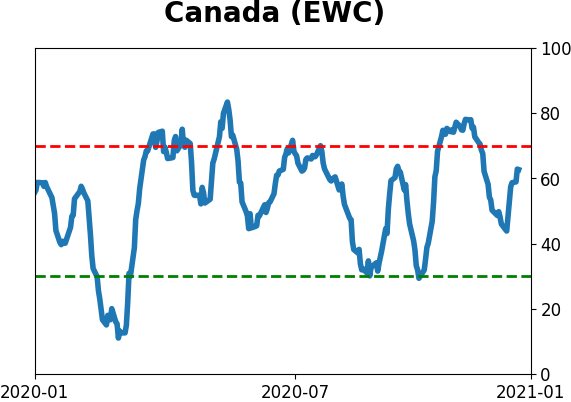
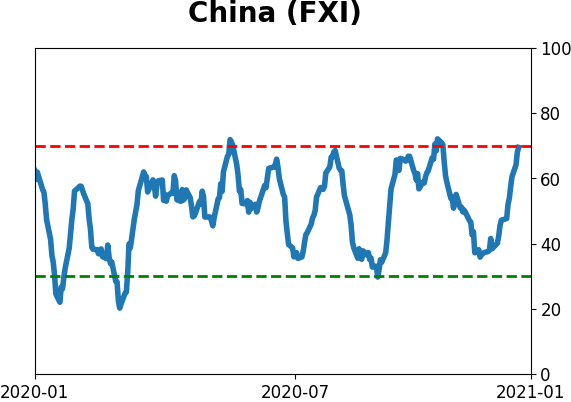
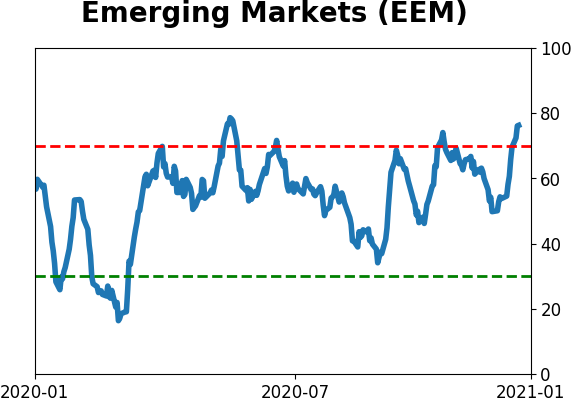
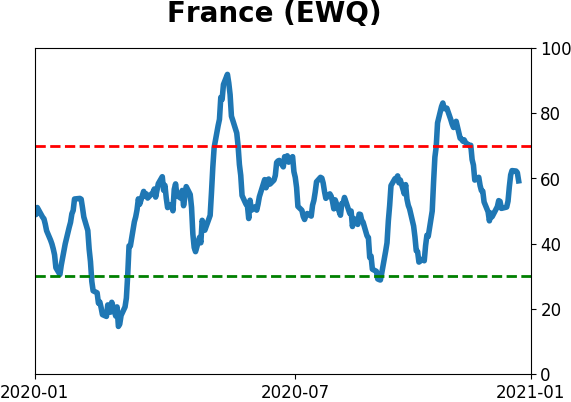
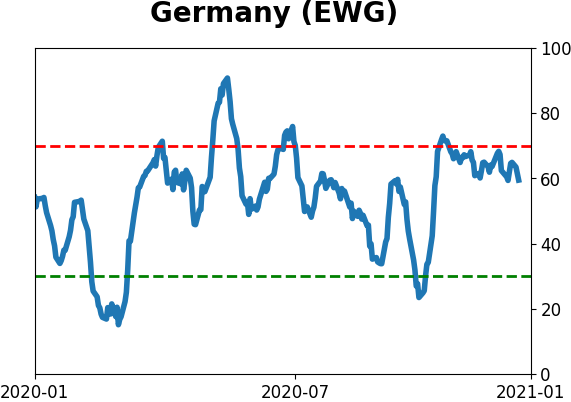
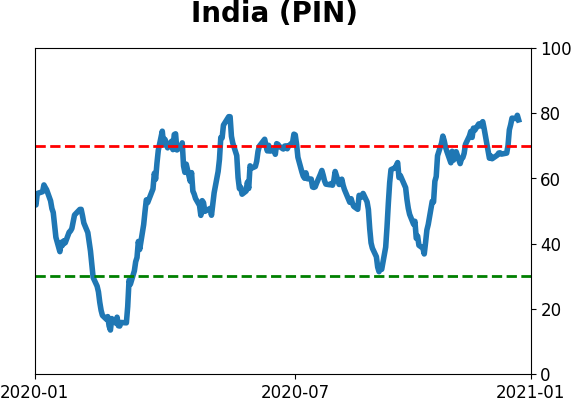
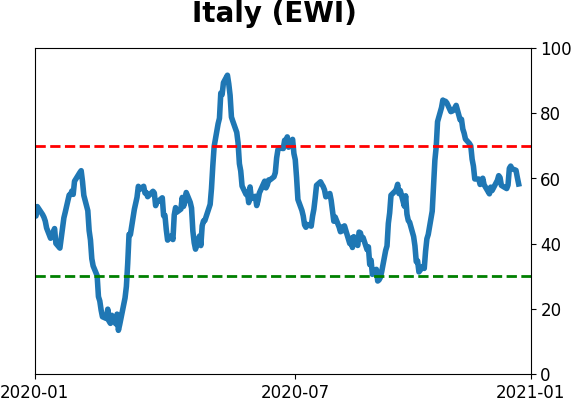
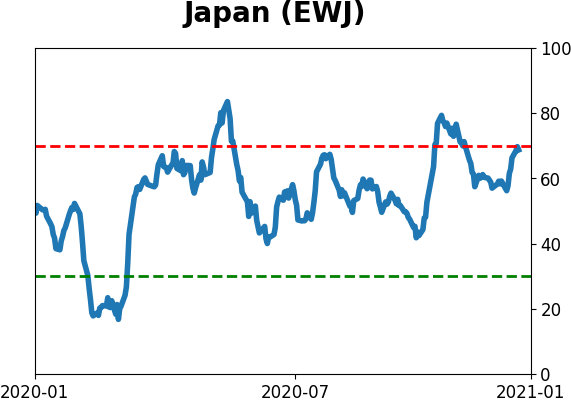
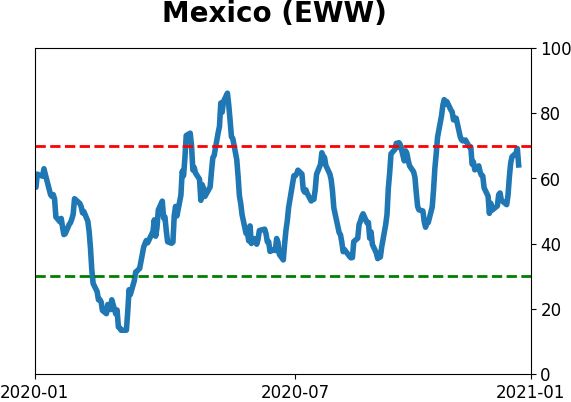
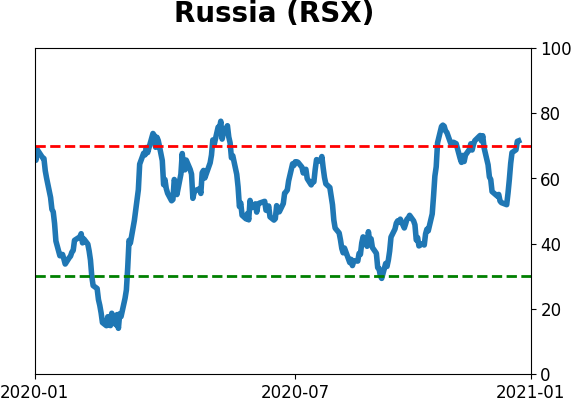
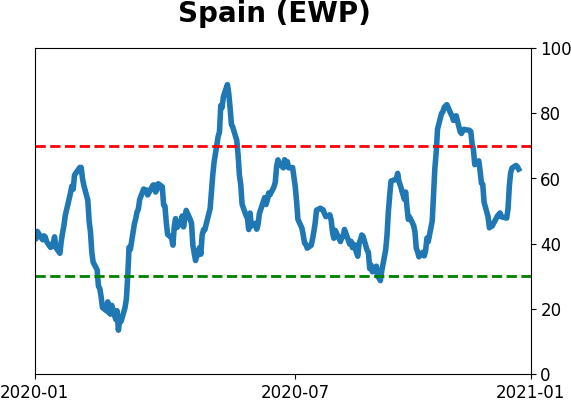
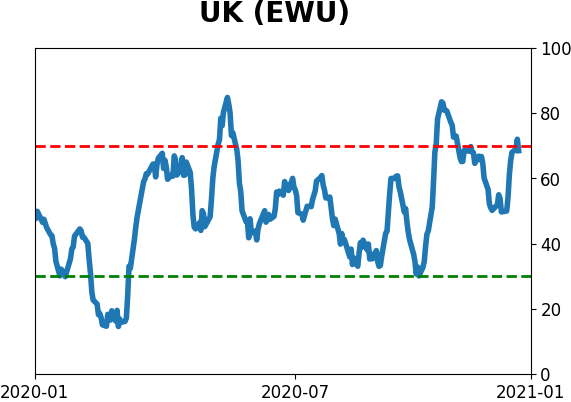
Country ETF's - 10-Day Moving Average
|
|
|
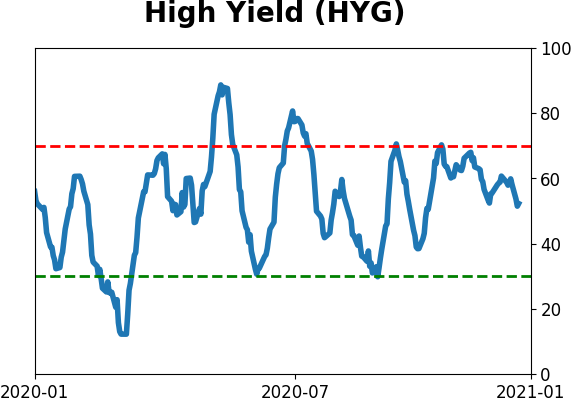
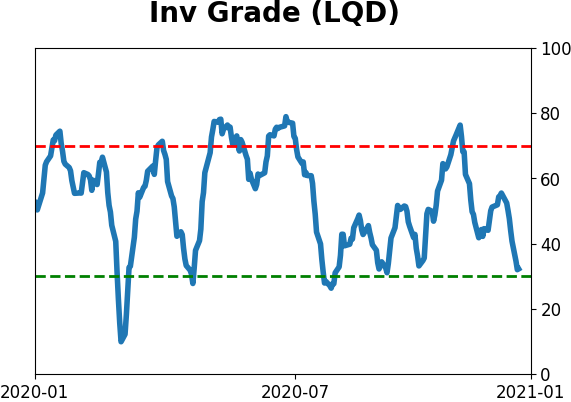
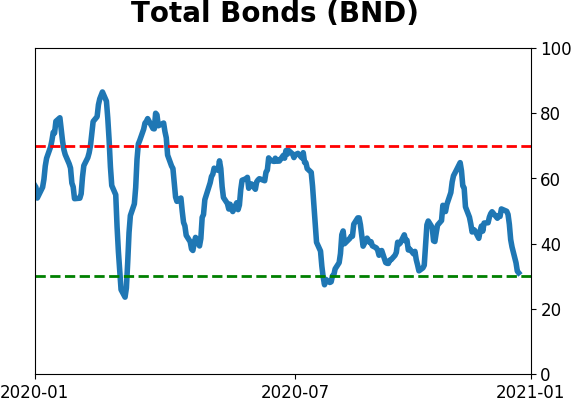
Bond ETF's - 10-Day Moving Average
|
|
|
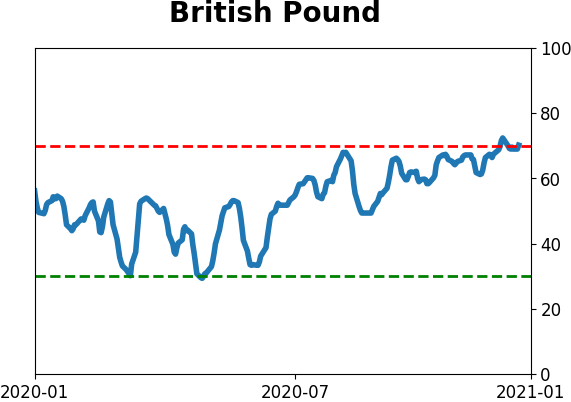
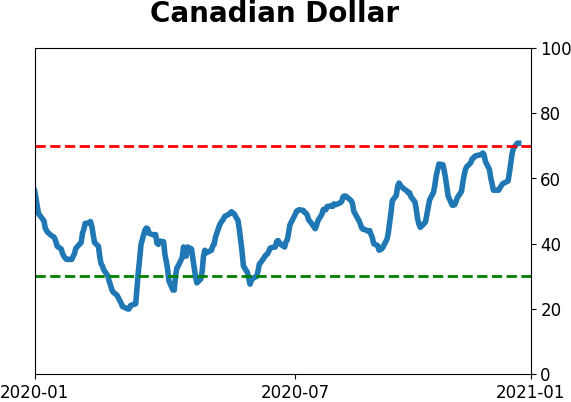
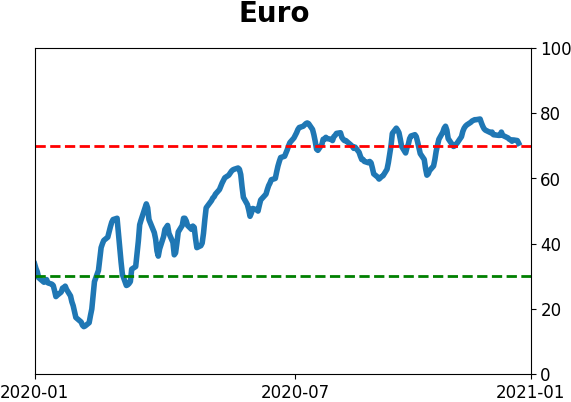
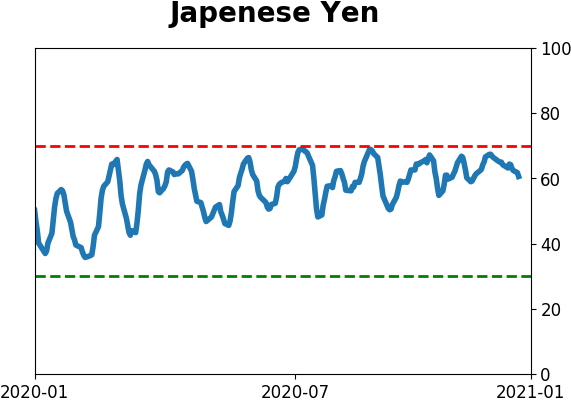
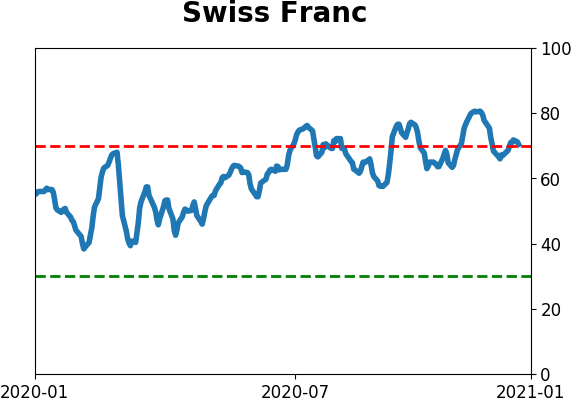
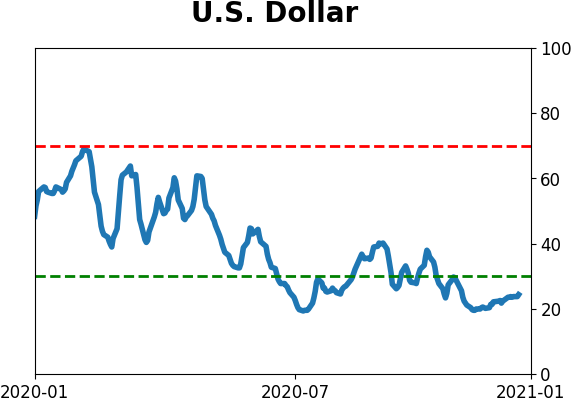
Currency ETF's - 5-Day Moving Average
|
|
|
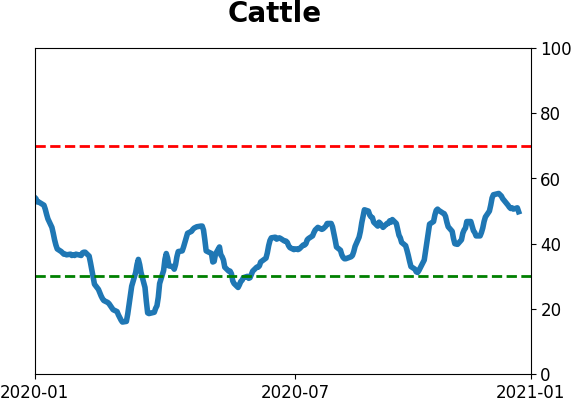
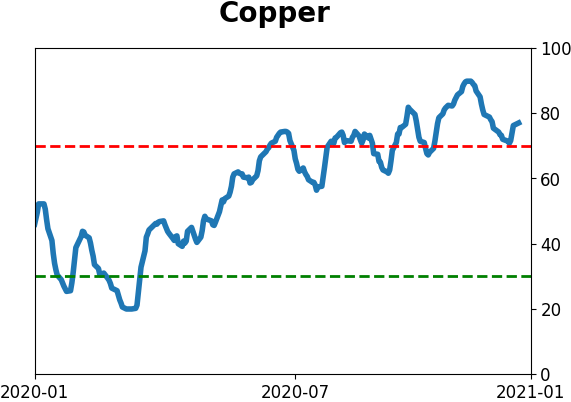
Commodity ETF's - 5-Day Moving Average
|
|