Headlines
|
|
As Treasuries tank, bets against them rise:
Sentiment on Treasury notes and bonds has soured significantly in recent weeks, and some indicators are starting to show extremes, though the overall bias is still about neutral. Fundamental data improvement hasn't been as negative for Treasuries as expected.
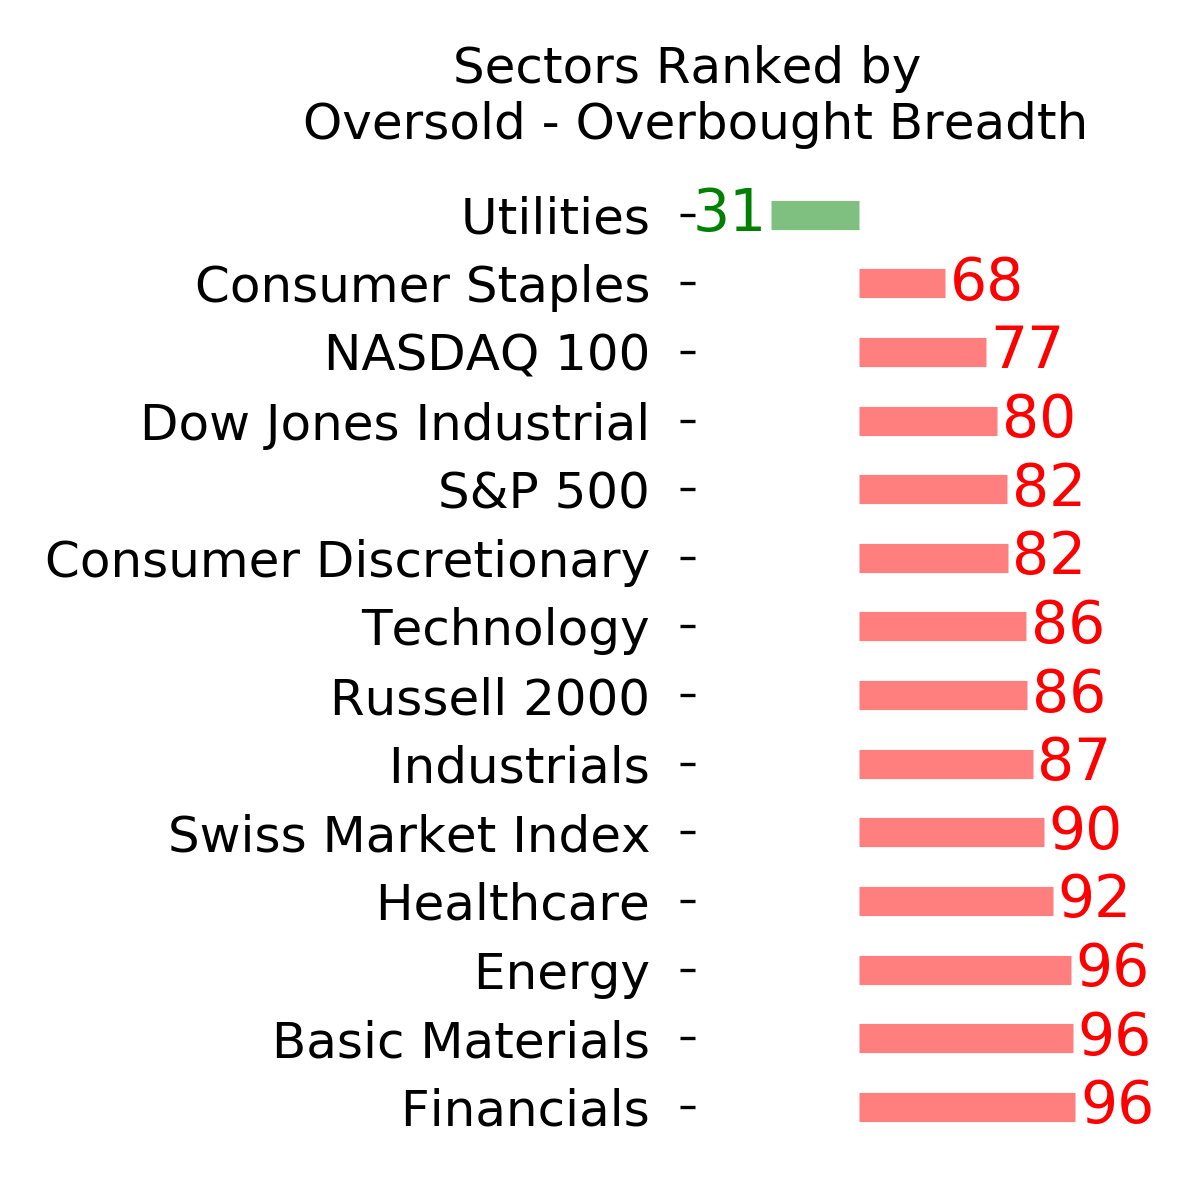
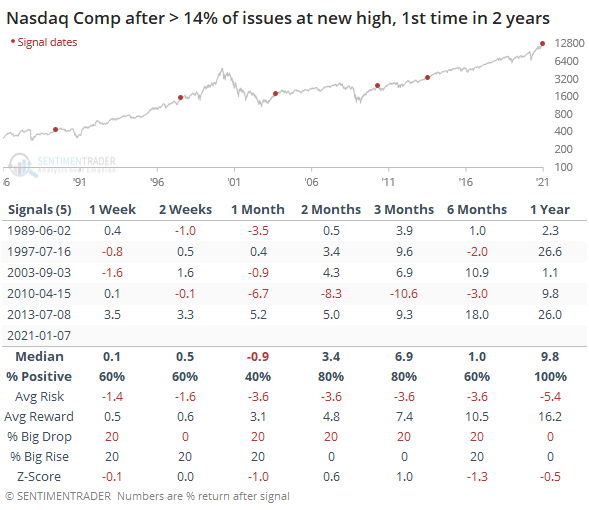
Bear market breakers: With the push in small-cap stocks, breadth across the exchanges has improved dramatically this week. On Wednesday, more than 12% of securities on the NYSE and Nasdaq managed to hit a 52-week high, the most in more than 2 years. There have been five other times it has crossed this threshold after at least 2 years - following the ends of bear markets in 1970, 1987, 1994, 2002, and 2008. A year later, the S&P 500 was higher by an average of more than 12%. We'll have more details about the implications on Friday. On the Nasdaq alone, more than 14% of issues hit a new high on Thursday, the most in 3 years.
Bottom Line:
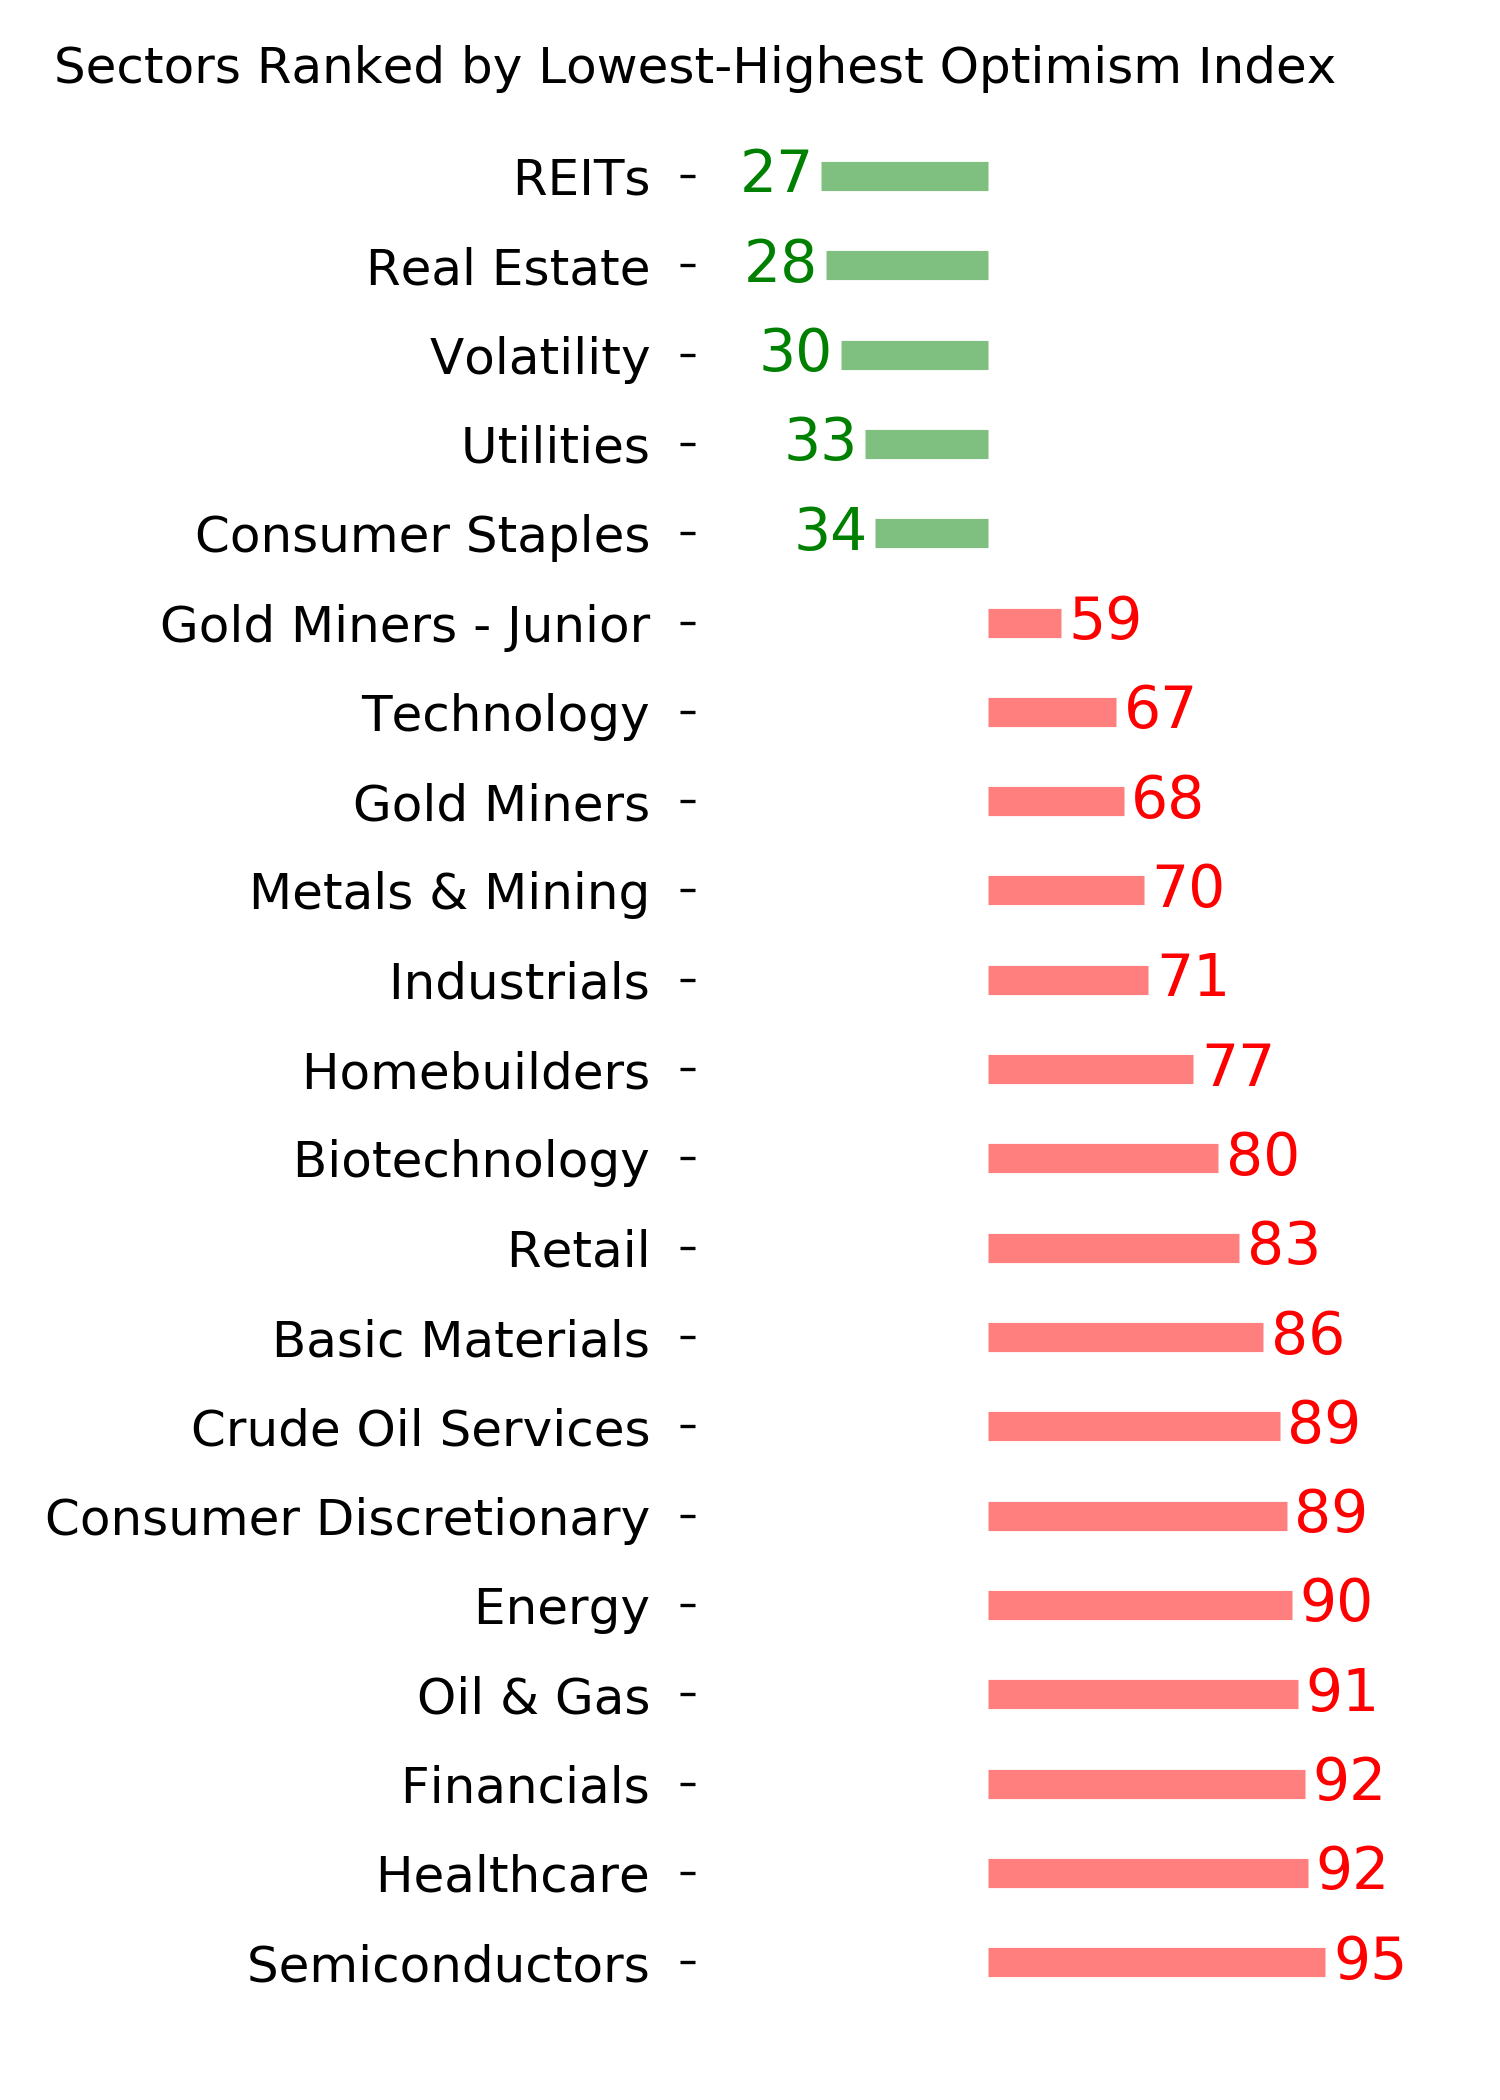
- The market environment is pristine, but with near-historic optimism, gains tend to be muted, with a high probability of being reversed at some point over the ensuing weeks.
|
Smart / Dumb Money Confidence
|
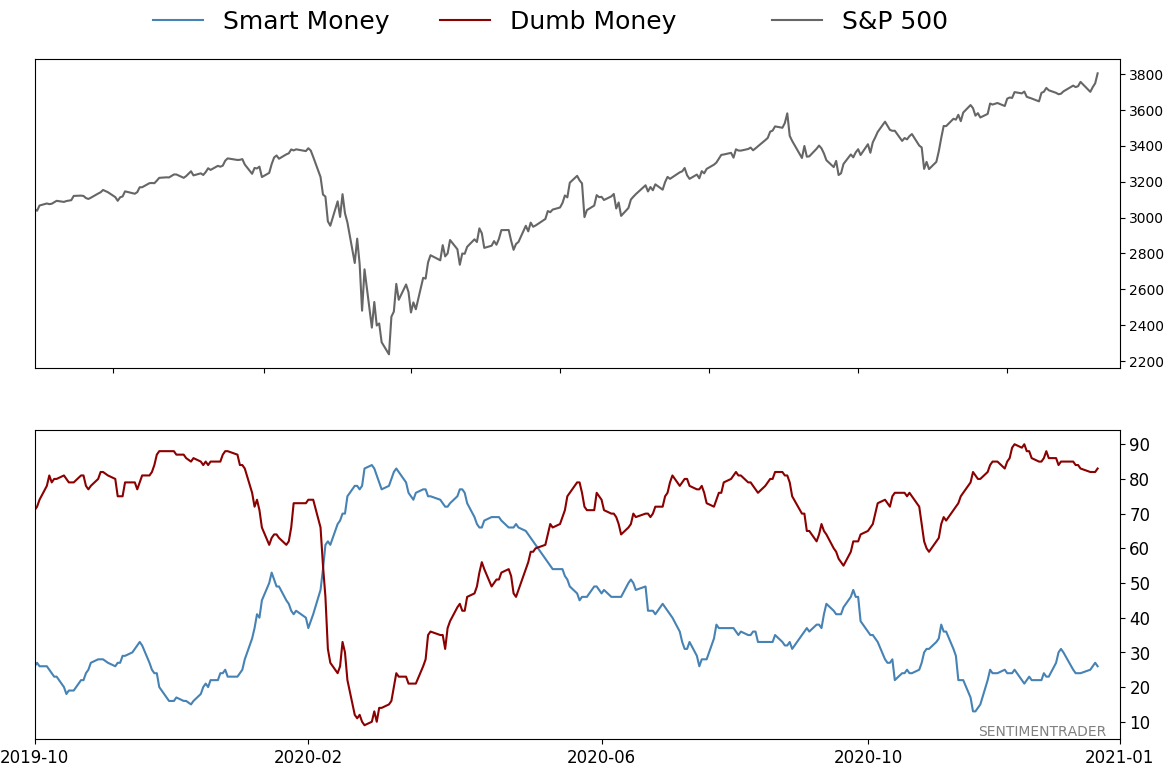
Smart Money Confidence: 26%
Dumb Money Confidence: 83%
|
|
Risk Levels
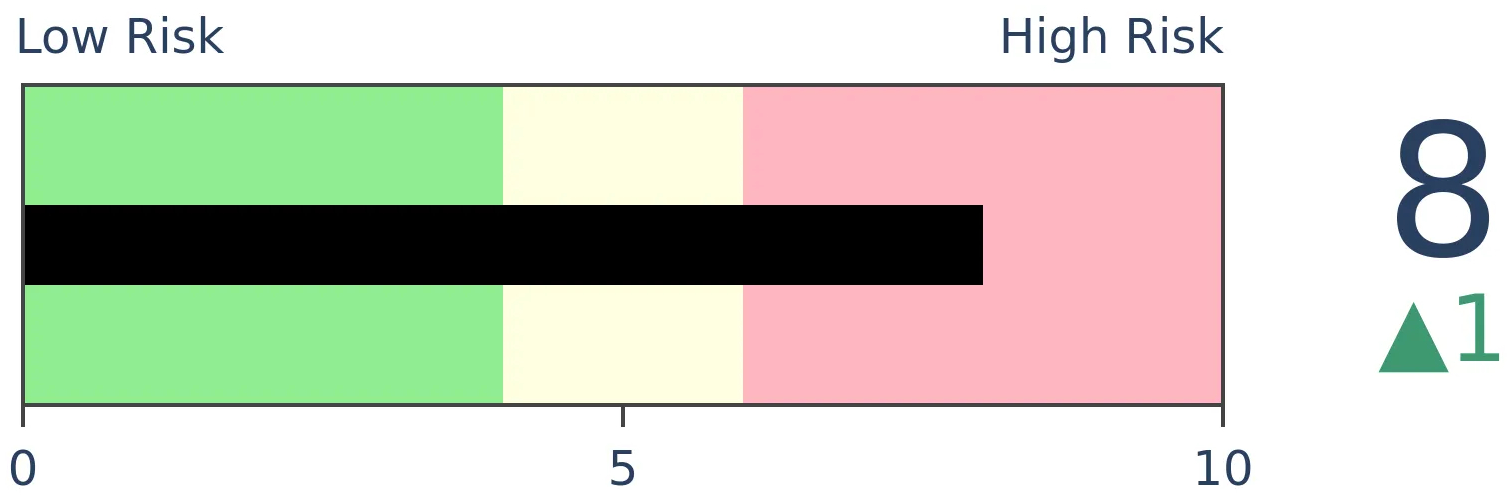
Stocks Short-Term
|
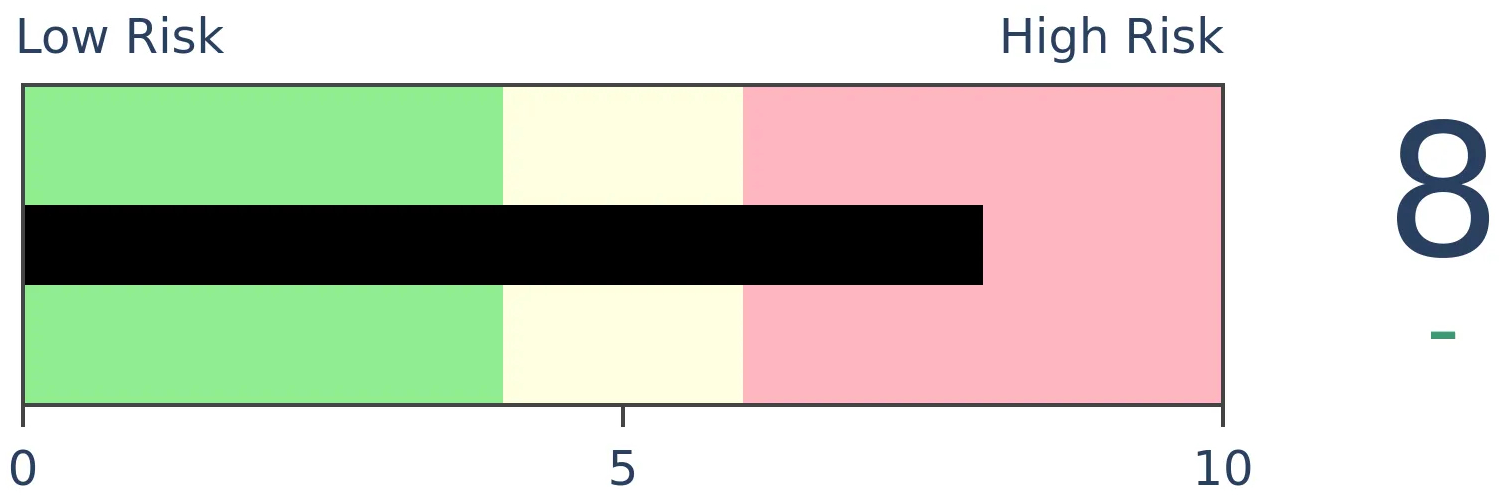
Stocks Medium-Term
|
|
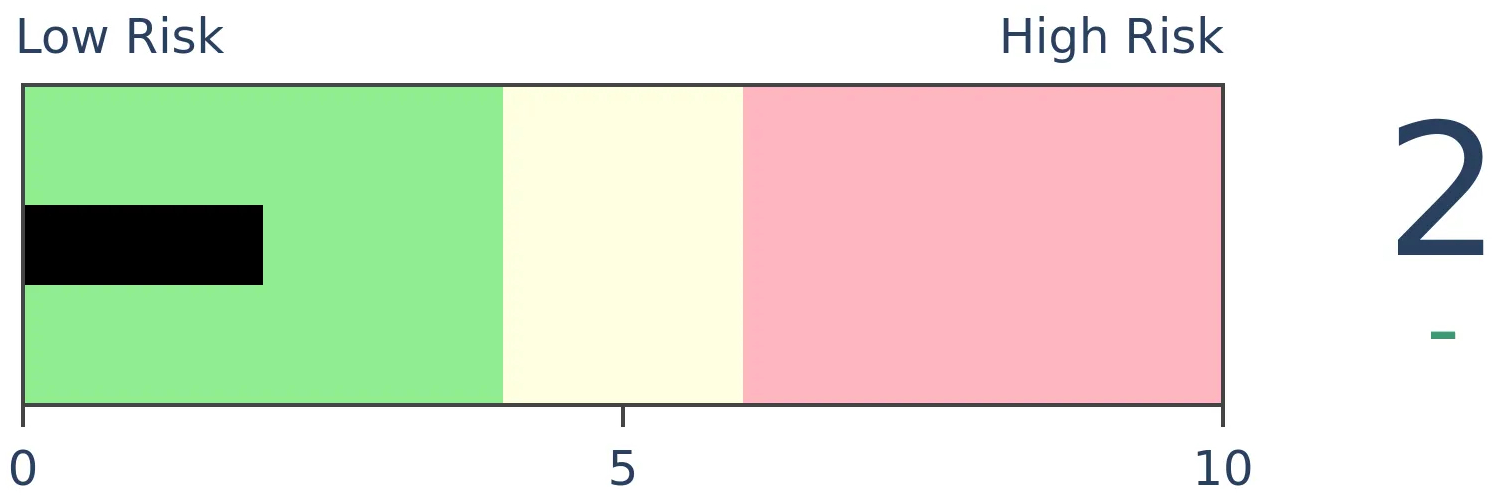
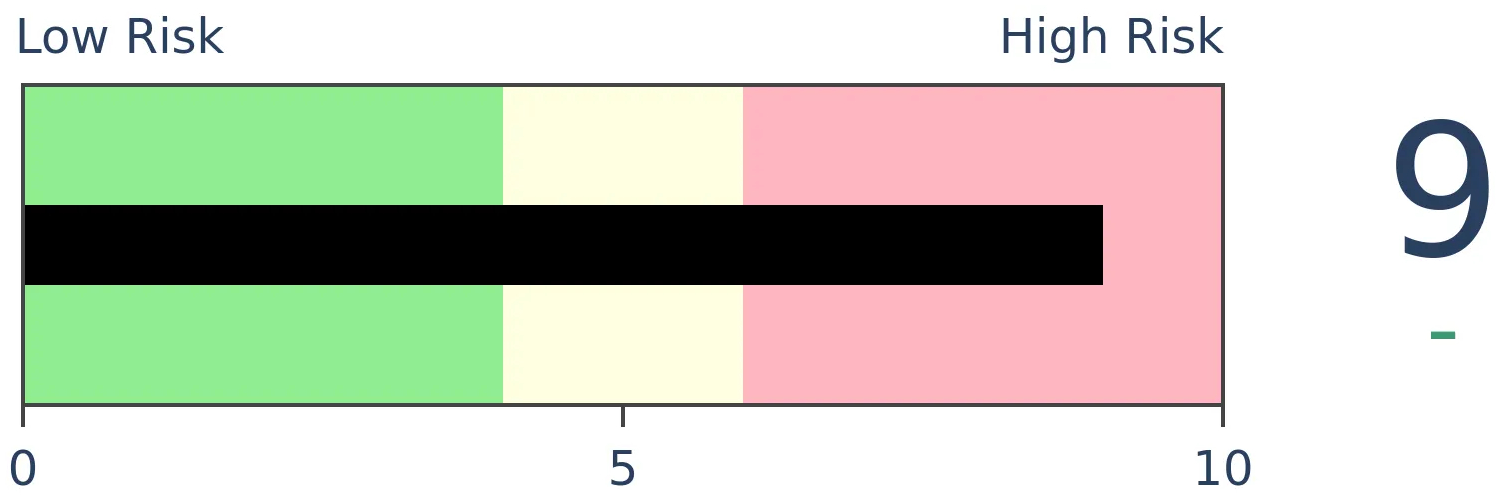
Bonds
|
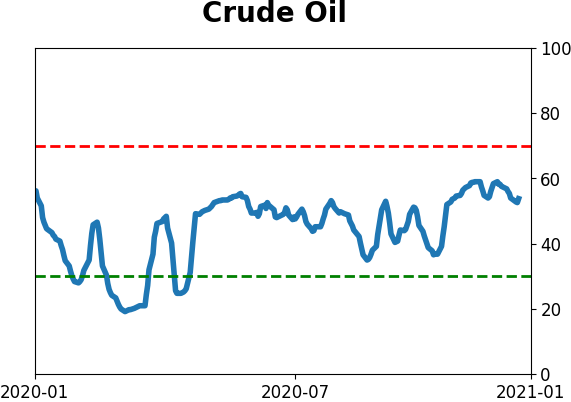
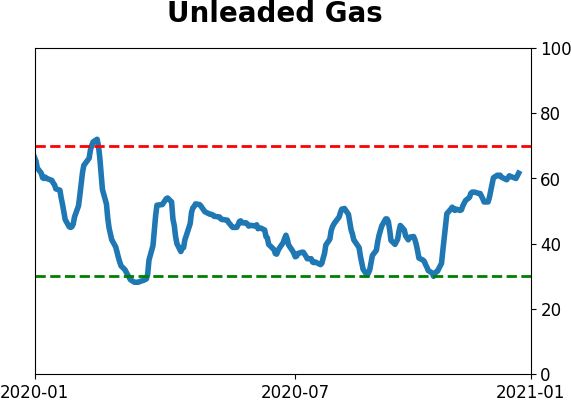
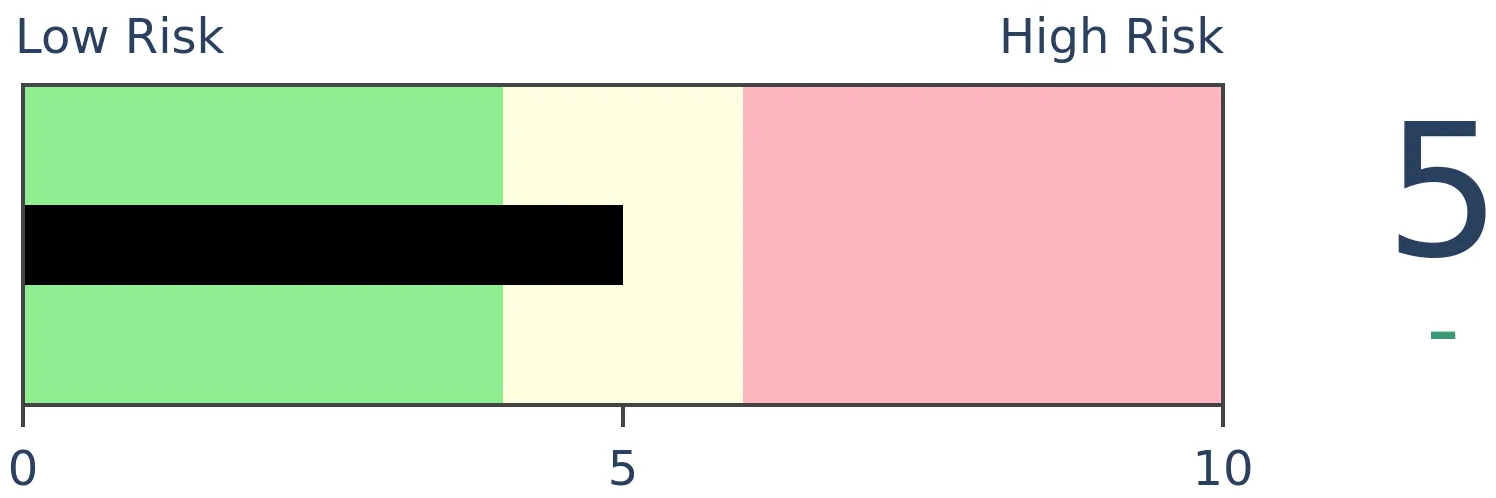
Crude Oil

|
|
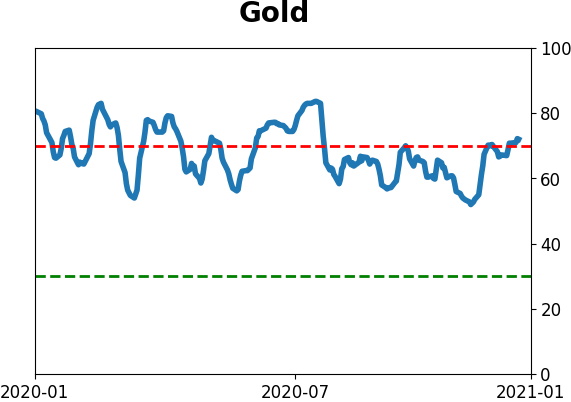
Gold
|
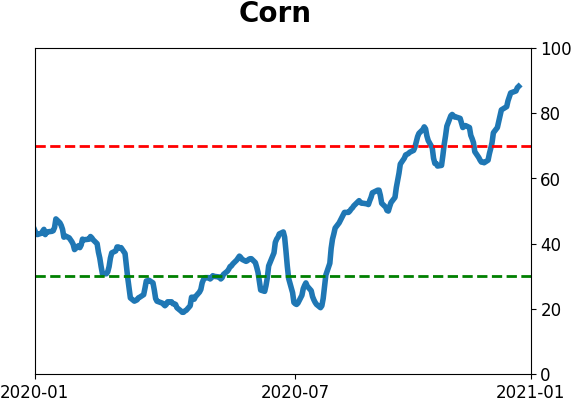
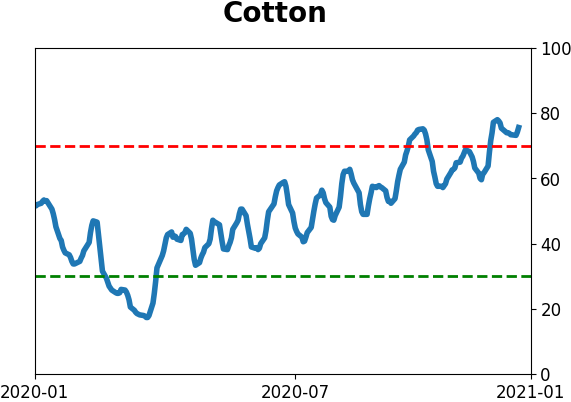
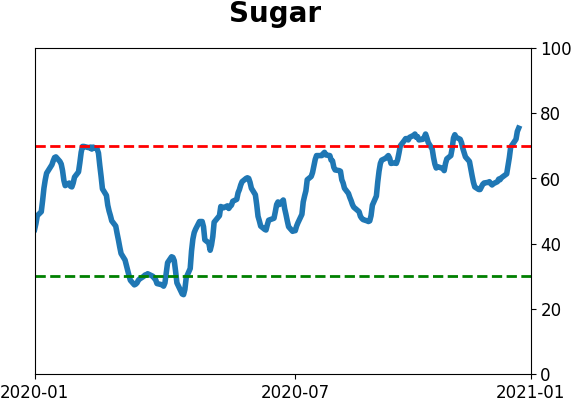
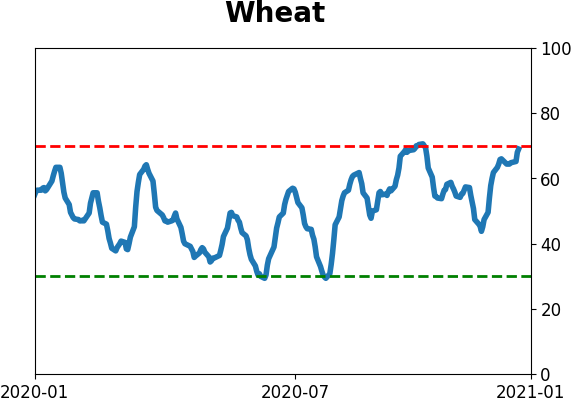
Agriculture
|
|
Research
BOTTOM LINE
Sentiment on Treasury notes and bonds has soured significantly in recent weeks, and some indicators are starting to show extremes, though the overall bias is still about neutral. Fundamental data improvement hasn't been as negative for Treasuries as expected.
FORECAST / TIMEFRAME
None
|
The Georgia election results weren't received warmly by bond investors, who decided to sell first...and aggressively.
This isn't really new, as Treasuries have performed poorly for months. In reaction, clients at JP Morgan are expecting even more weakness.
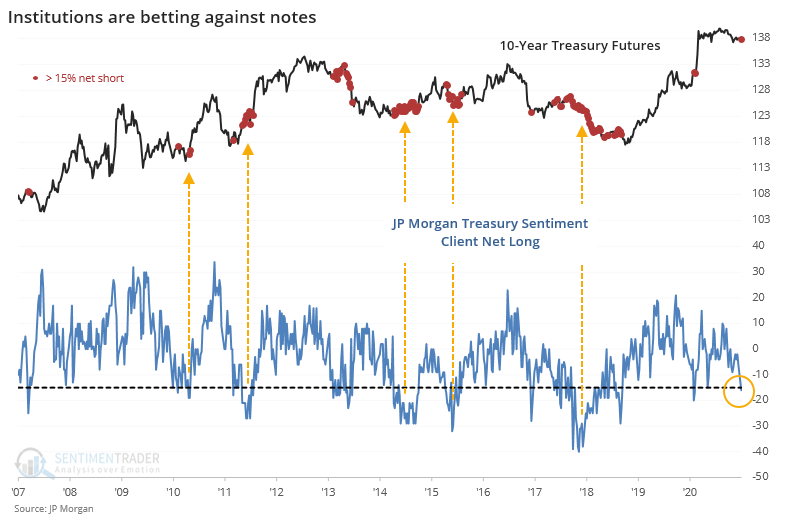
When clients were more than 15% net short during the past decade, 10-year Treasury futures tended to rise, with the most net short positions leading to gains in note prices each time. Their current positioning isn't quite on par with those other extremes, though.
Other traders are a bit more sanguine, with futures speculators holding a minor net long position.
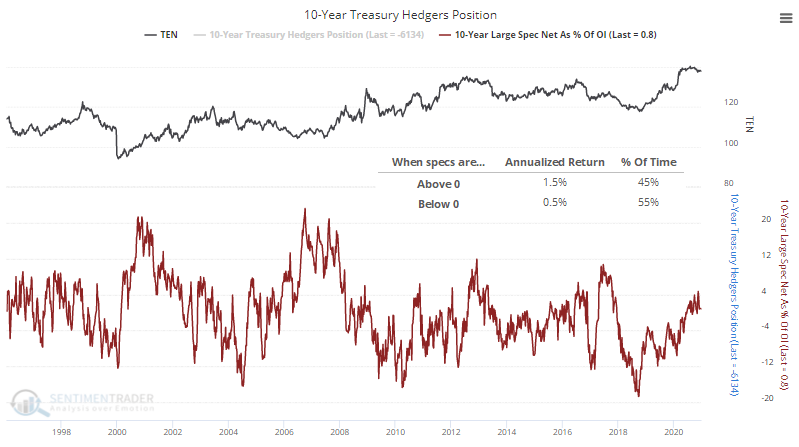
We can see from the chart that when speculators were net long, Treasuries advanced at a +1.5% rate versus only +0.5% when they were net short, so it was actually better for Treasuries when speculators were long than when they were short. There tends to be more trouble when speculators are extremely long, which they are not yet.
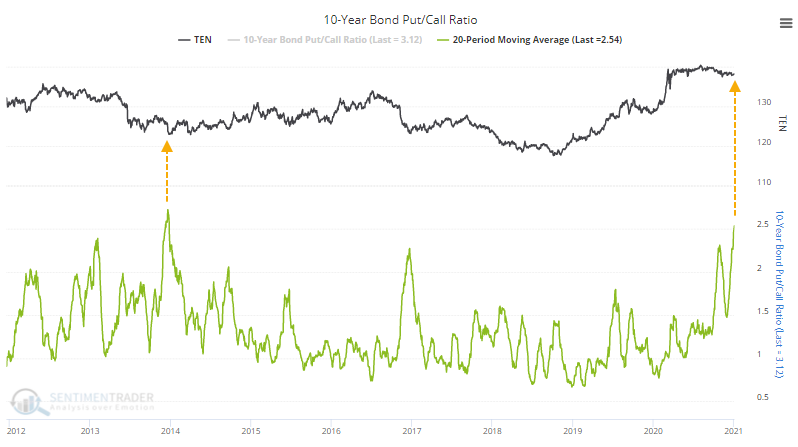
Treasury options have been active, especially on the put side. On Tuesday and Wednesday alone, more than 1 million puts traded. On Tuesday, there were over 4 puts traded for every call, the highest Put/Call Ratio in more than 5 years.
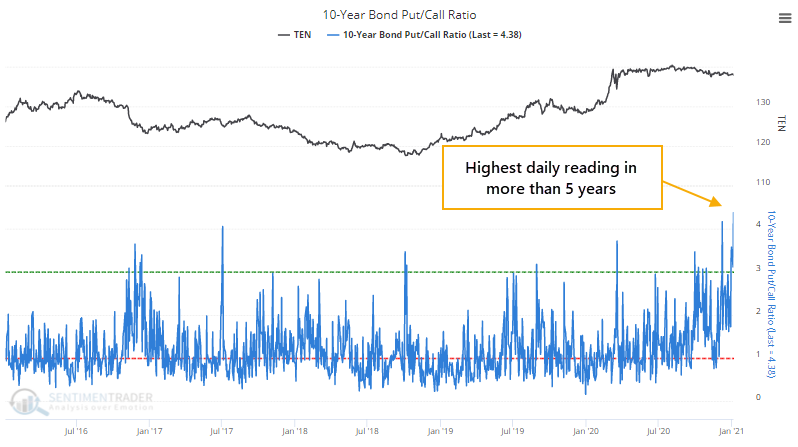
Put volume has been heavy for weeks, so the 20-day average of the ratio has soared to nearly a record high, just below the peak from late 2013.
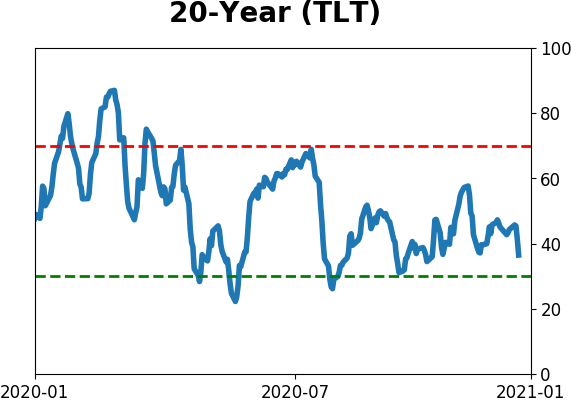
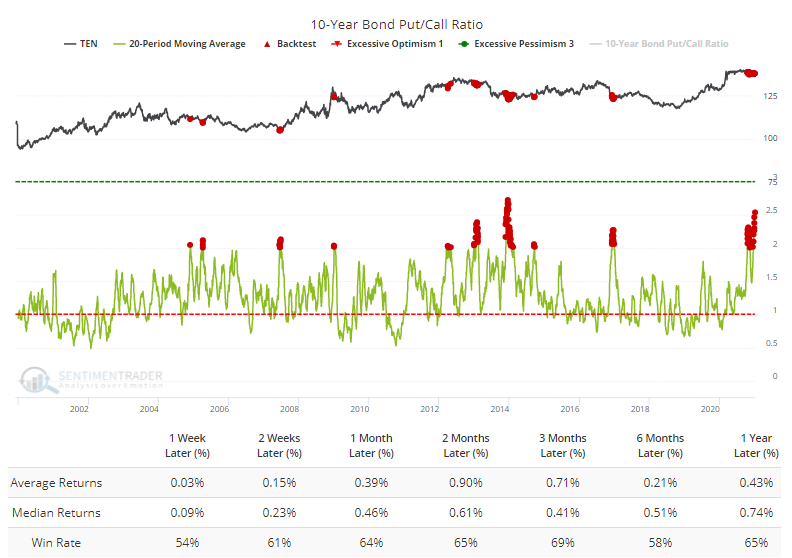
Other times when traders focused on puts over calls by more than a 2-to-1 ratio has preceded just-okay returns per the Backtest Engine.
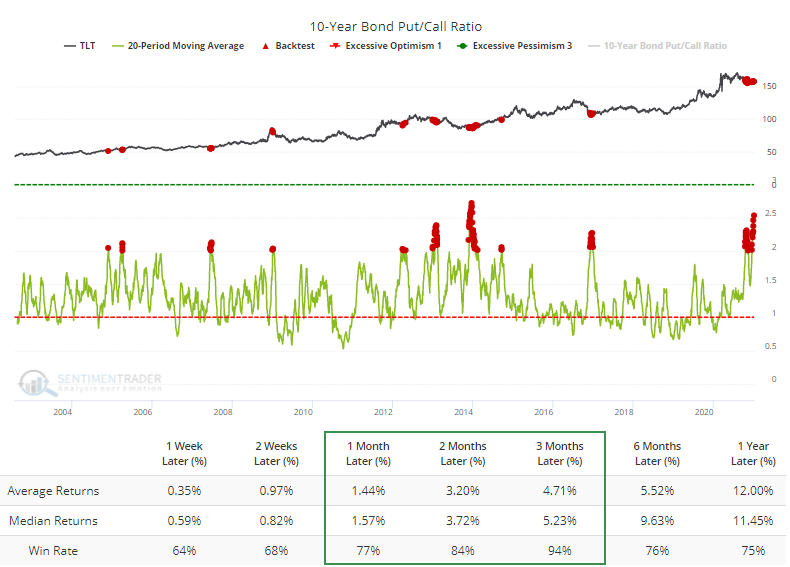
Returns were better for the TLT fund when the ratio was high, with 94 out of 100 days showing a positive return 3 months later.
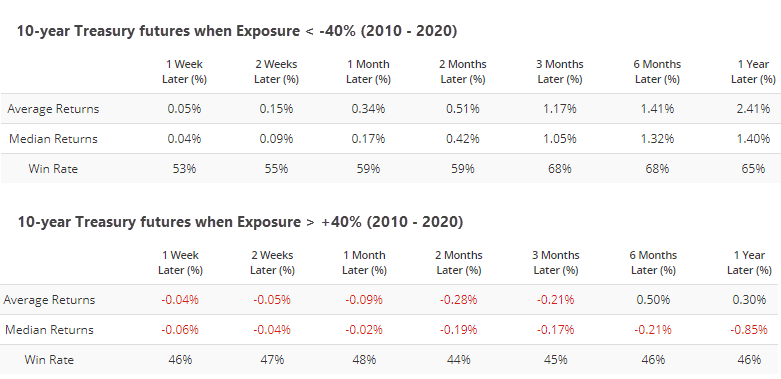
Along with options traders, trend-following hedge funds seem to be pressing their bets against Treasuries, with Hedge Fund Exposure dropping below -40% this week.
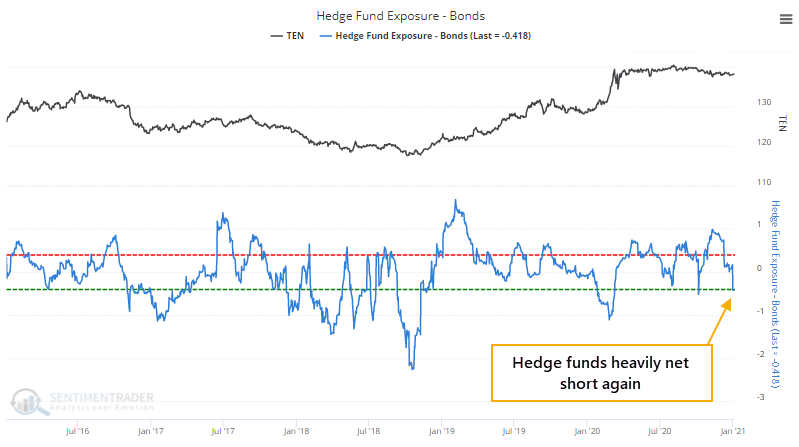
Over the past decade, when funds were heavily short, below -40% exposure, then the 10-year was higher 68% of the time 3 months later. When funds had the opposite position, then the 10-year was higher only 45% of the time.
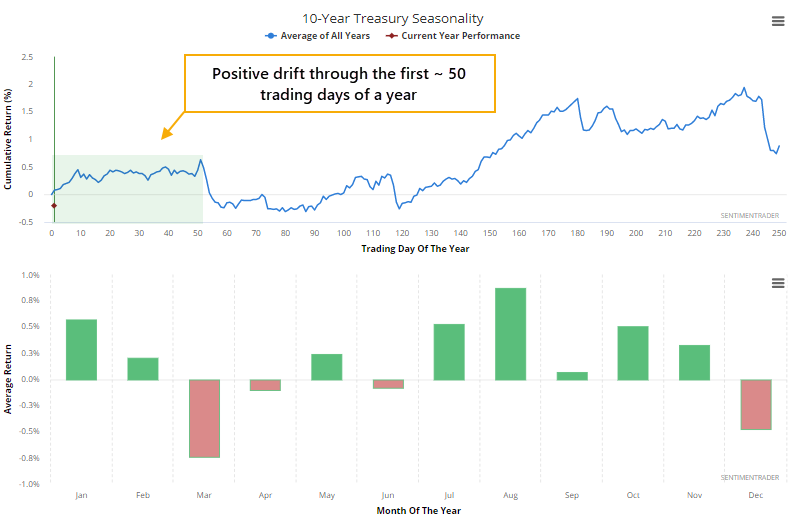
Those bets have a slight headwind thanks to the calendar, as there tends to be a modest positive bias to Treasuries to start a year.
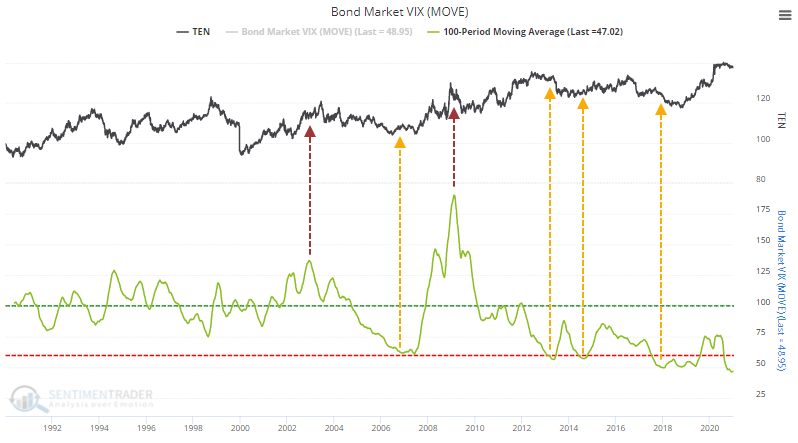
Thanks to monetary policy, volatility in bonds has dropped to the lowest on record. Unlike some other markets, though, low implied volatility in bonds has not necessarily preceded weak returns, and vice-versa. If anything, it's slightly the opposite, so perhaps that's a very slight positive here.
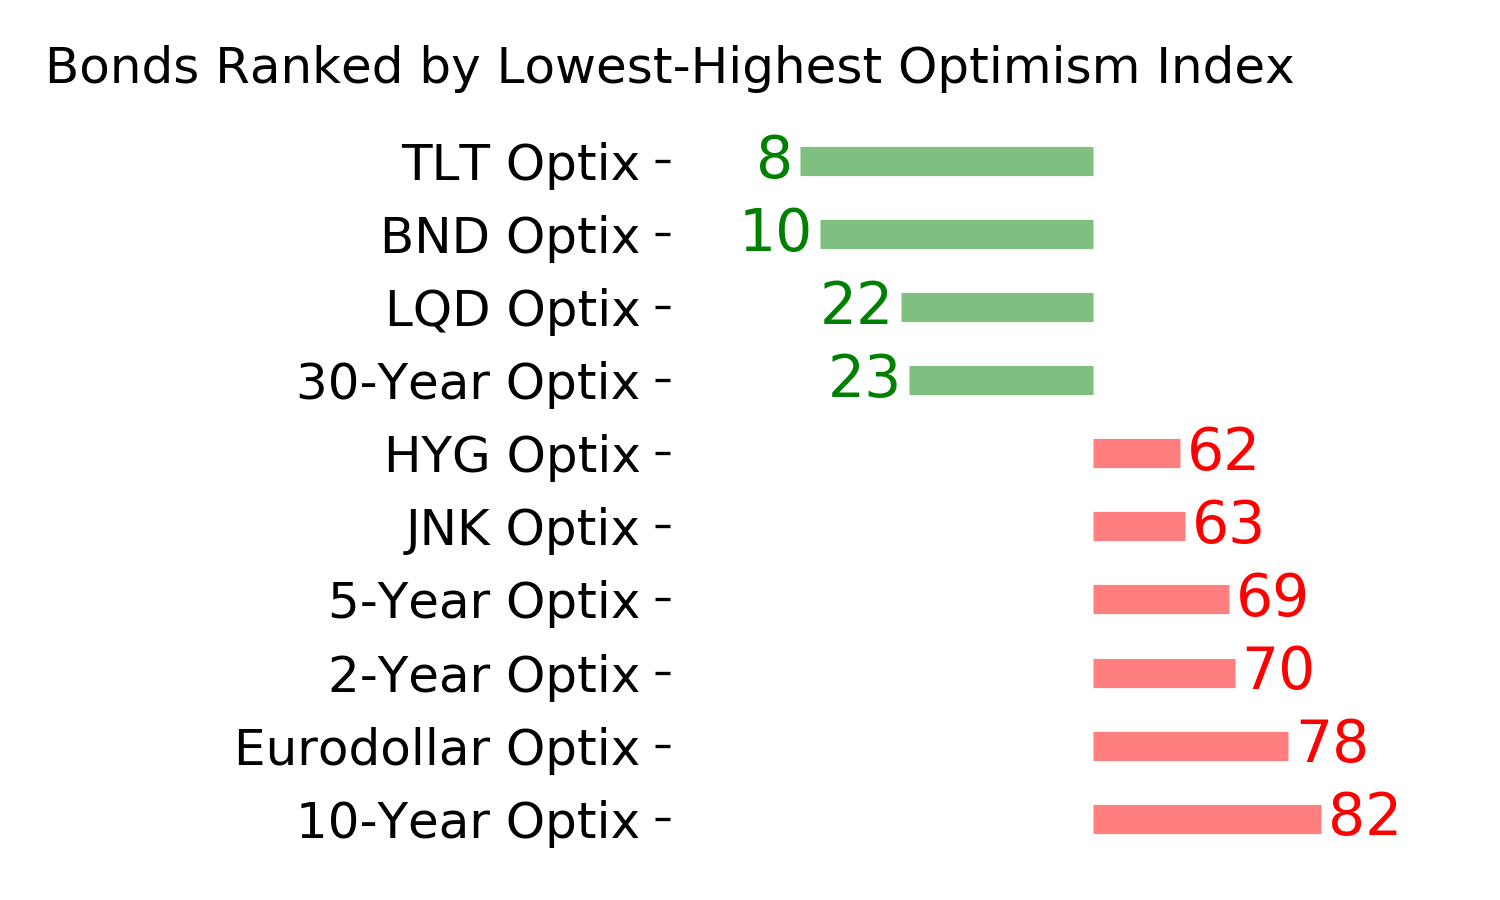
Our most comprehensive look at bond market sentiment is the Bond Optix, which remains in neutral territory.
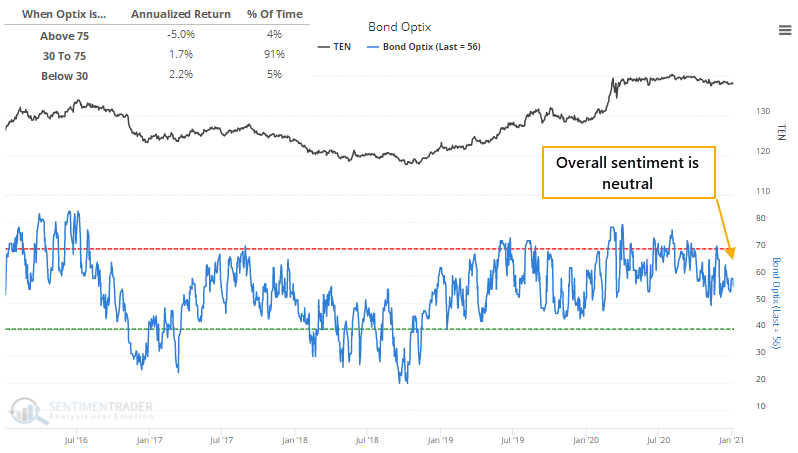
Over the past 20 years, returns have been fairly heavily contrary, with low readings preceding good annualized returns and vice-versa, so it's not telling us much right now other than in a broad sense, there isn't enough evidence to consider sentiment extremely pessimistic on notes and bonds.
As we saw yesterday, fundamentally there has been some good news, with a pickup in the ISM Manufacturing survey, which should precede a jump in Industrial Production. That kind of activity is supposed to indicate a rise in economic activity, likely leading to lower bond prices and higher yields.
Let's check.
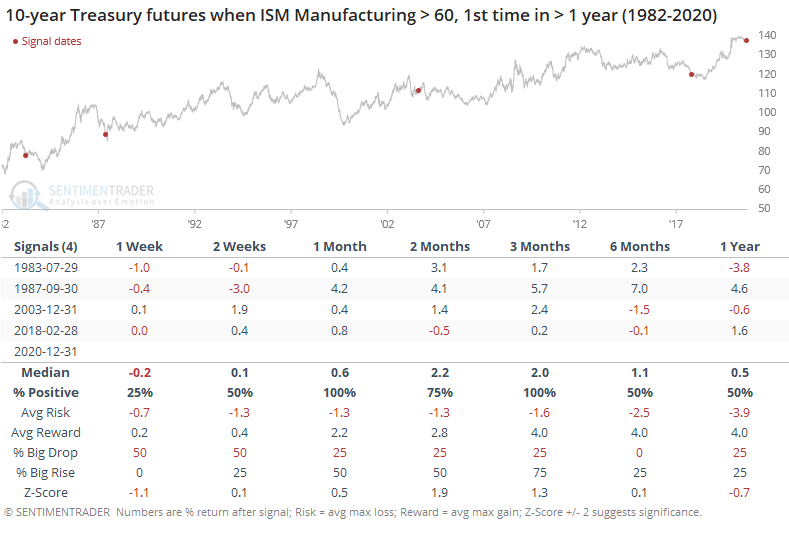
Well, not really. Since the inception of 10-year Treasury futures, the 4 other times the survey first rose above 60 preceded gains in the futures over the next 3 months. If we use yield instead, then we can go back further.
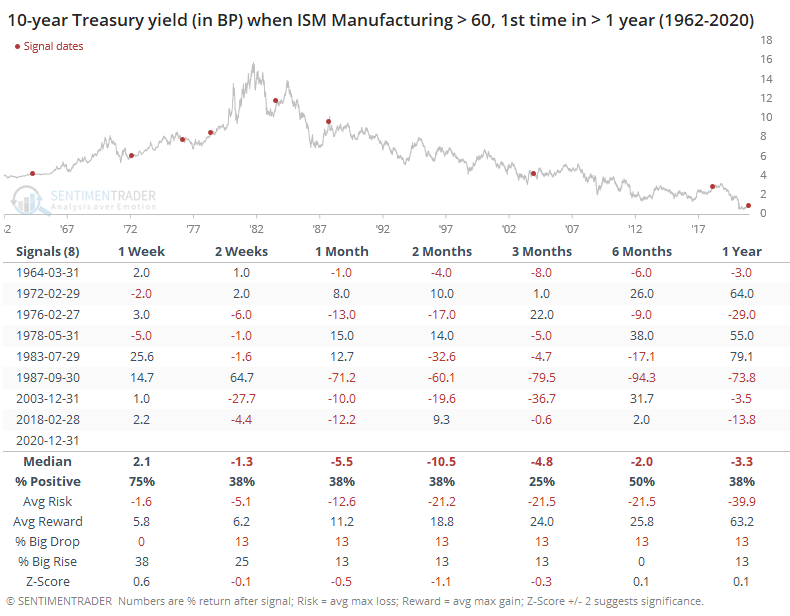
There was still not a consistent bias toward higher yields, and lower prices, for the 10-year. Over the next 3 months, only 2 of the 8 signals preceded a higher yield.
Overall, there are some modest positives for Treasuries here. A little tailwind from seasonality, sprinkled with excessively pessimistic bets from options traders, institutions, and hedge funds. But a more comprehensive look at sentiment shows a more mixed picture, with not enough bets against the market to suggest a strong extreme, and with a market undergoing the turmoil that this one is, its hard to have high confidence in only moderate extremes.
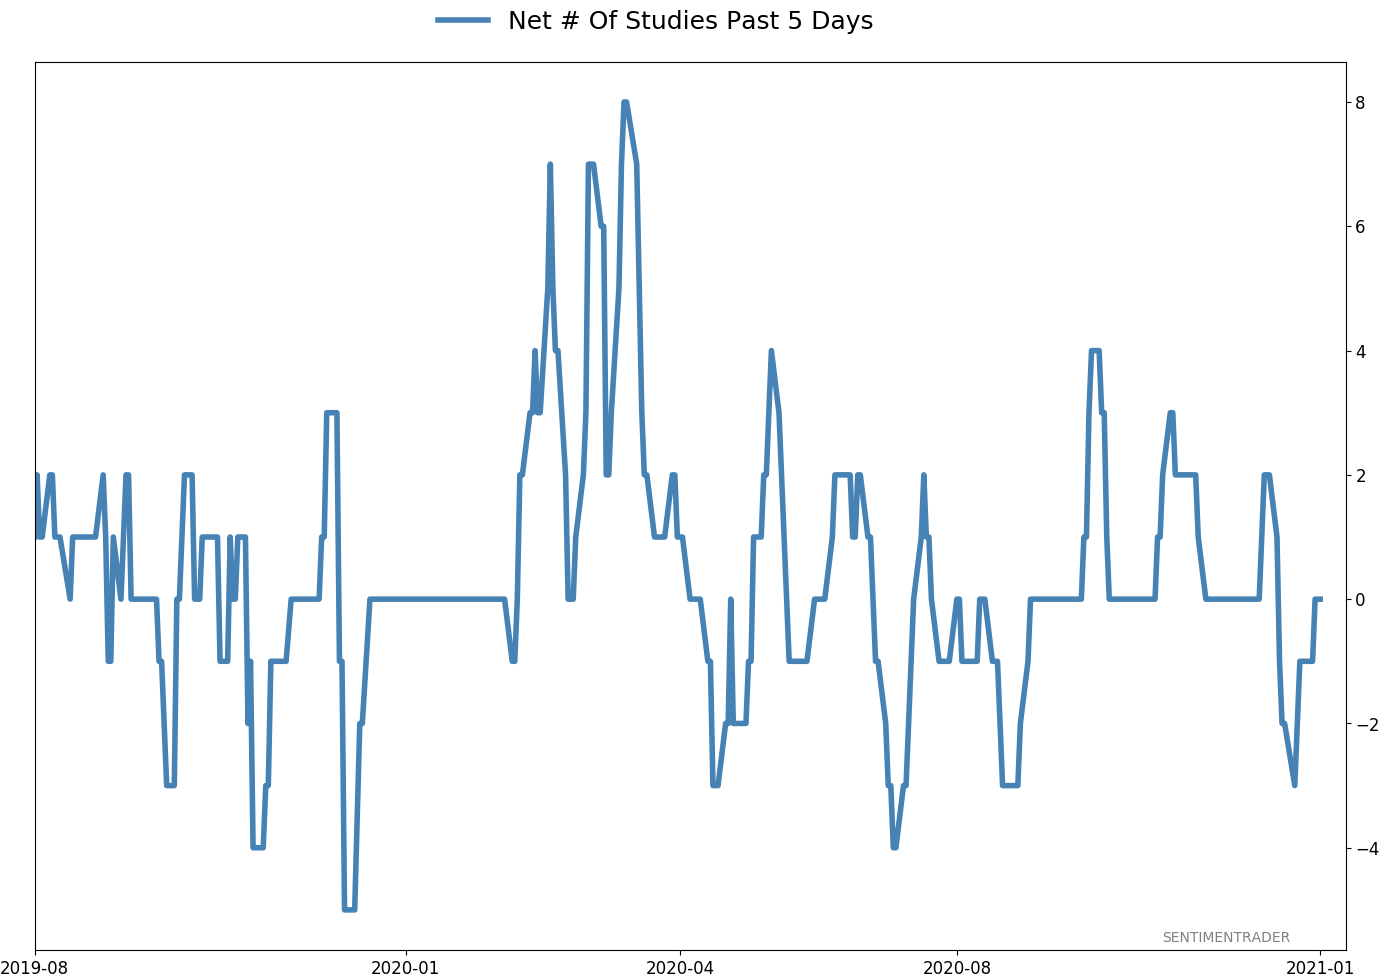
Active Studies
| Time Frame | Bullish | Bearish | | Short-Term | 0 | 0 | | Medium-Term | 2 | 1 | | Long-Term | 14 | 2 |
|
Indicators at Extremes
Portfolio
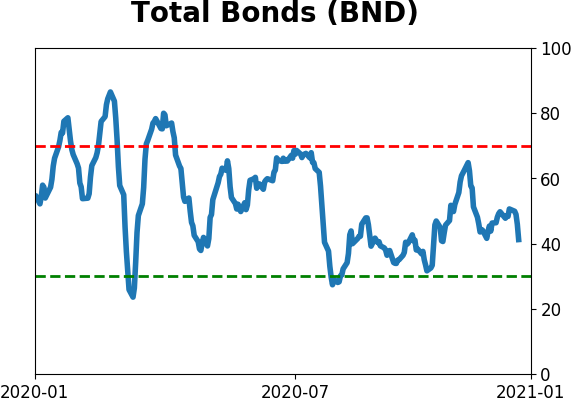
| Position | Description | Weight % | Added / Reduced | Date | | Stocks | 10.6% VWO, 10.1% XLE, 8.5% RSP, 8.3% PSCE | 37.5 | Added 3% | 2021-01-05 | | Bonds | 10% BND, 10% SCHP, 10% ANGL | 27.8 | Reduced 0.1% | 2020-10-02 | | Commodities | GCC | 2.3 | Reduced 2.1%
| 2020-09-04 | | Precious Metals | GDX | 9.8 | Added 4.8% | 2020-12-01 | | Special Situations | | 0.0 | Reduced 5% | 2020-10-02 | | Cash | | 22.6 | | |
|
Updates (Changes made today are underlined)
There hasn't been much that changed in recent weeks, with sky-high sentiment on many measures receding a bit, but that's not necessarily a good sign, just ask February 2020. We still have the lingering positives from all the breadth thrust last year, as late as October and November. Those have a very good historical record at preceding higher prices over a longer time frame. Of more immediate concern is the explosion in speculation in the most leveraged parts of the market. So far, that hasn't translated to price troubles, though there have been more oddities n the latter half of December than we'd seen since August, like the major indexes rising but on very poor breadth. I continue to avoid tech- and cap-heavy indexes, and don't see that changing any time soon. Energy stocks are doing what they should, and I added a bit more there. I'm not a momentum trader and do not focus on pyramiding positions in this account - it's more about protecting capital - but I like the setup on a long-term time frame. RETURN YTD: 3.3% 2020: 8.1%, 2019: 12.6%, 2018: 0.6%, 2017: 3.8%, 2016: 17.1%, 2015: 9.2%, 2014: 14.5%, 2013: 2.2%, 2012: 10.8%, 2011: 16.5%, 2010: 15.3%, 2009: 23.9%, 2008: 16.2%, 2007: 7.8%
|
|
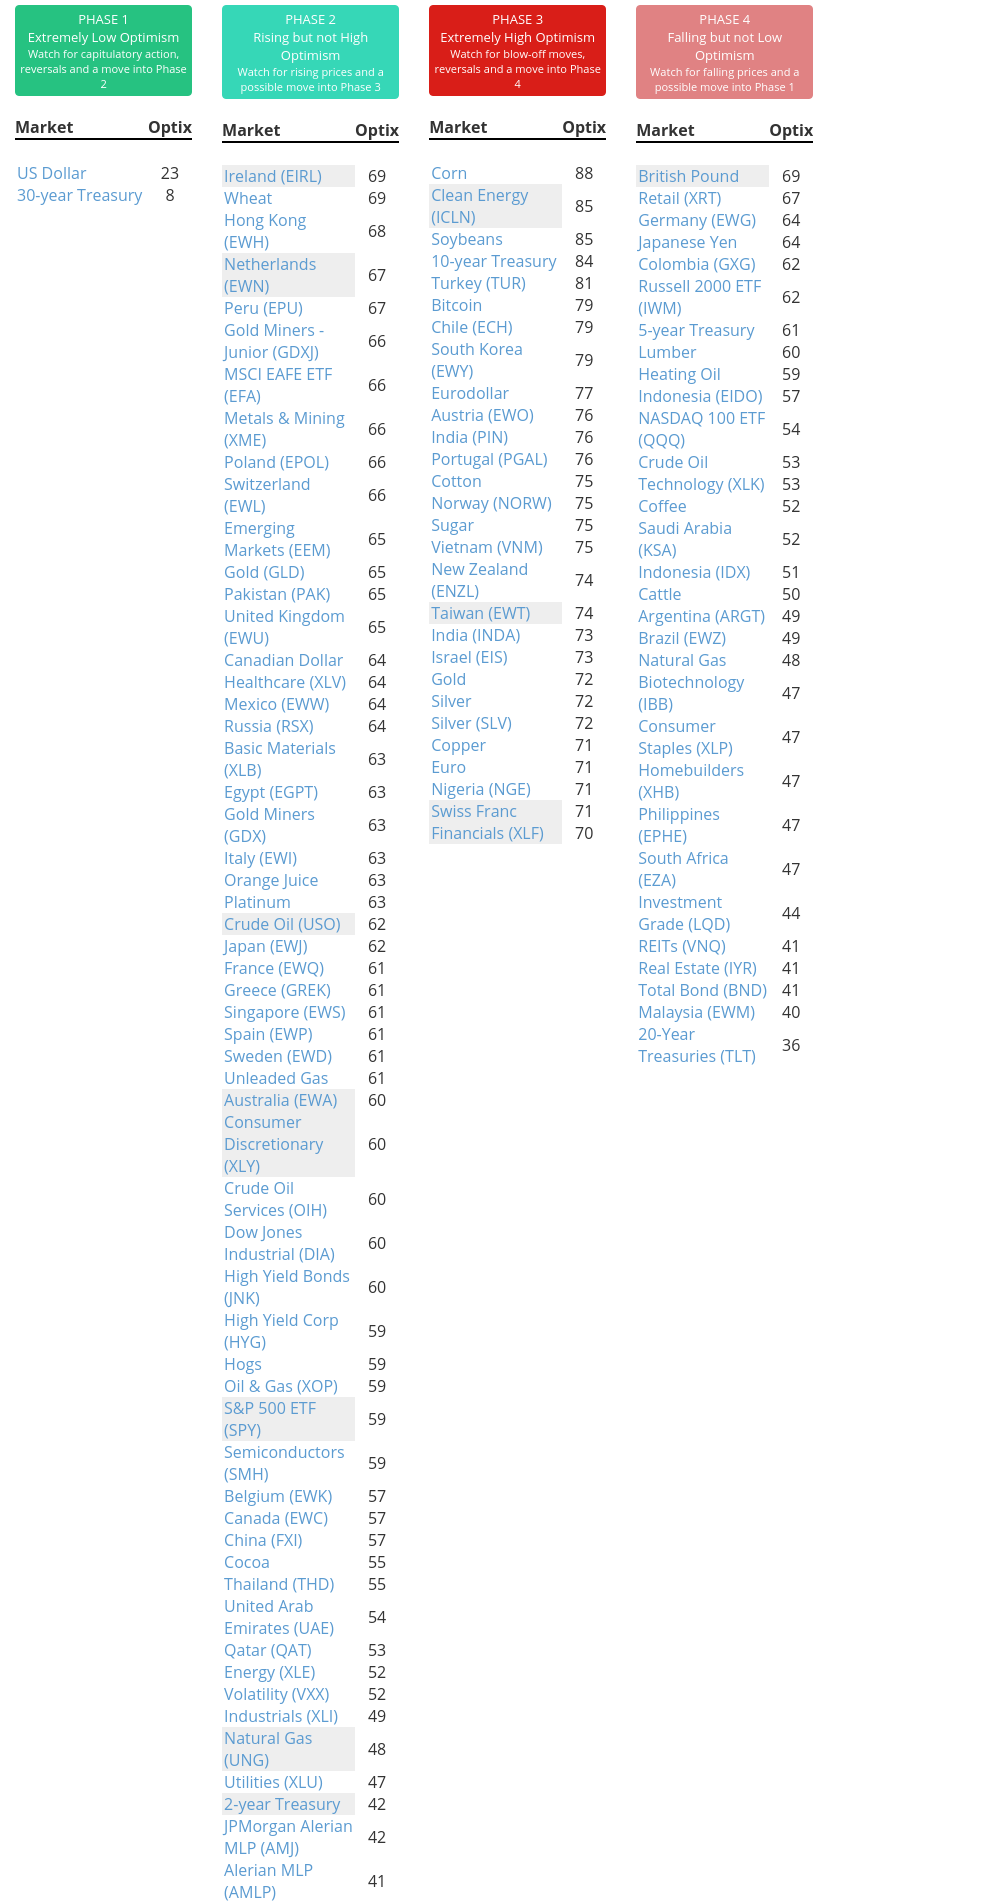
Phase Table
Ranks
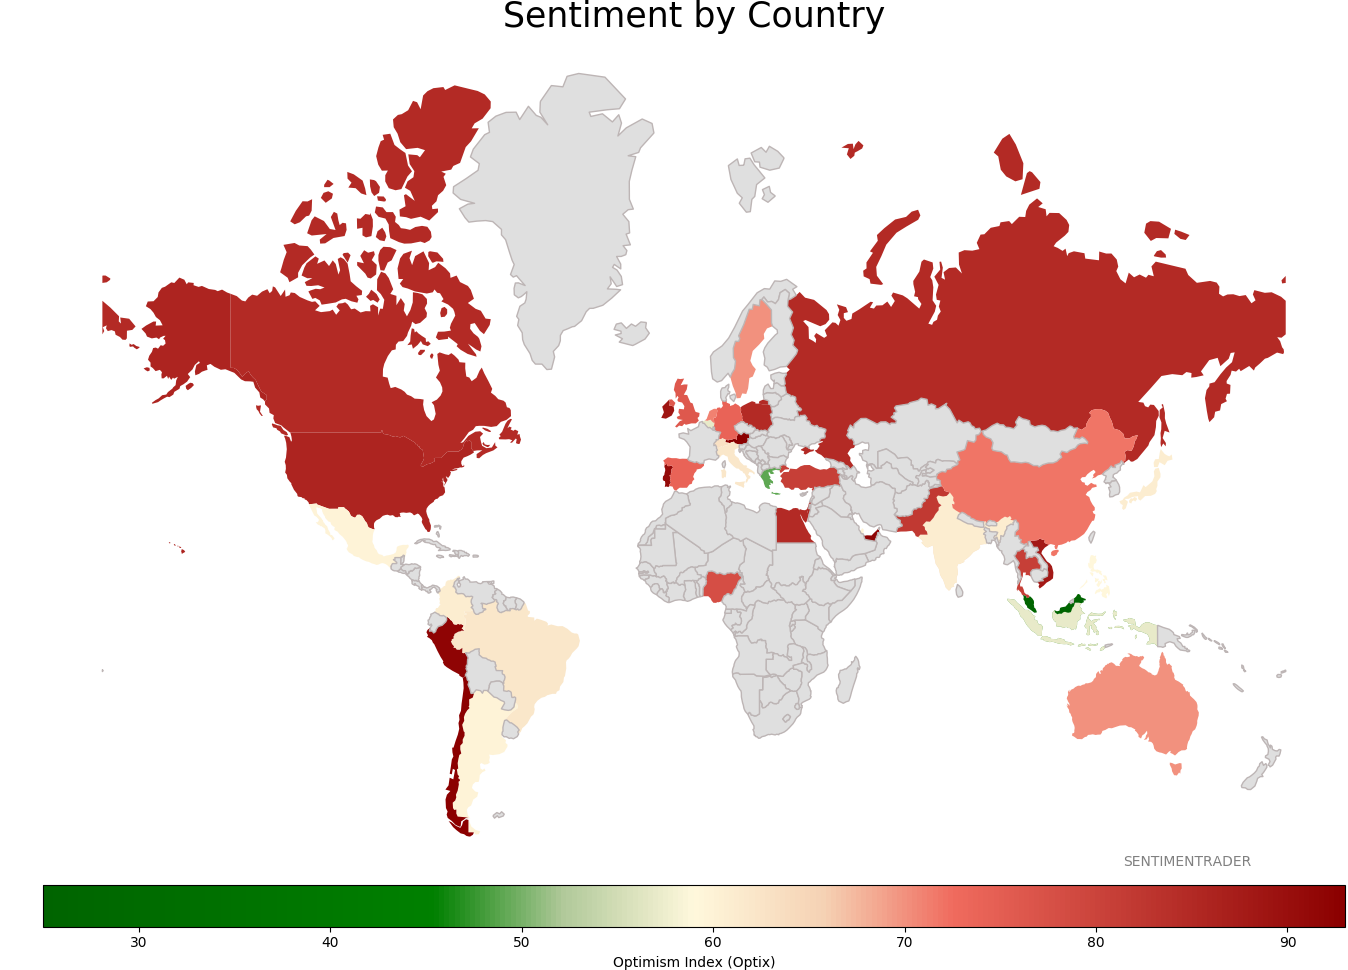
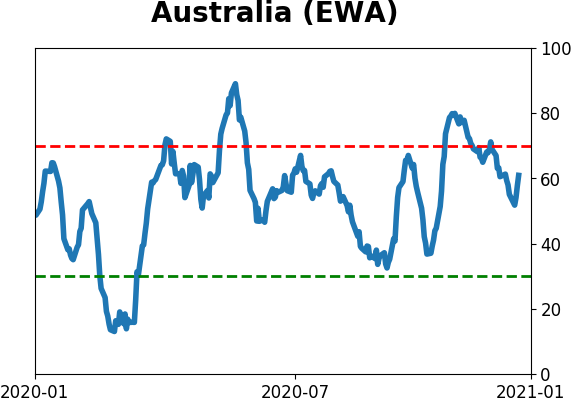
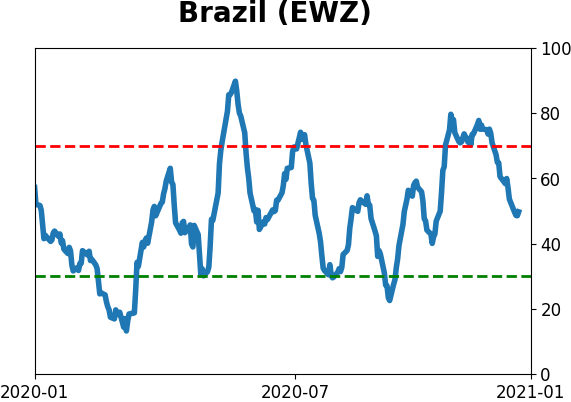
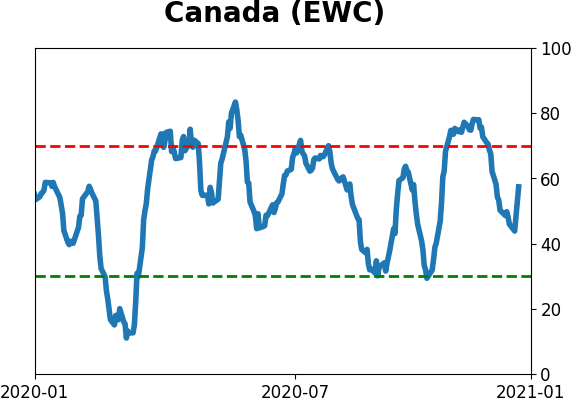
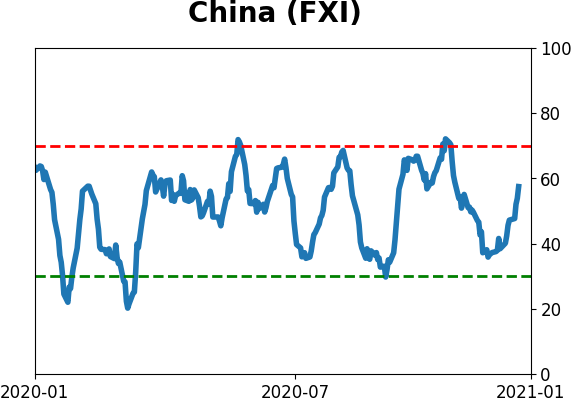
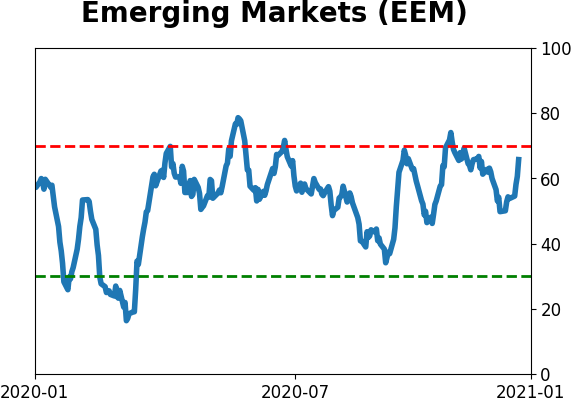
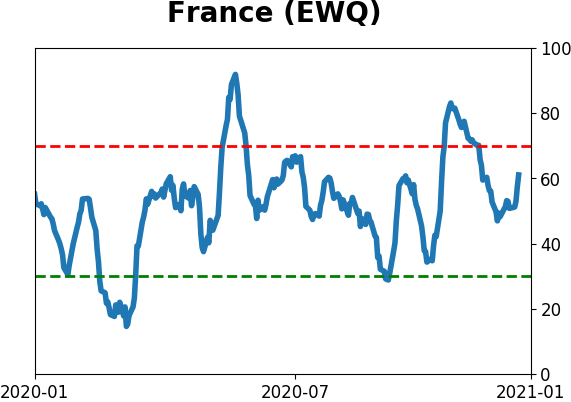
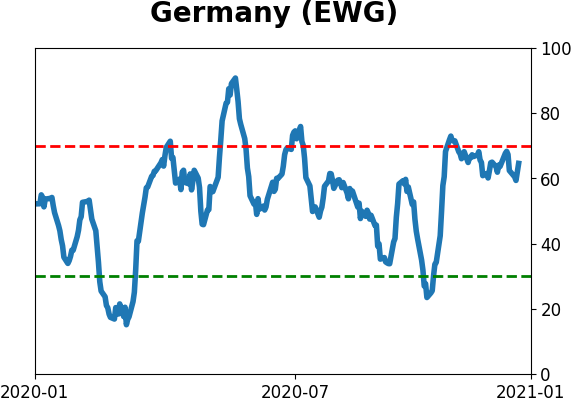
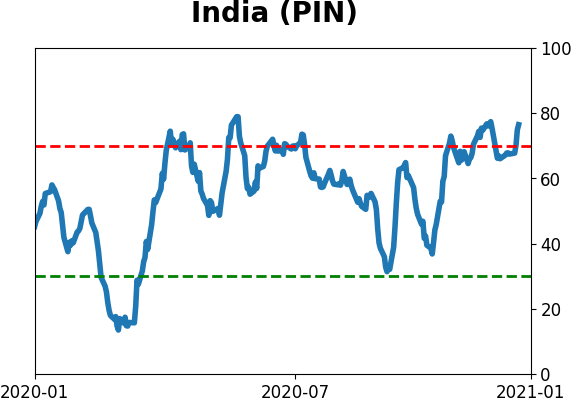
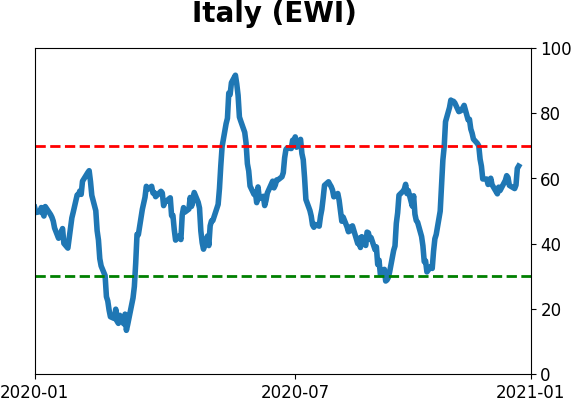
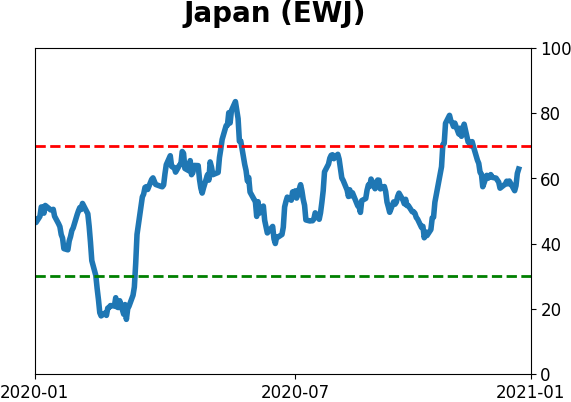
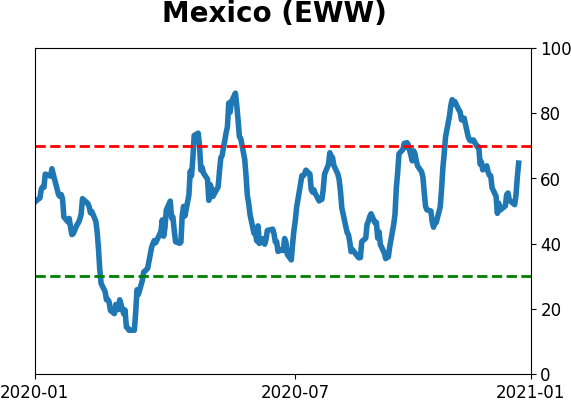
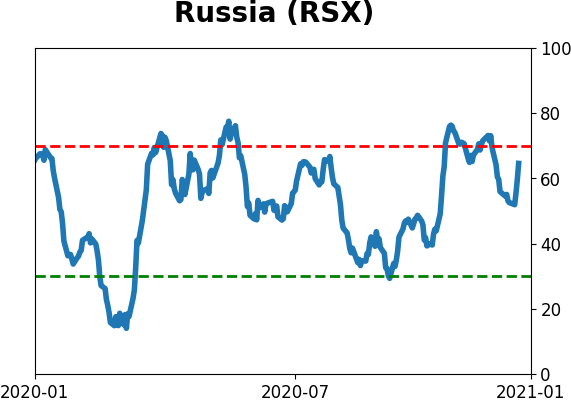
Sentiment Around The World
Optimism Index Thumbnails
|
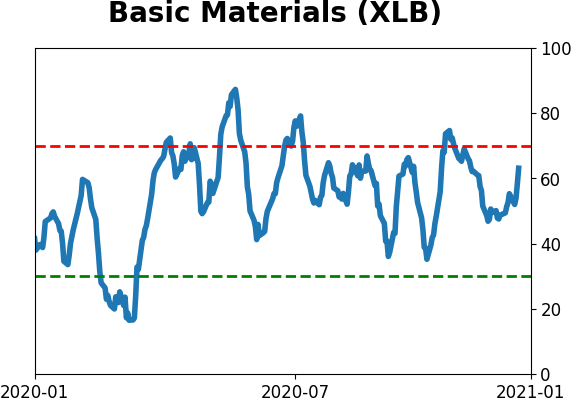
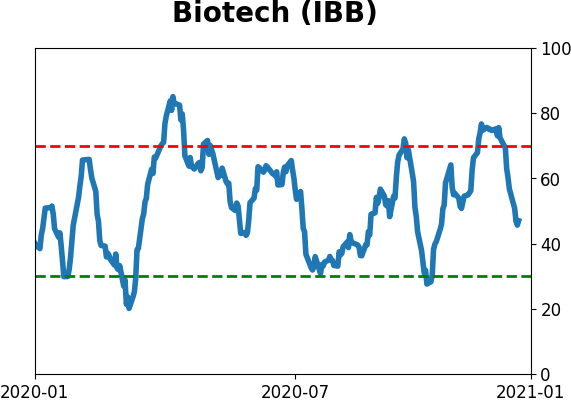
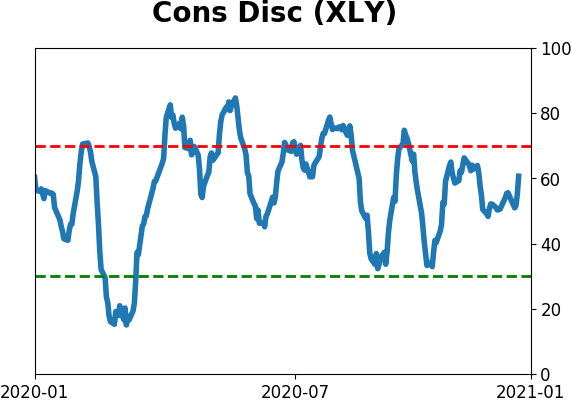
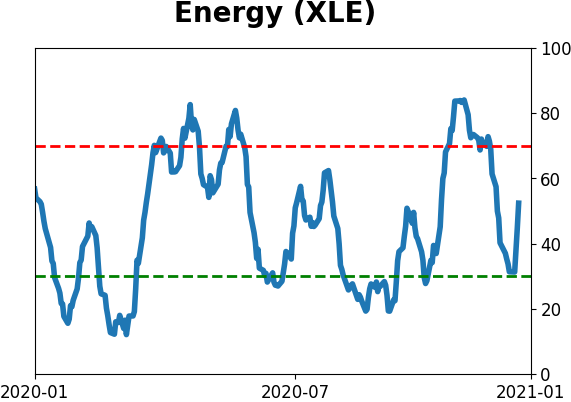
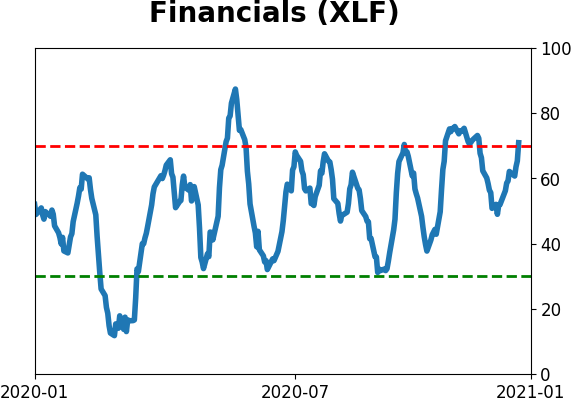
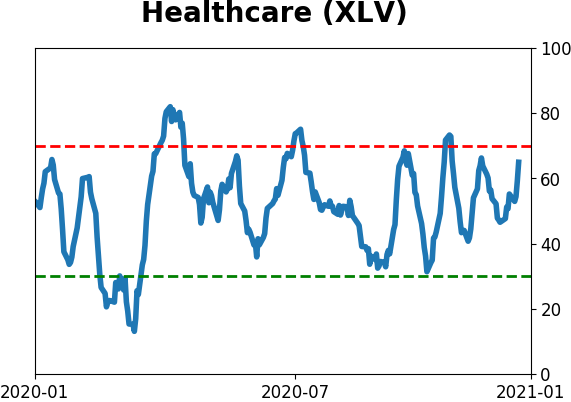
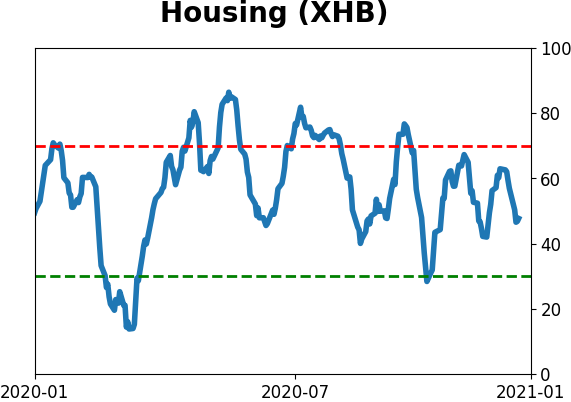
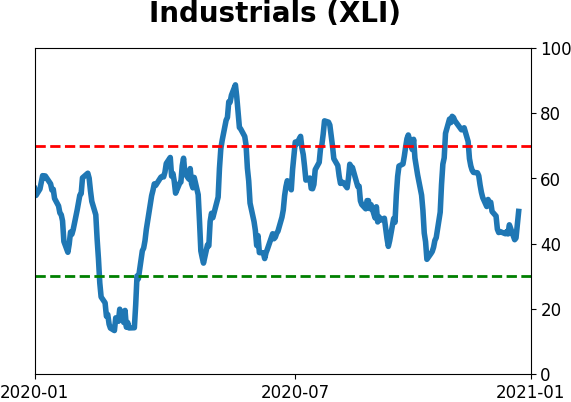
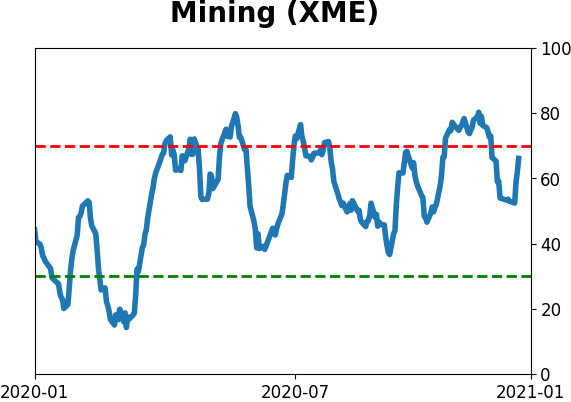
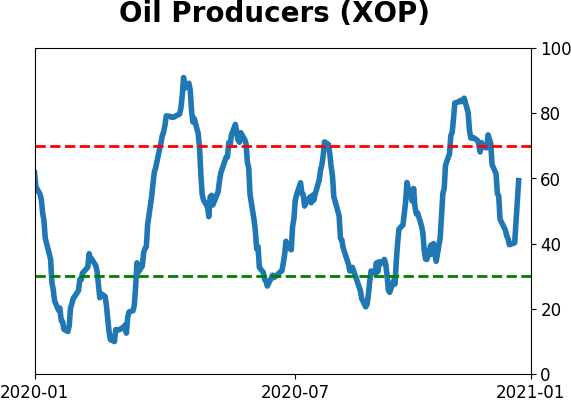
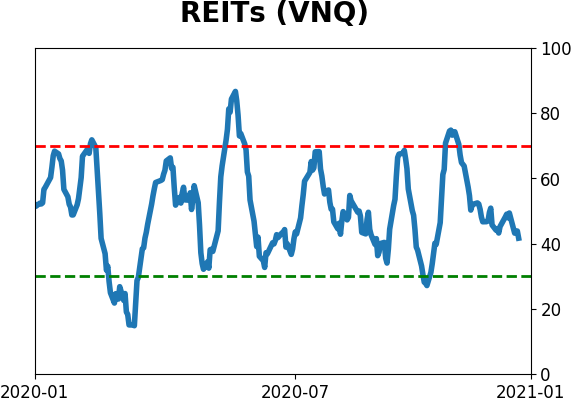
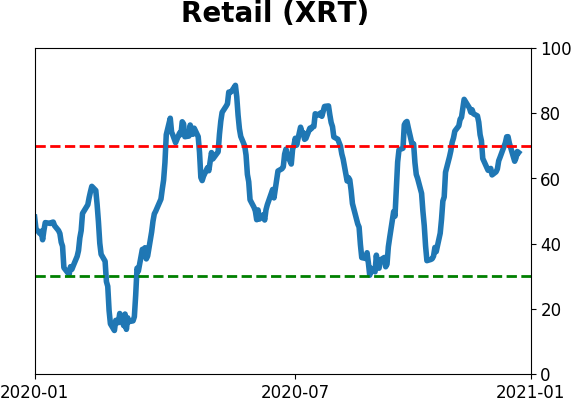
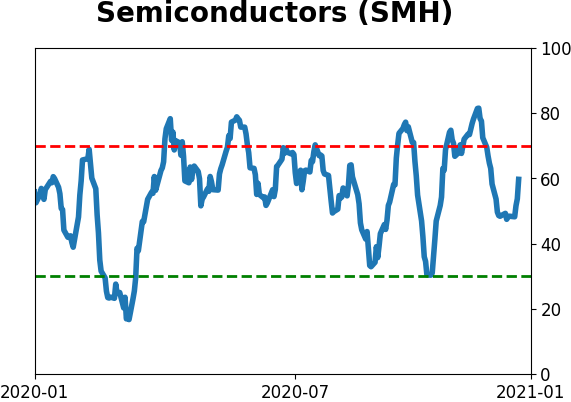
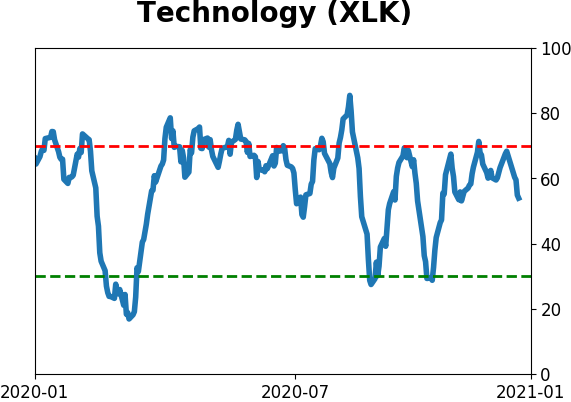
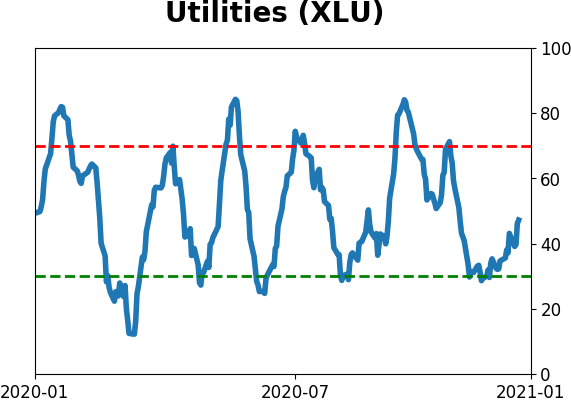
Sector ETF's - 10-Day Moving Average
|
|
|
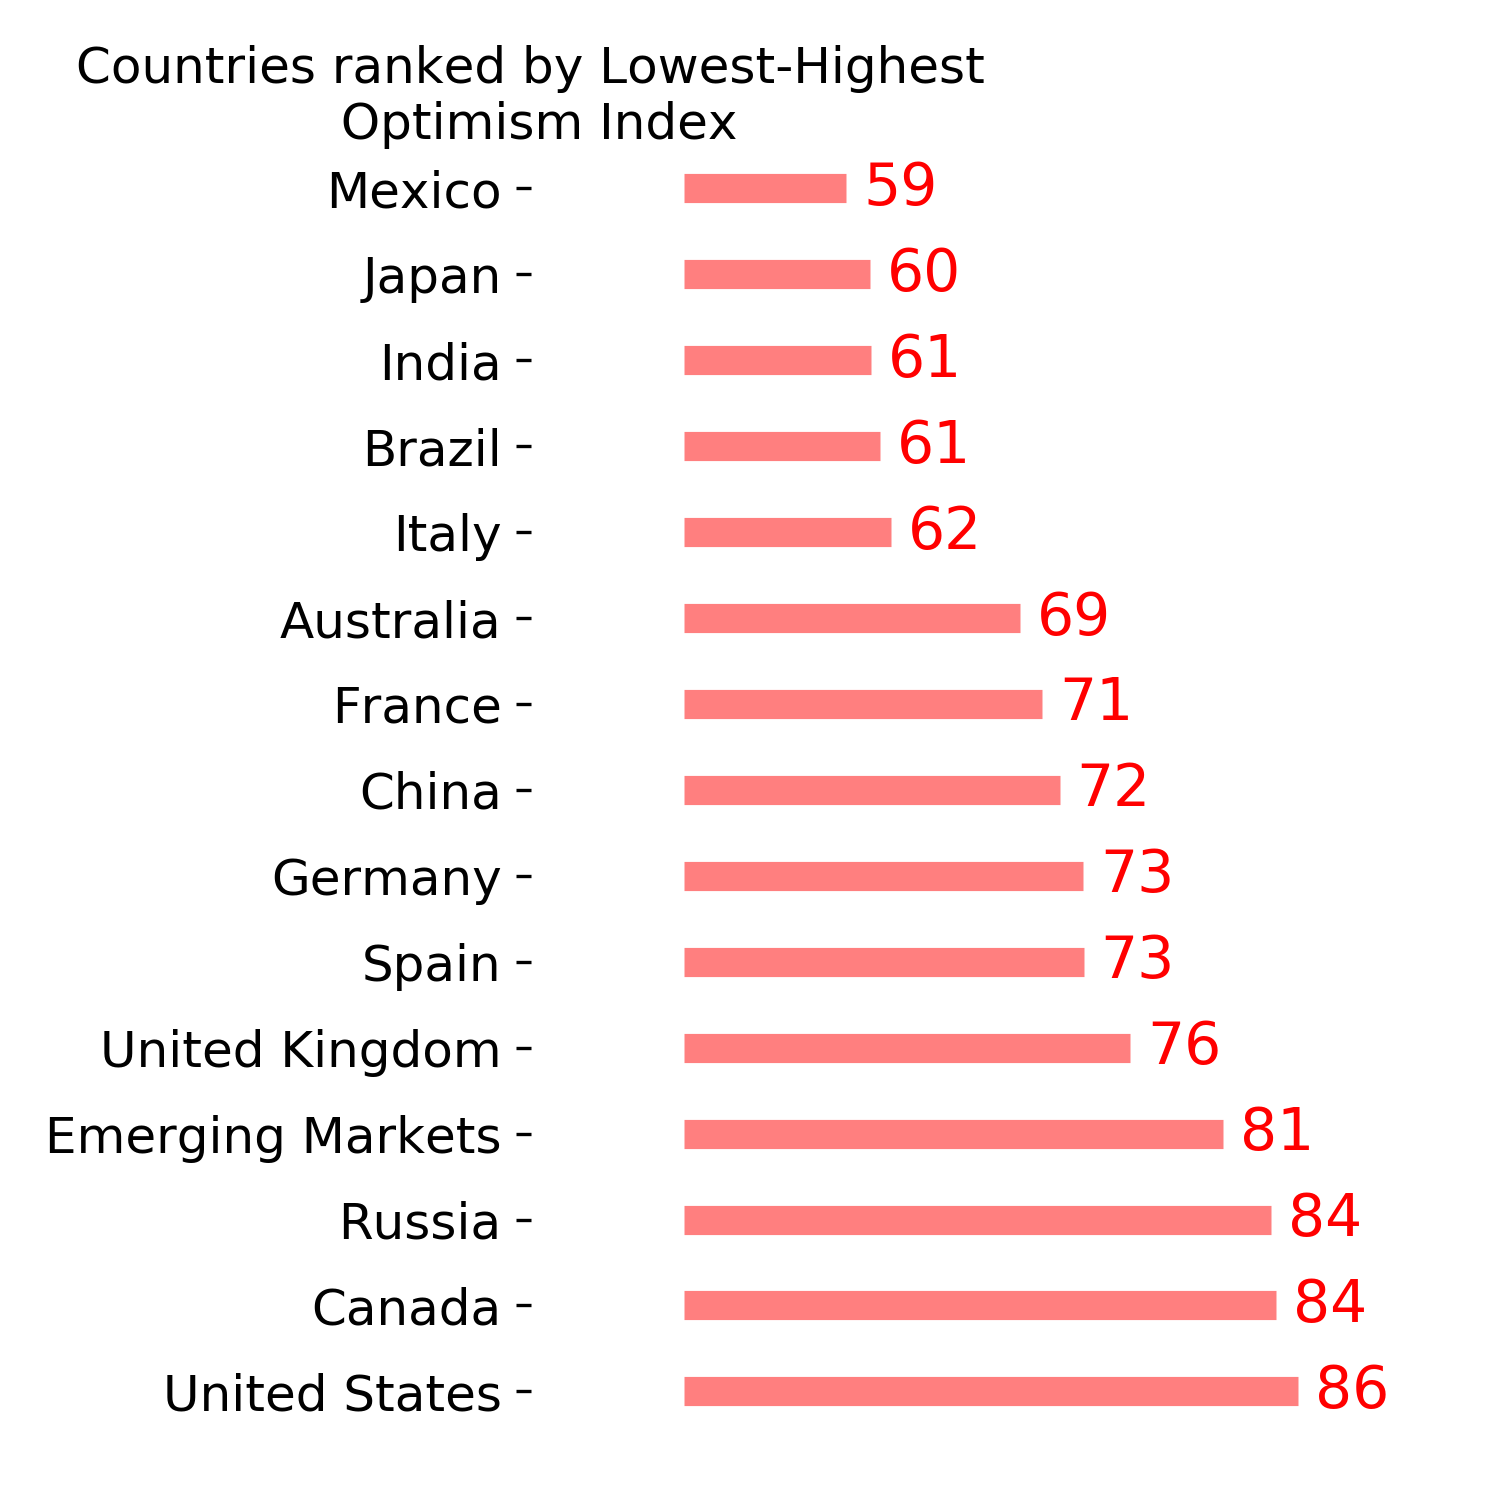
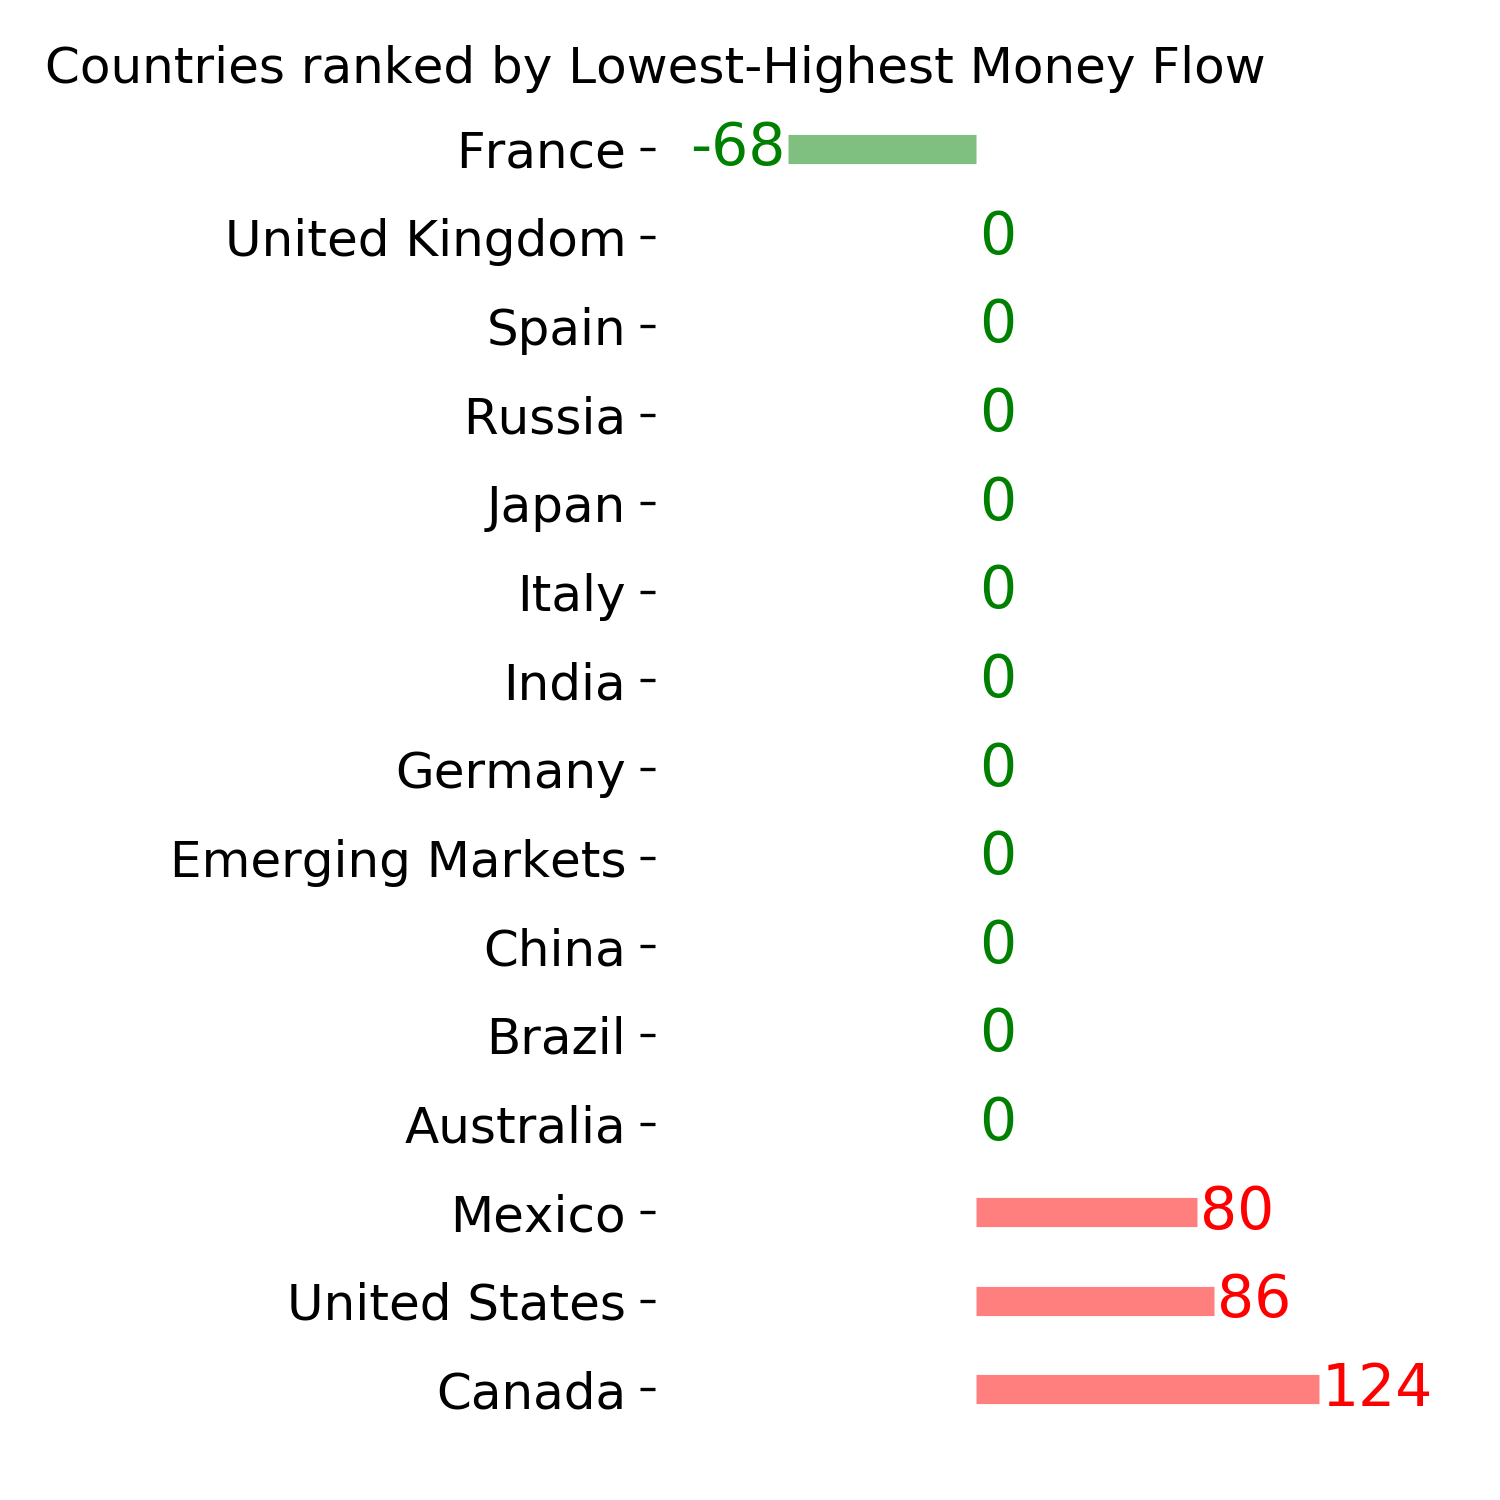
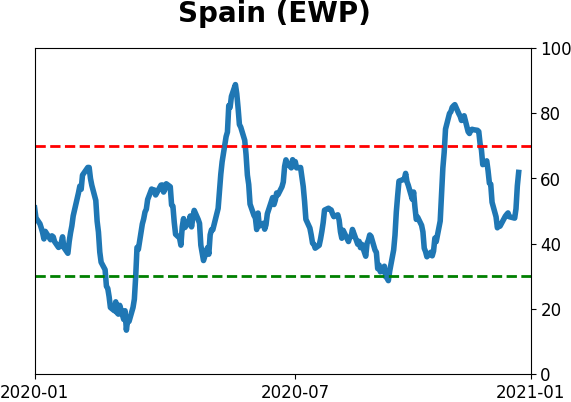
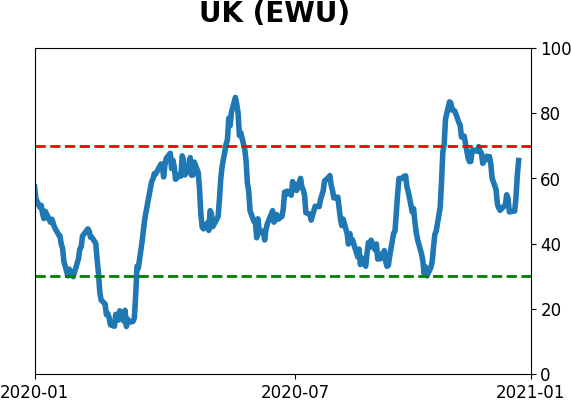
Country ETF's - 10-Day Moving Average
|
|
|
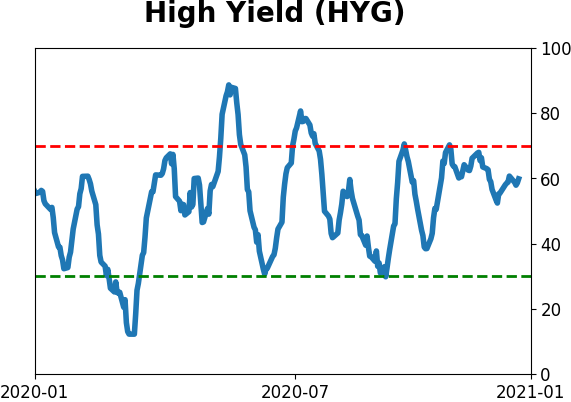
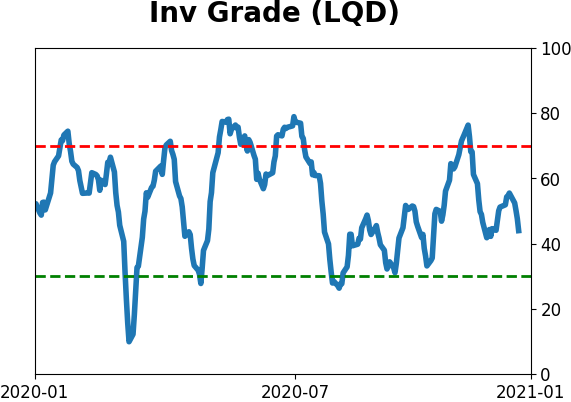
Bond ETF's - 10-Day Moving Average
|
|
|
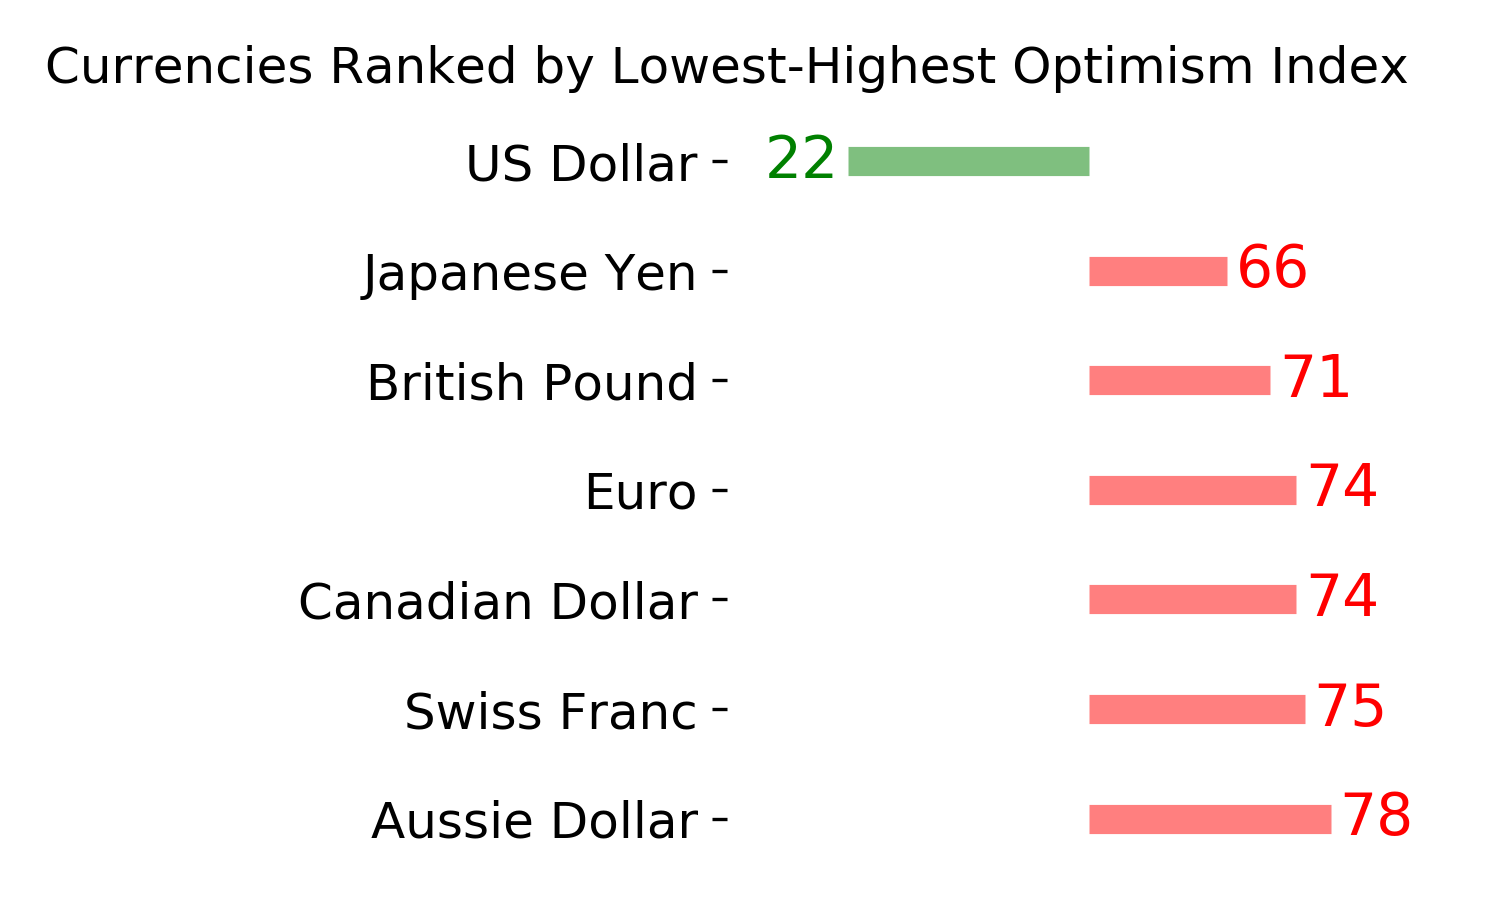
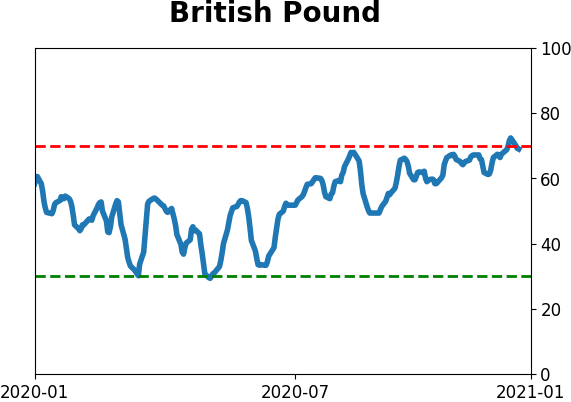
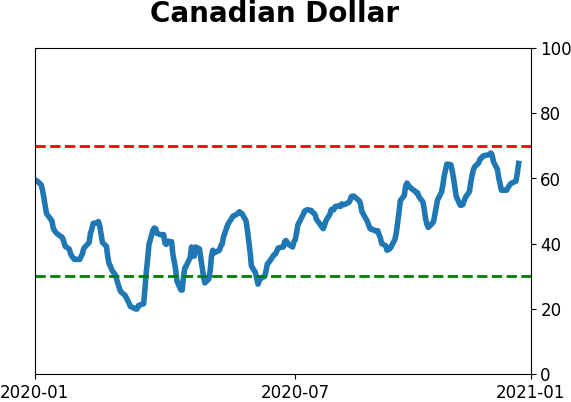
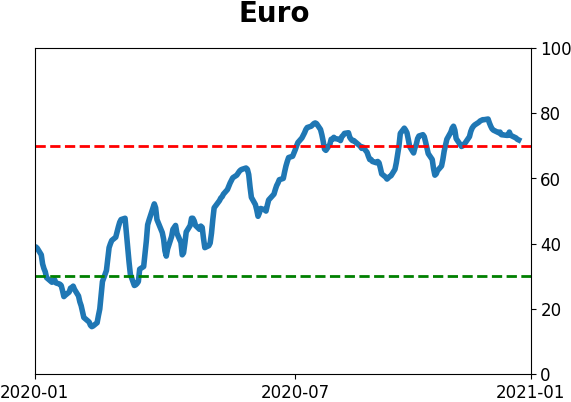
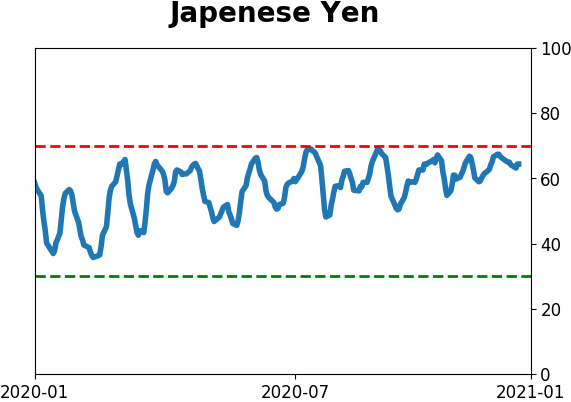
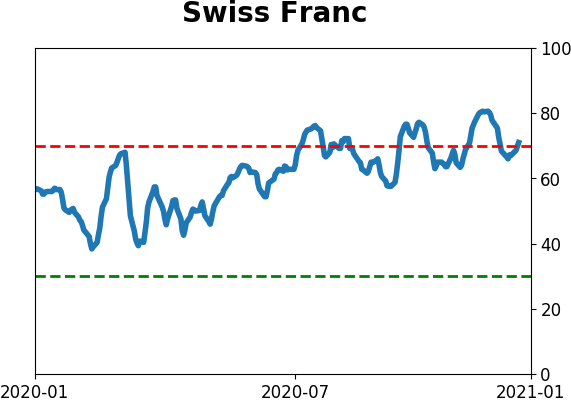
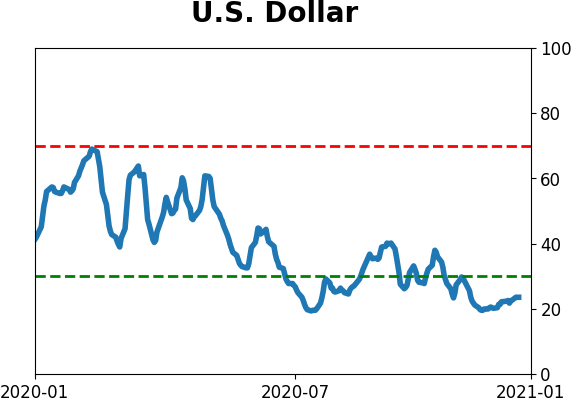
Currency ETF's - 5-Day Moving Average
|
|
|
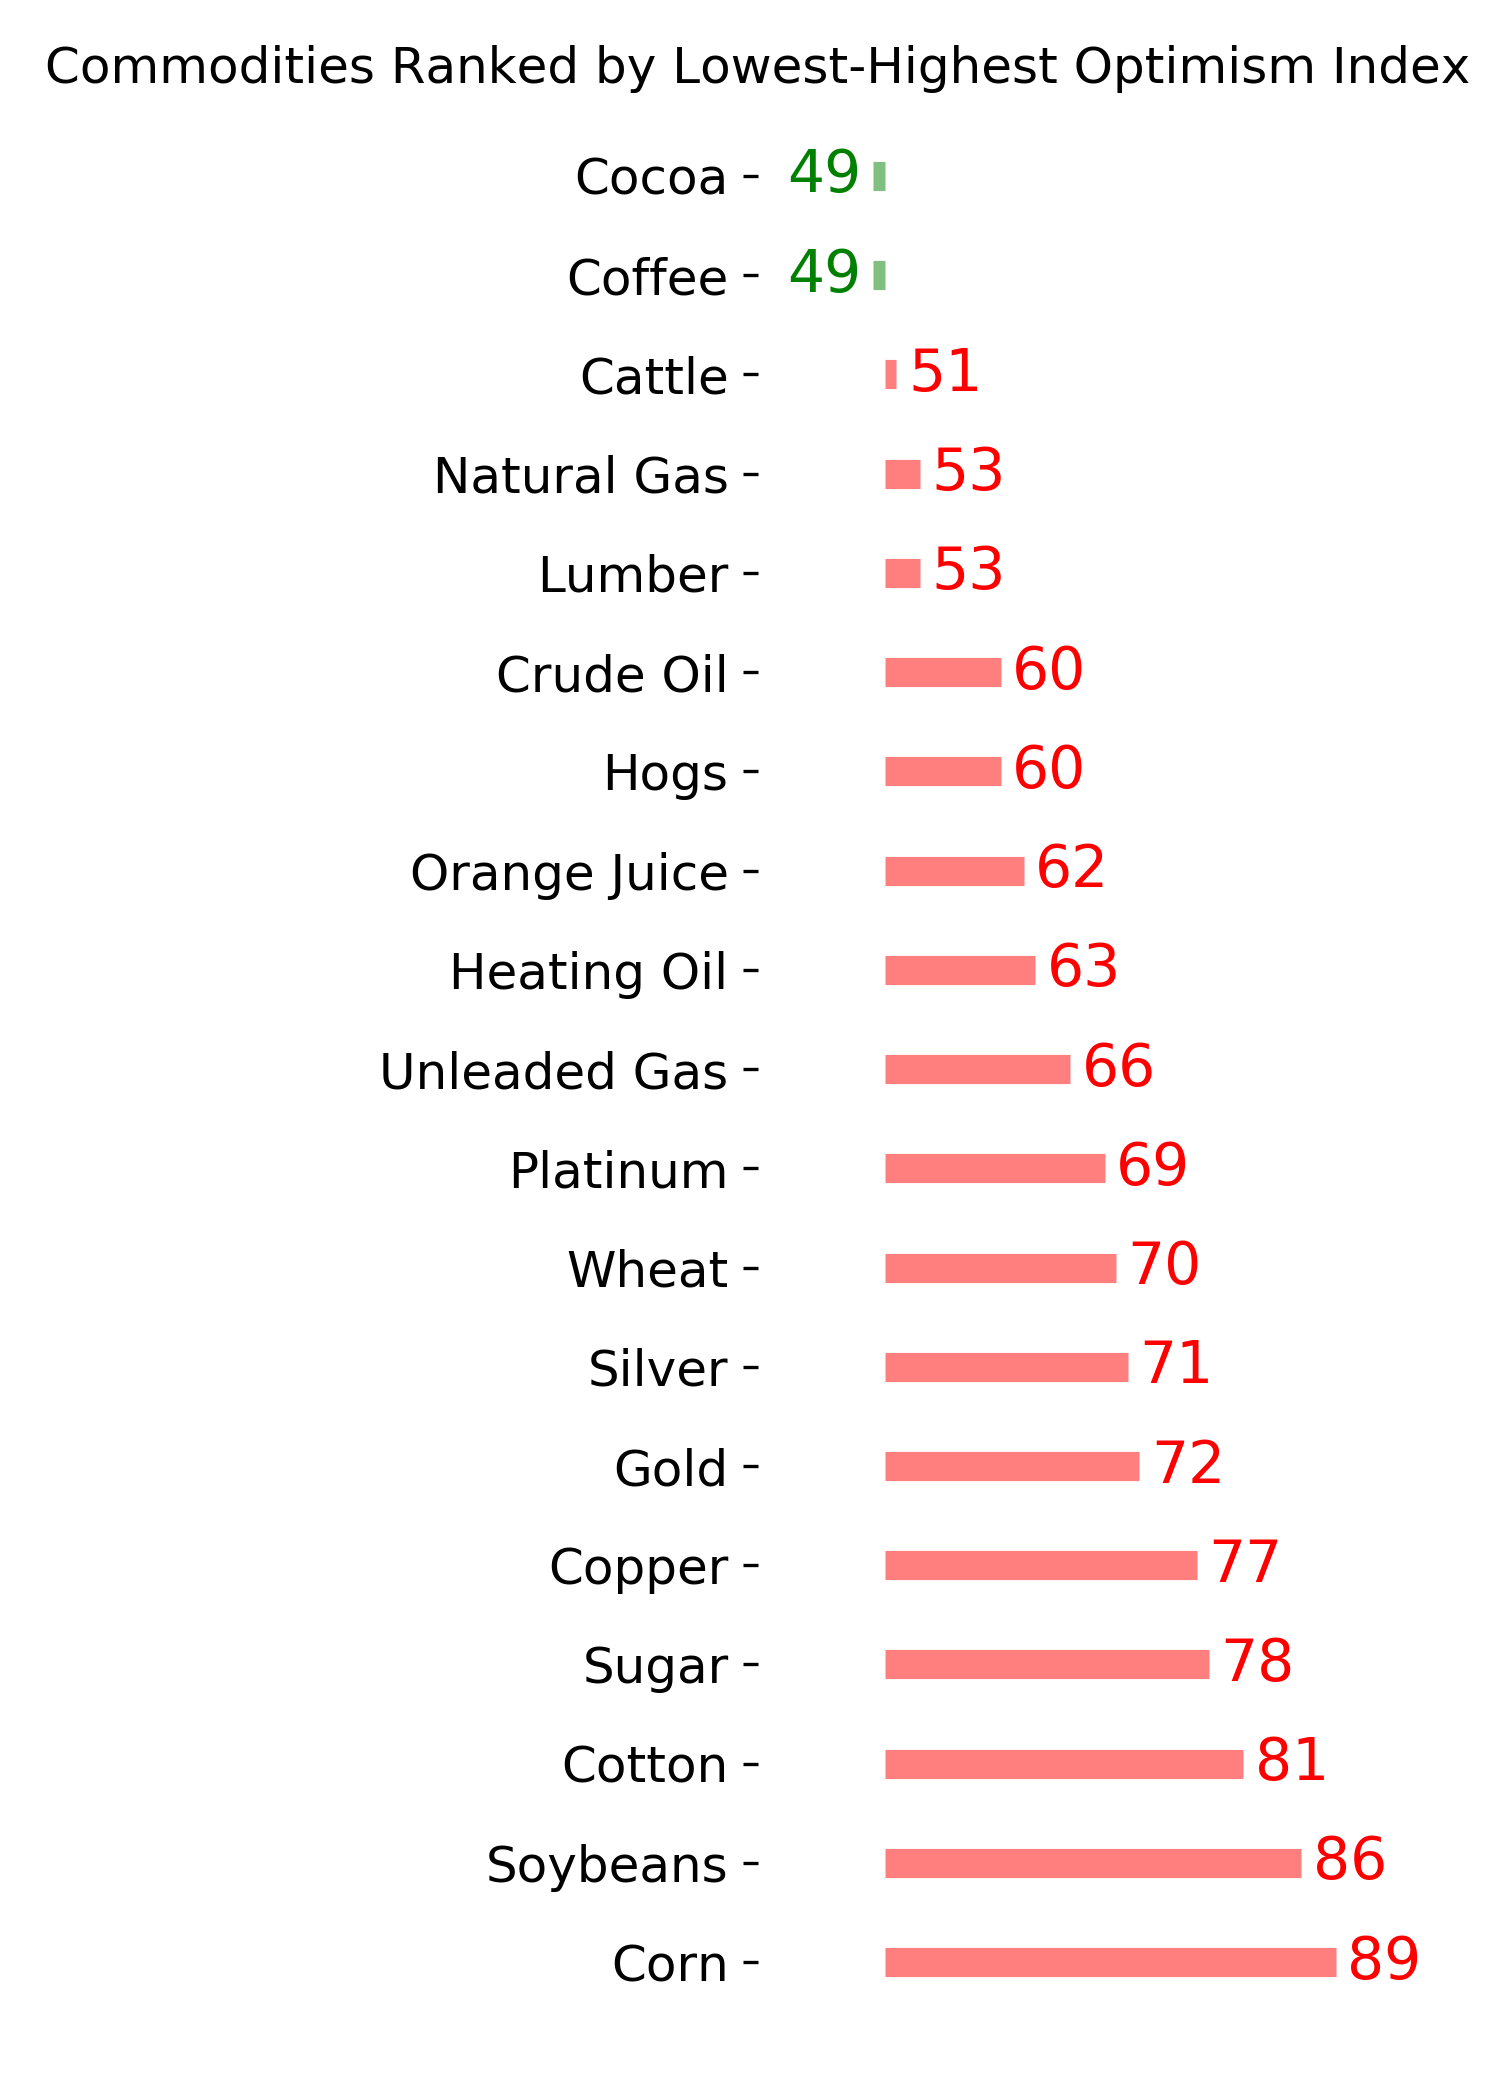
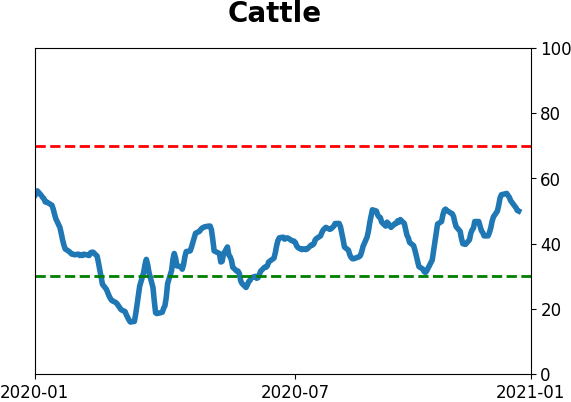
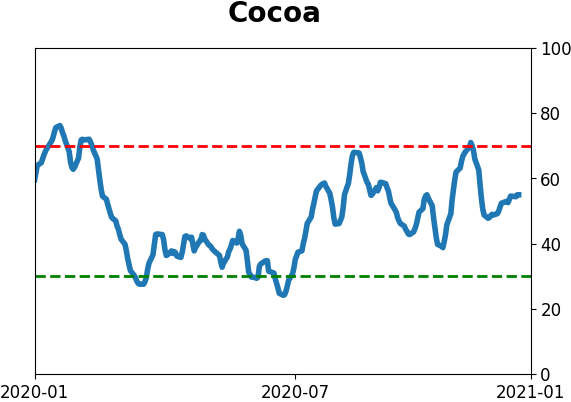
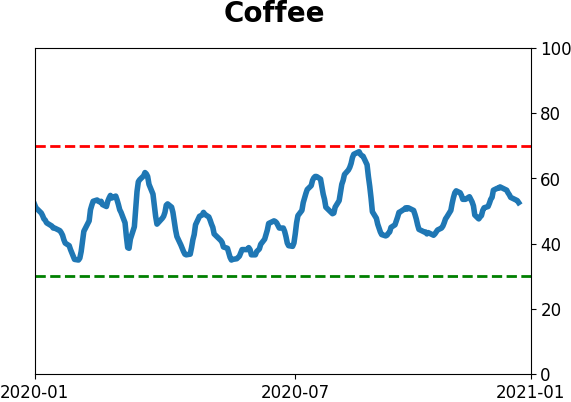
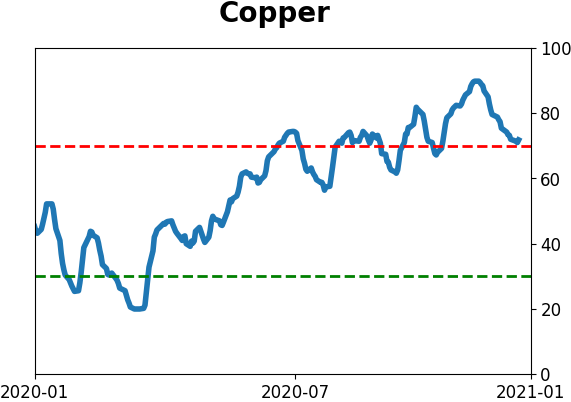
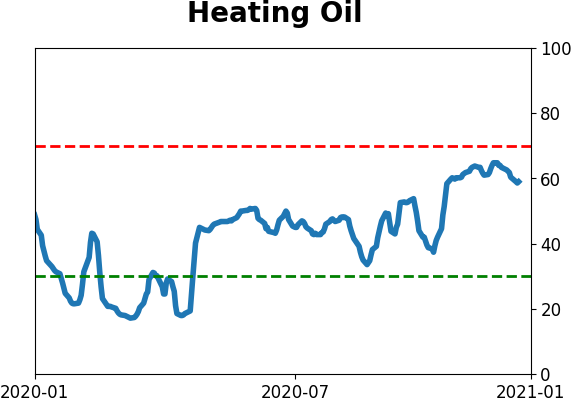
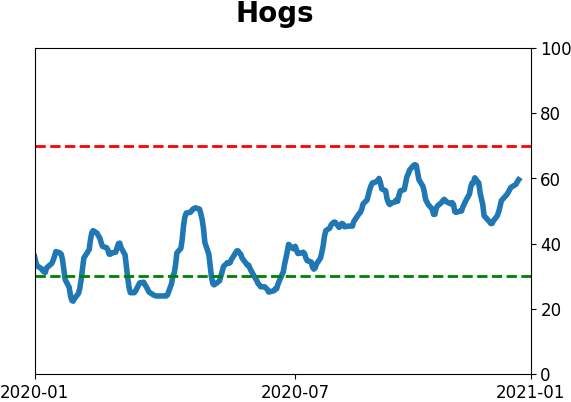
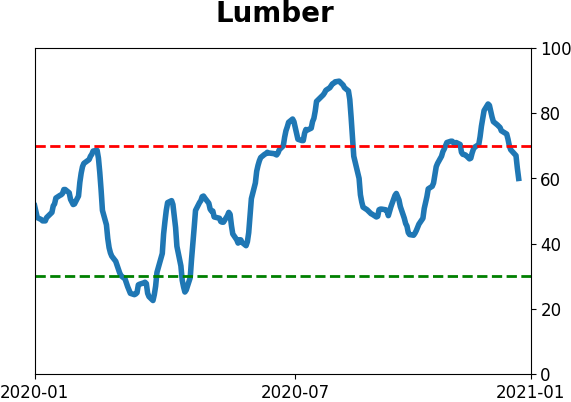
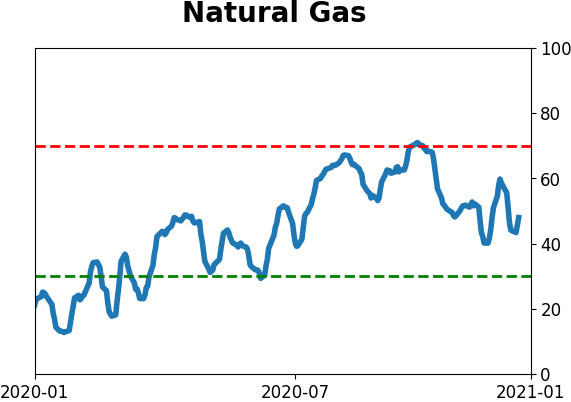
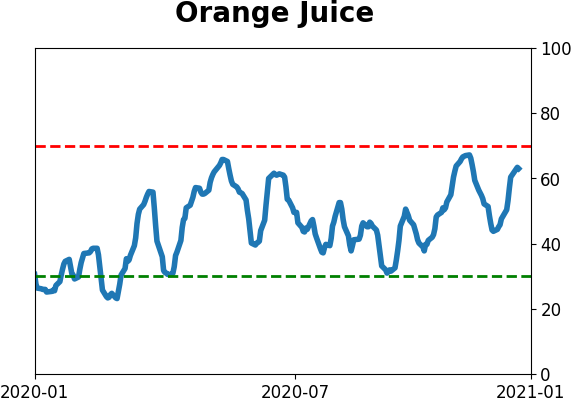
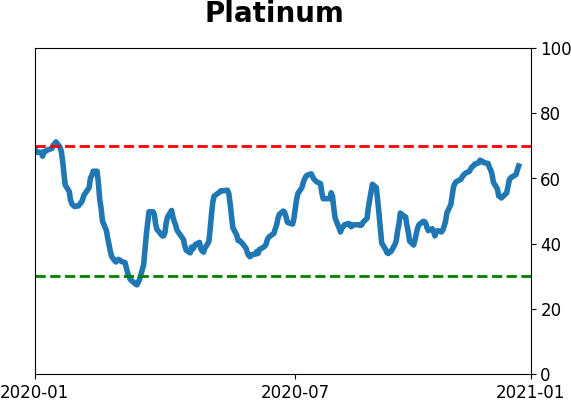
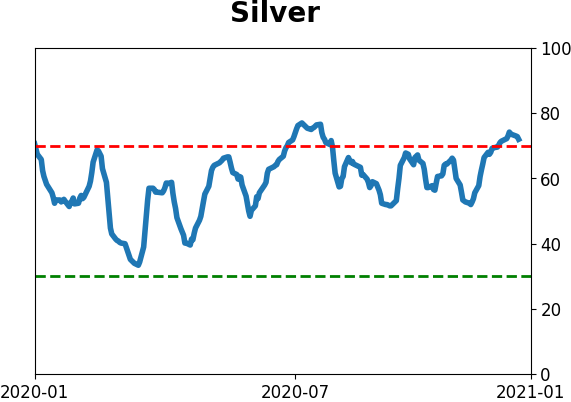
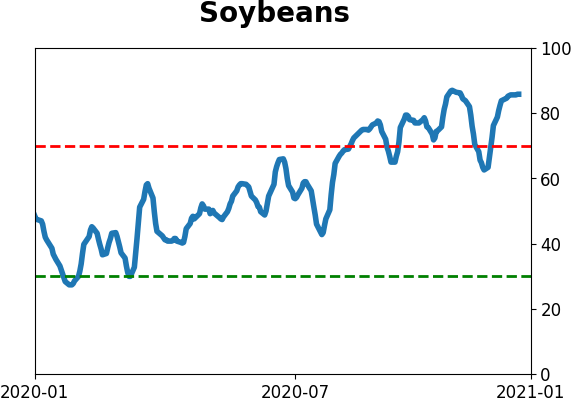
Commodity ETF's - 5-Day Moving Average
|
|