Headlines
|
|
Industrial stocks face headwinds:
Industrial stocks have enjoyed a strong trend but there are some cracks starting to show, with a drop in member stocks trading above their 50-day averages, a lack of insider buying, high optimism among Twitter users, and even a rise in manufacturing activity hasn't tended to help forward returns.
Russell is still raging: Today was the best-ever day for small-cap stocks. Never before has the Russell 2000 rallied so much on a day it scored an all-time high. The only date since 1979 when it jumped more than 3% at a record high was February 29, 2000, which obviously isn't a great precedent. Using total return (including dividends), it gets a little easier to see big gains, but even then today would go down as the greatest of all time. Of the 15 other times since 1926 when a total return small-cap index rose more than 2.5% to an all-time high, it added to the gains over the next week 73% of the time, but 3 months later was positive only 57% of the time, averaging +2.3%.
Bottom Line:
- The market environment is pristine, but with near-historic optimism, gains tend to be muted, with a high probability of being reversed at some point over the ensuing weeks.
|
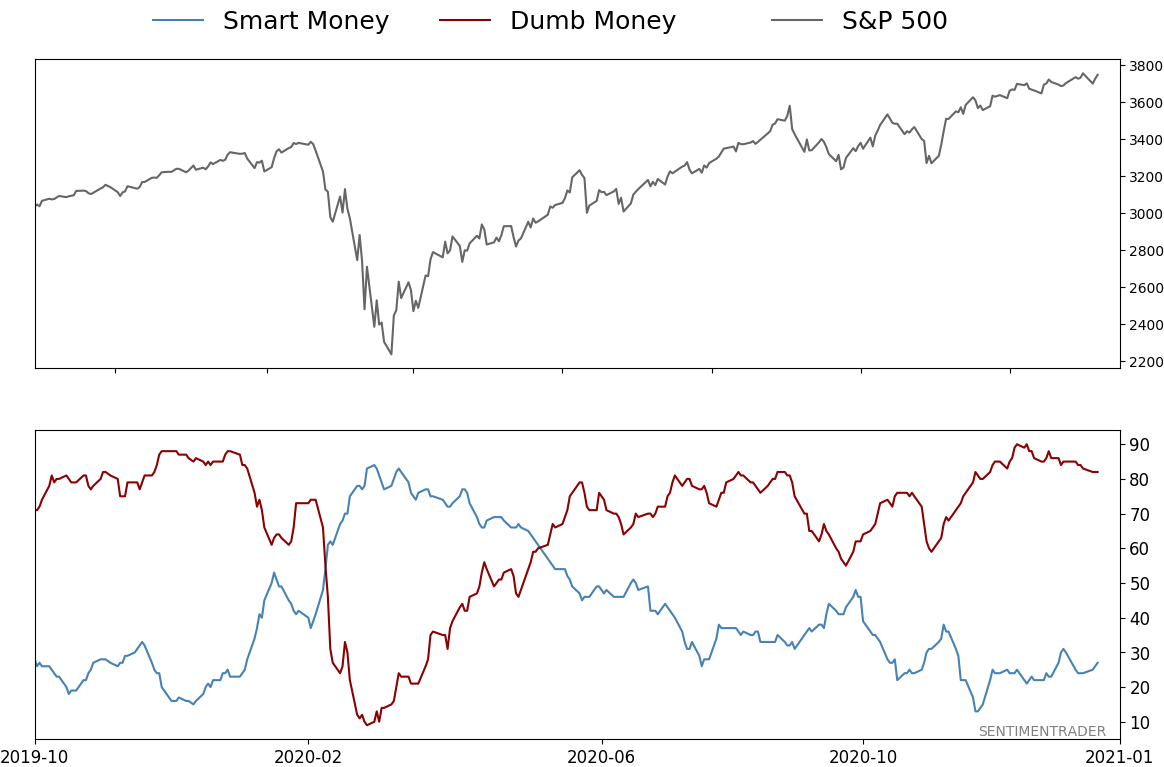
Smart / Dumb Money Confidence
|
Smart Money Confidence: 27%
Dumb Money Confidence: 82%
|
|
Risk Levels
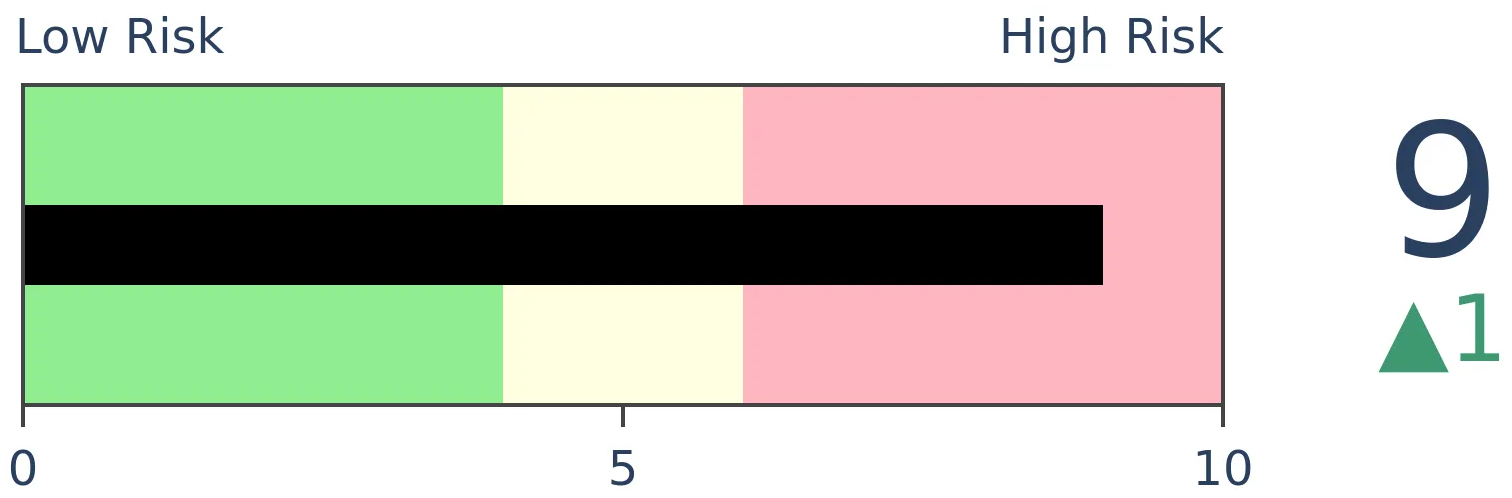
Stocks Short-Term
|
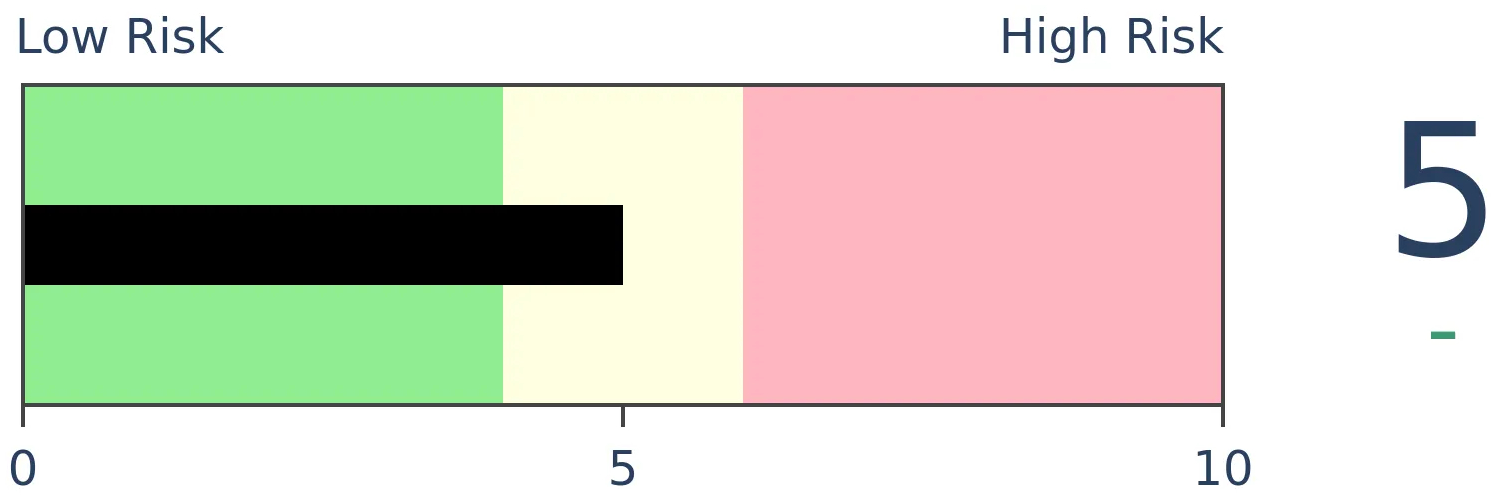
Stocks Medium-Term
|
|
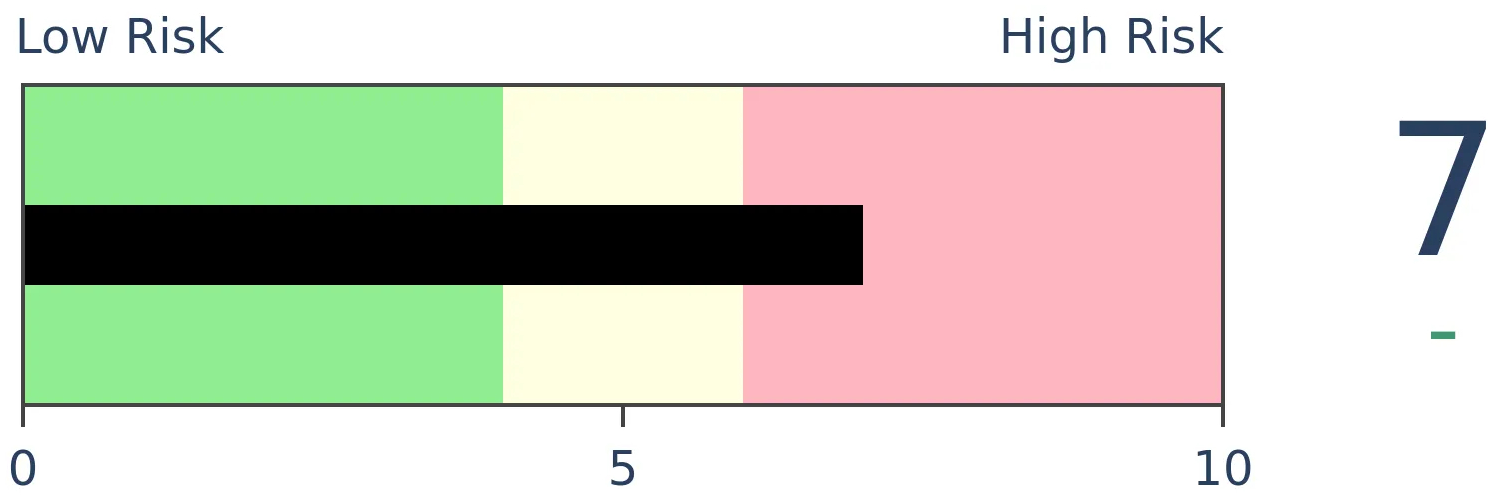
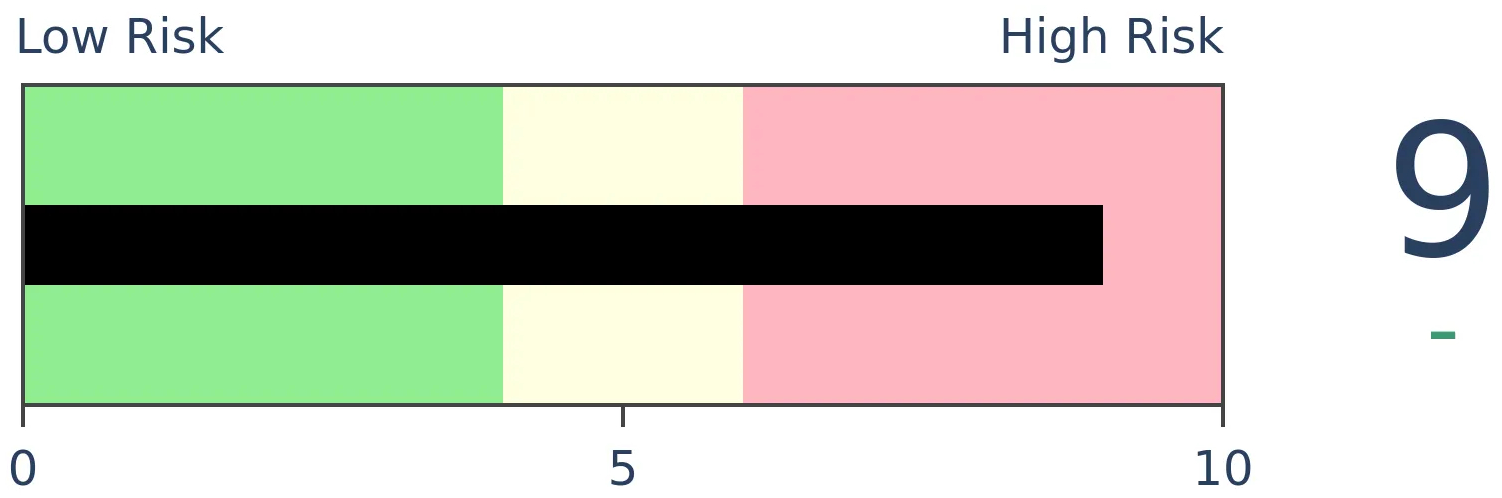
Bonds
|
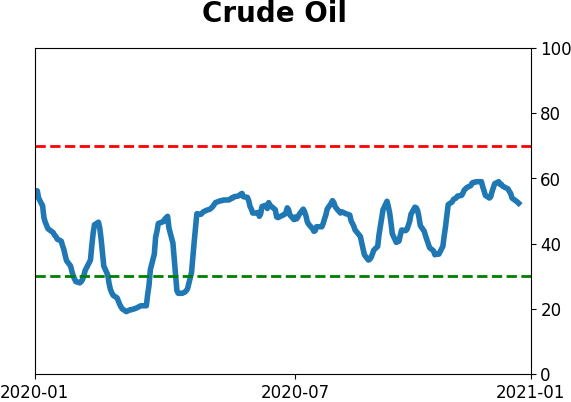
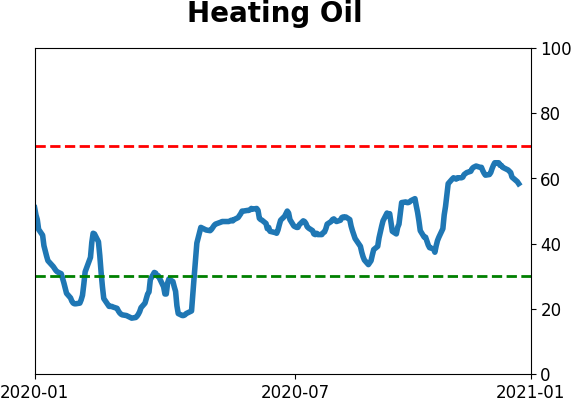
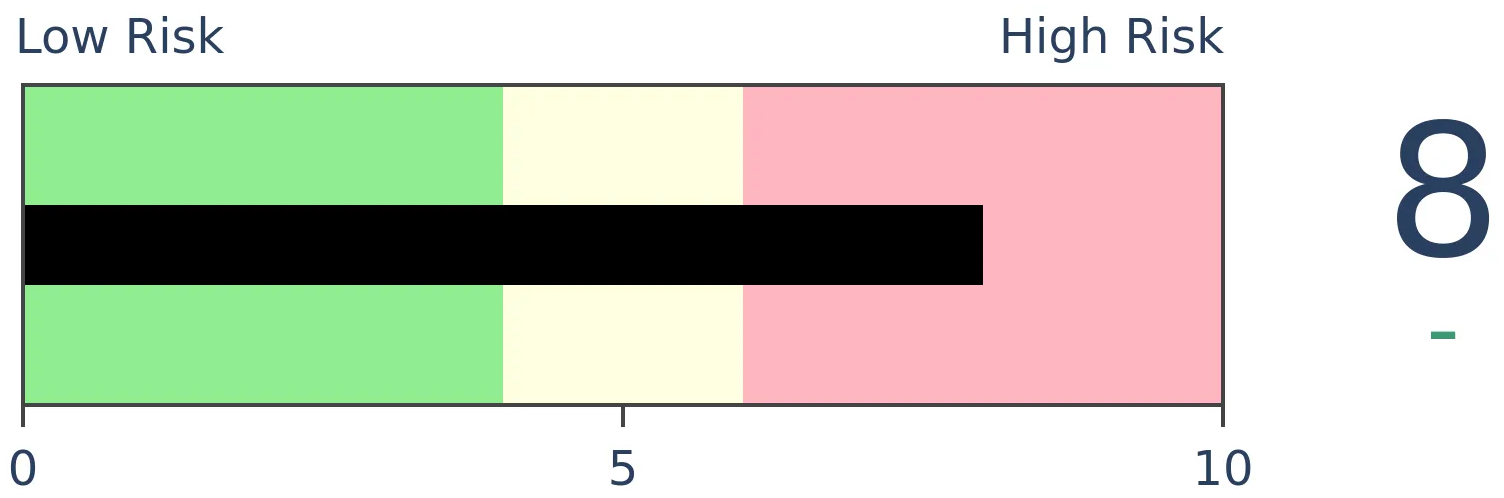
Crude Oil
|
|
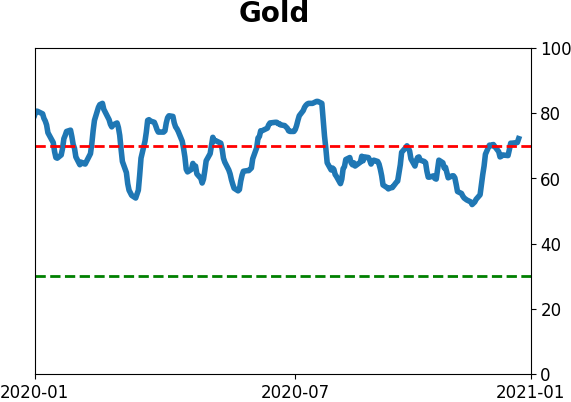
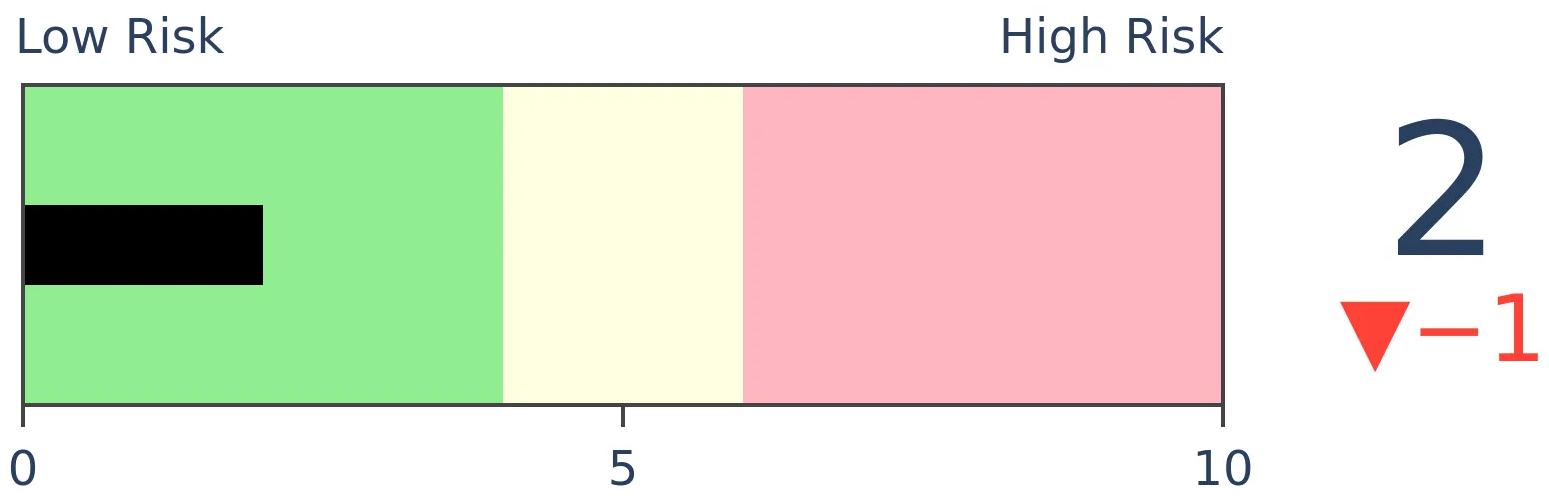
Gold
|
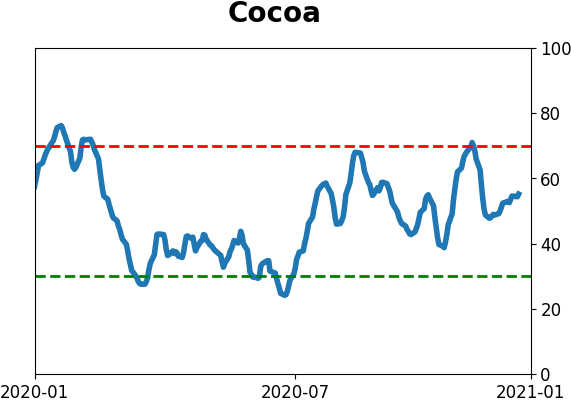
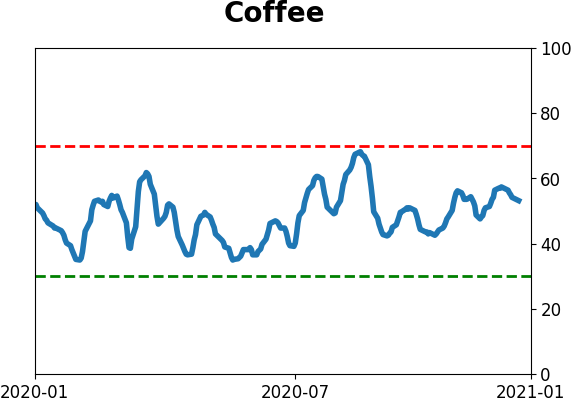
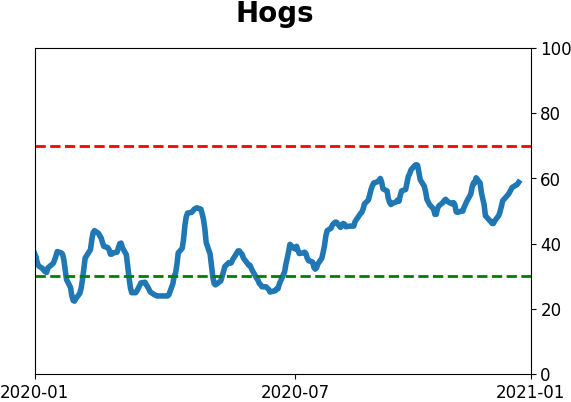
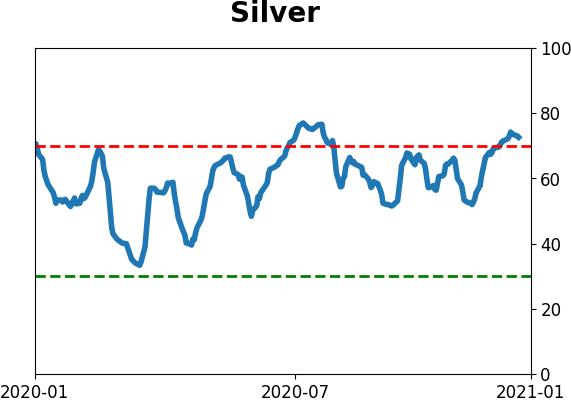
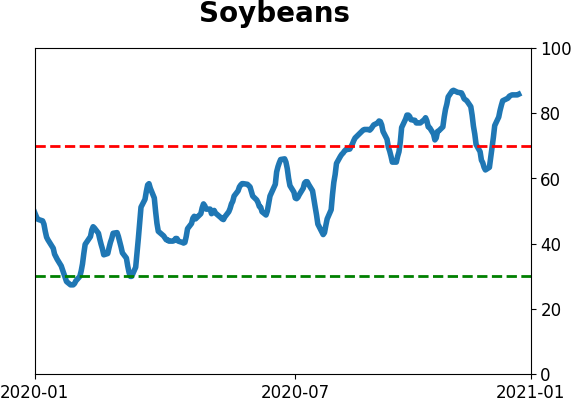
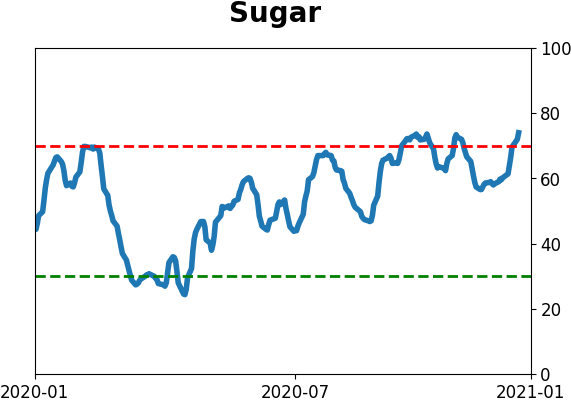
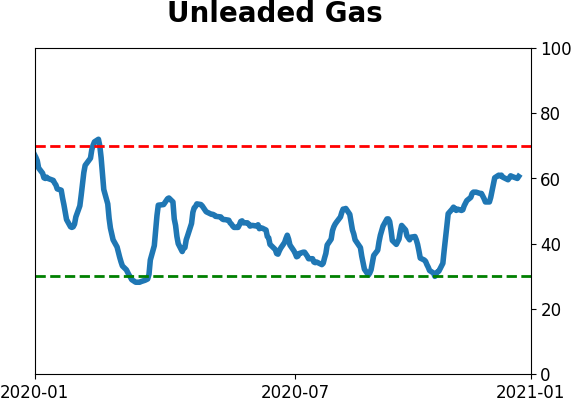
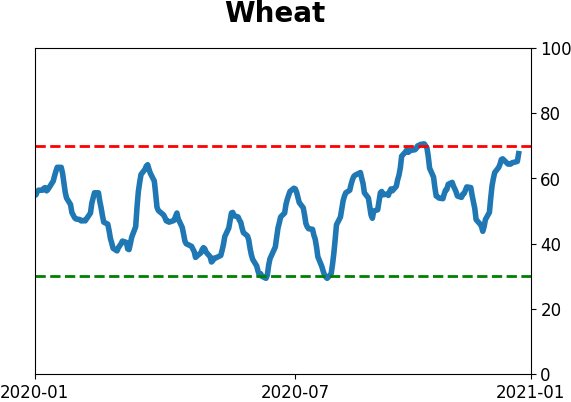
Agriculture
|
|
Research
BOTTOM LINE
Industrial stocks have enjoyed a strong trend but there are some cracks starting to show, with a drop in member stocks trading above their 50-day averages, a lack of insider buying, high optimism among Twitter users, and even a rise in manufacturing activity hasn't tended to help forward returns.
FORECAST / TIMEFRAME
None
|
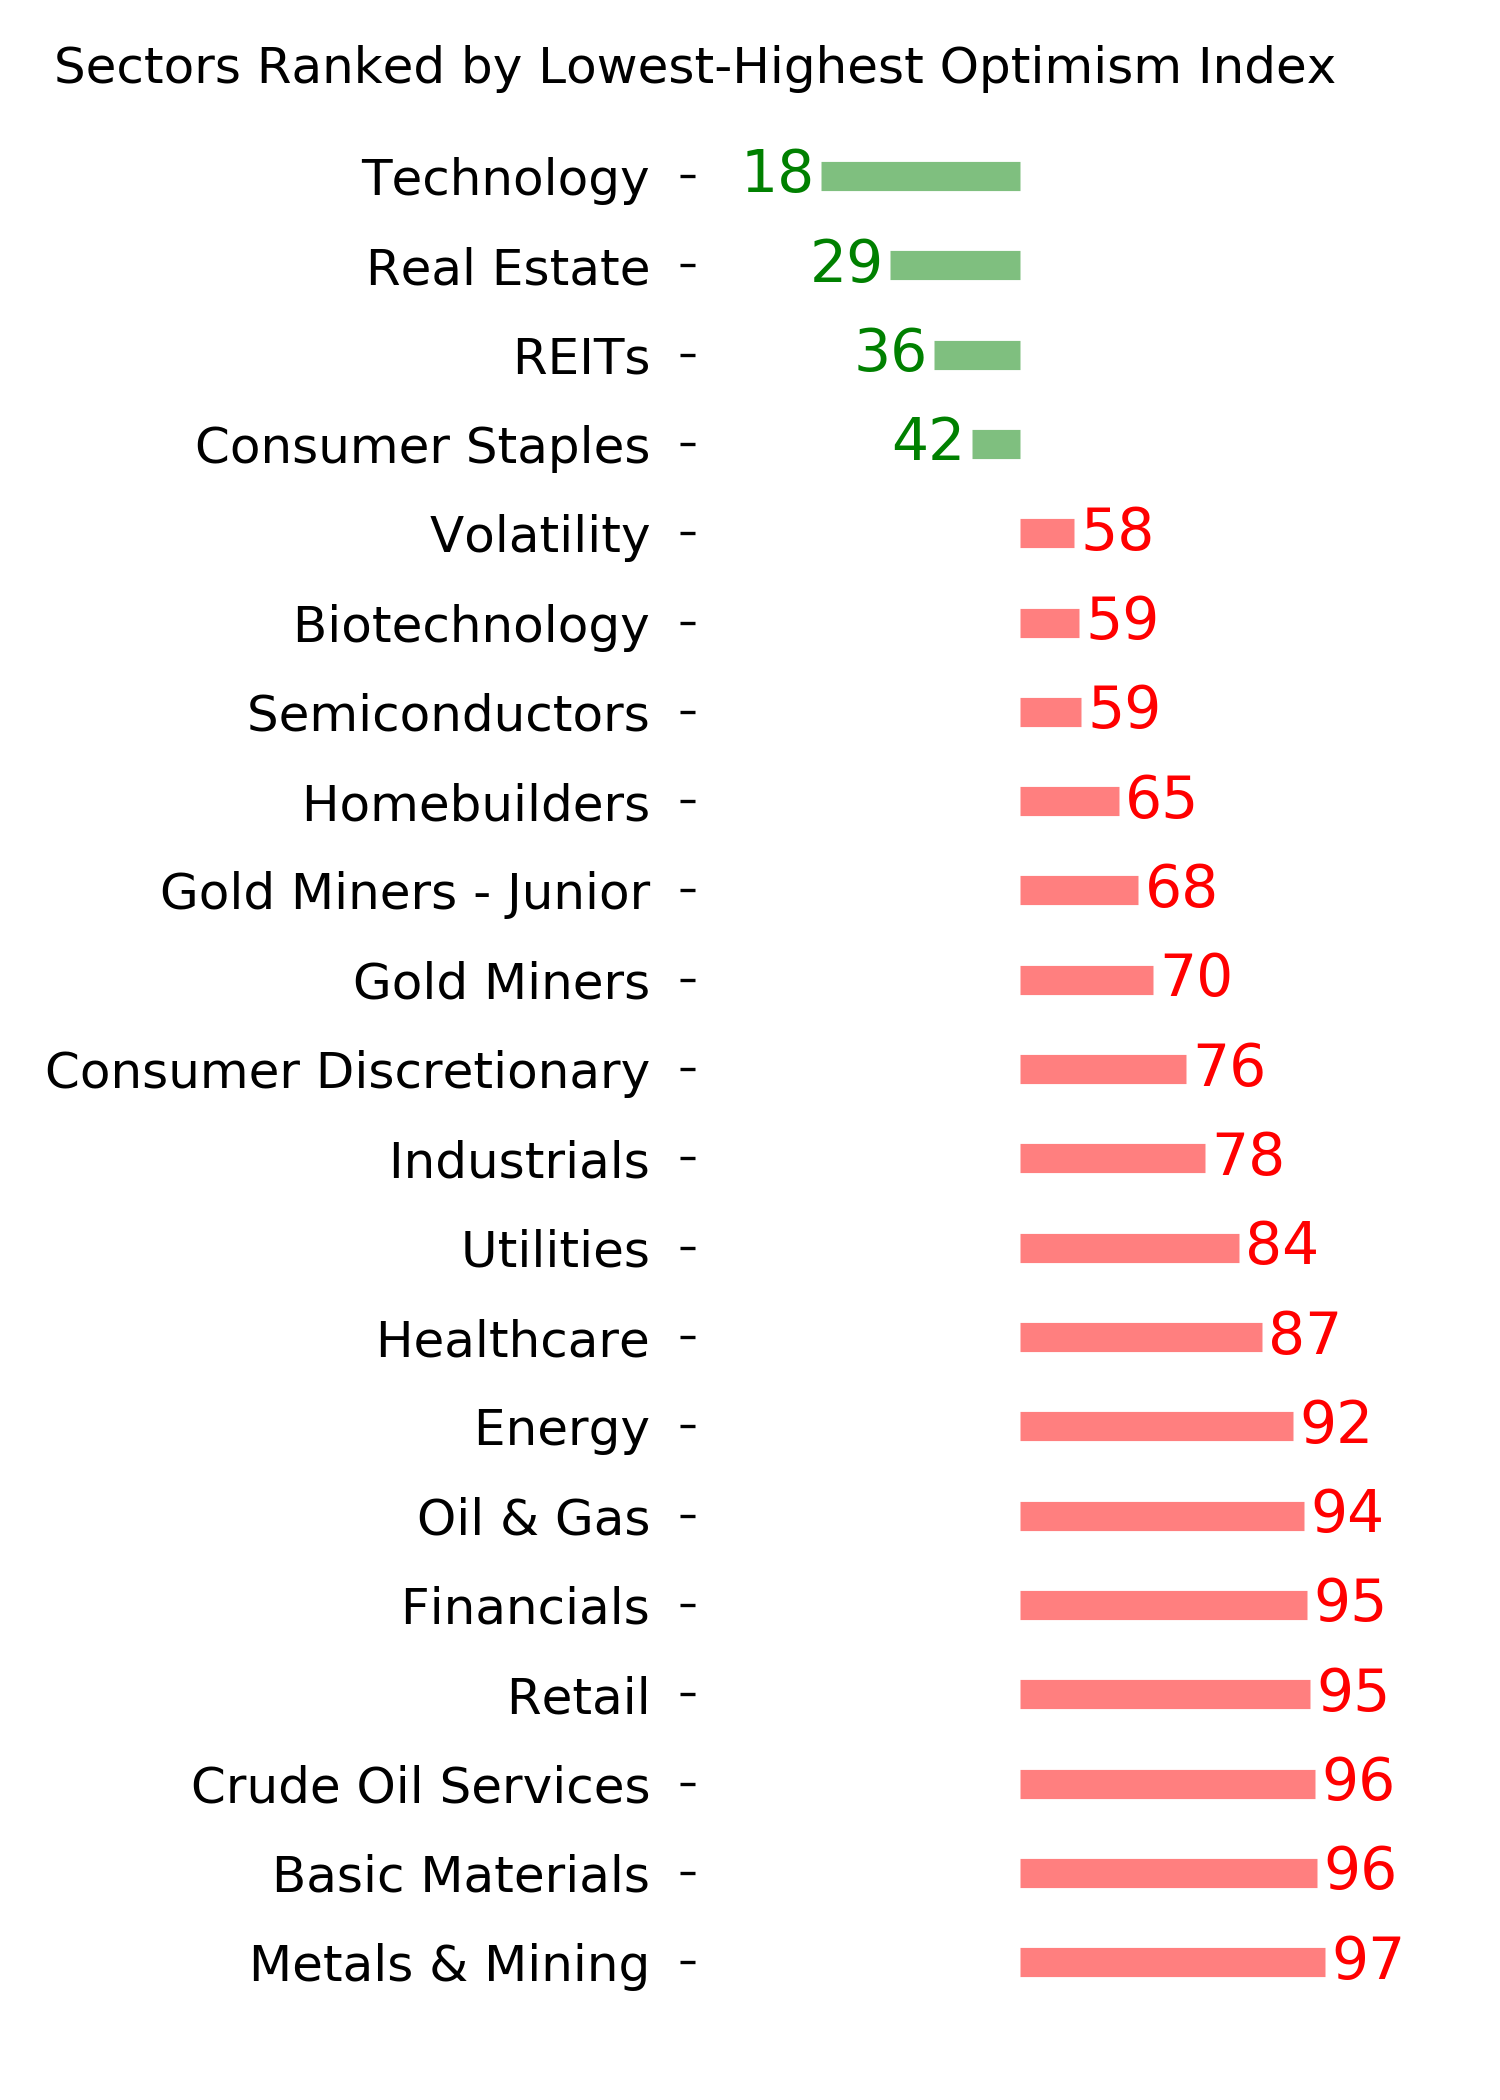
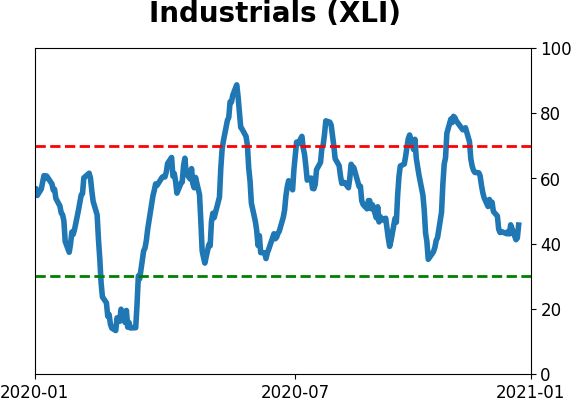
Industrial stocks have been one of the bright lights of the re-opening crowd, with investors focusing on them to potentially signal that the engine of commerce is really steaming. The knee-jerk reaction to the "blue wave" possibility is benefitting them as well.
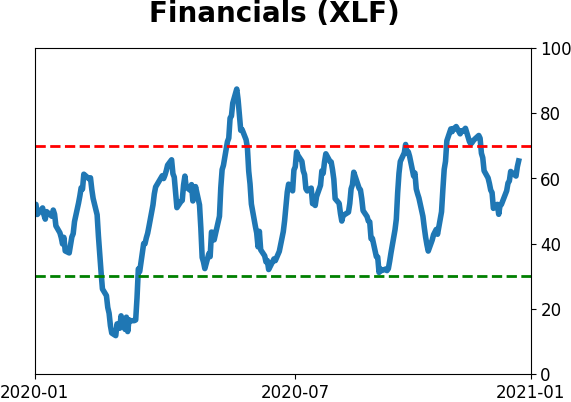
This comes after they suffered a hiccup to start the New Year. After months with an overwhelming majority of industrials holding above their medium-term trends, that dropped quite a bit as the calendar turned. For the first time in nearly 2 months, fewer than 70% of industrial stocks traded above their 50-day moving averages.
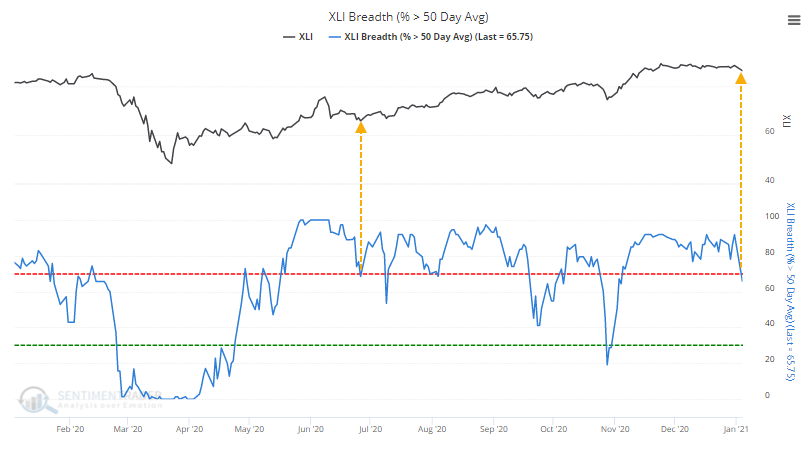
The last time the sector enjoyed an extended run with more than 70% of stocks above their 50-days, when it first dropped below 70%, the sector turned immediately and headed higher. Historically, it hasn't been quite so easy.
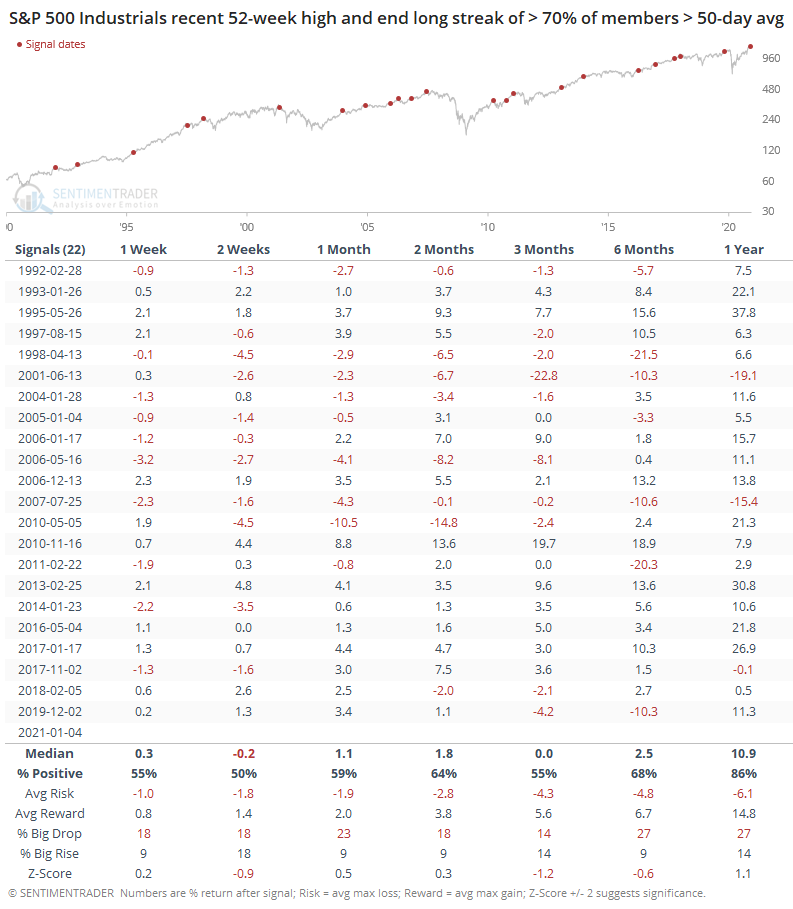
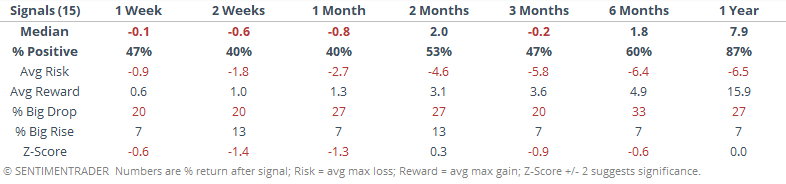
While the overall numbers are mixed, a lot of that is due to what environment we're looking at. Since 2013, these have served to be excellent buy signals.
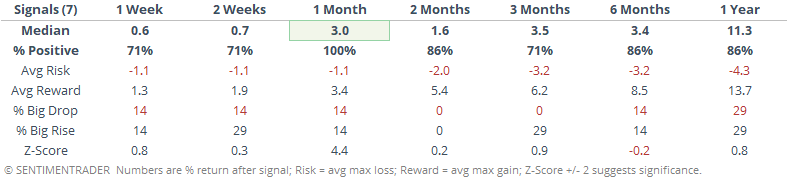
From 1990 - 2012, it was a different story. So, it depends on whether one thinks the last 7 years is more representative than the 23 years prior to that.
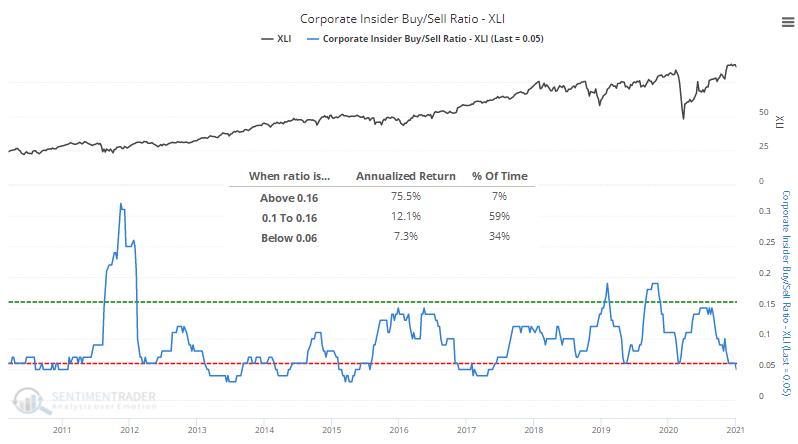
Another challenge is that corporate insiders have stepped away, with a very low Buy/Sell Ratio. Buy signals are almost always more consistent than sell signals when it comes to insider data, and this isn't any different. We wouldn't use a dearth of buying interest as an excuse to sell industrial stocks, but we can see the fairly dramatic difference in annualized returns in the chart below, depending on whether insiders are buying or selling. Not surprisingly, returns were considerably better when they were buying.
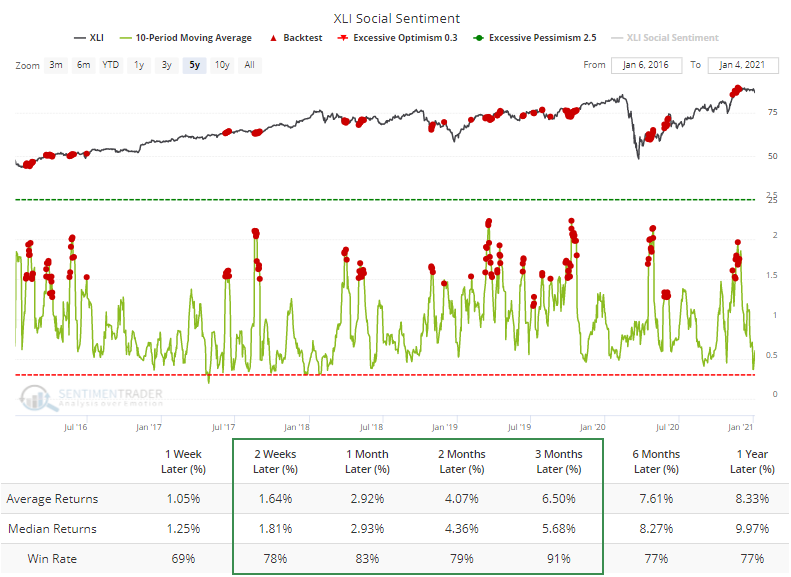
At the same time that insiders apparently aren't seeing enough value to buy shares aggressively, Twitter users do. Social Sentiment for XLI over the past 10 days has averaged more than 2 positive messages for every negative one, pushing it below 0.5 (Social Sentiment acts like a put/call ratio, with low ratios showing optimism).
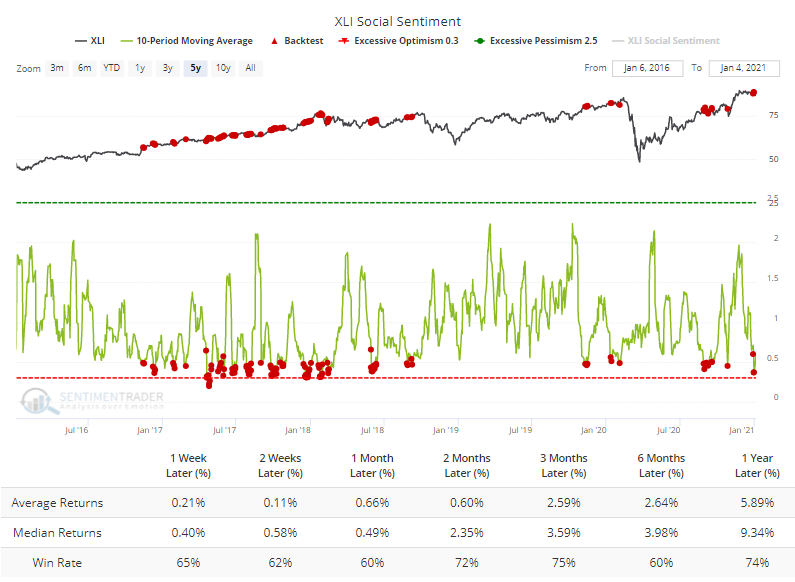
According to the Backtest Engine, forward returns weren't terrible when Twitter users were so positive, but XLI did show an average return that was barely positive up to 2 months later. Contrast that to times when tweets were more negative.
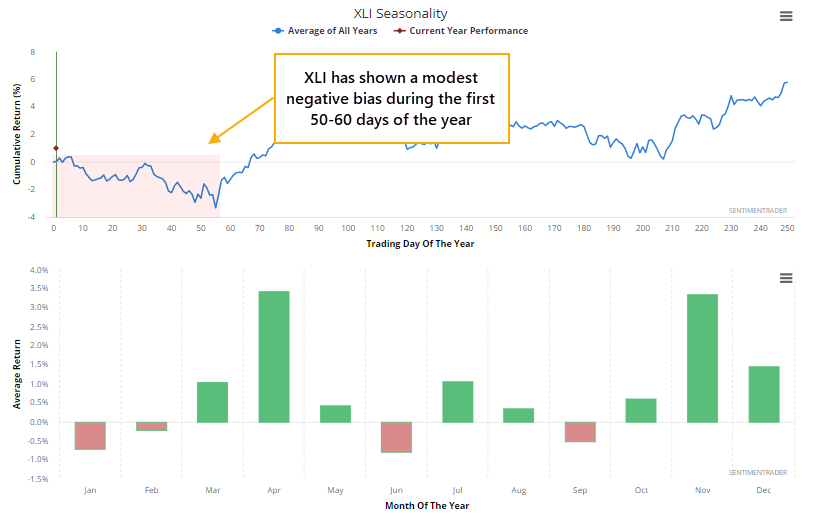
Unlike many other funds, XLI also doesn't have a very good seasonal window to start the new year.
The Wall Street Journal notes that manufacturing activity has rebounded, with the ISM Manufacturing PMI jumping above 60 for the first time in years. Per Investopedia:
"The ISM manufacturing index, also known as the purchasing managers' index (PMI), is a monthly indicator of U.S. economic activity based on a survey of purchasing managers at more than 300 manufacturing firms. It is considered to be a key indicator of the state of the U.S. economy."
This is the first time in more than 2 years that the survey has managed to rise above 60.
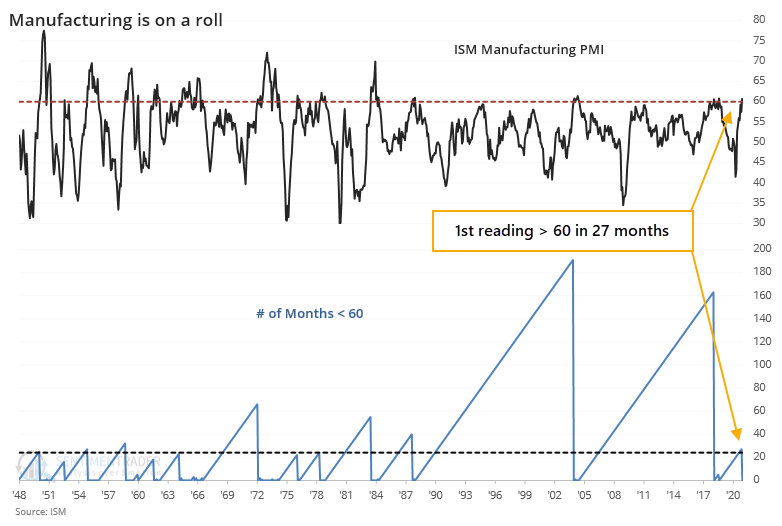
The ISM survey has a strong record at leading moves in Industrial Production, so fundamentally it looks like a strong positive for Industrial stocks. That wasn't really the case, though.
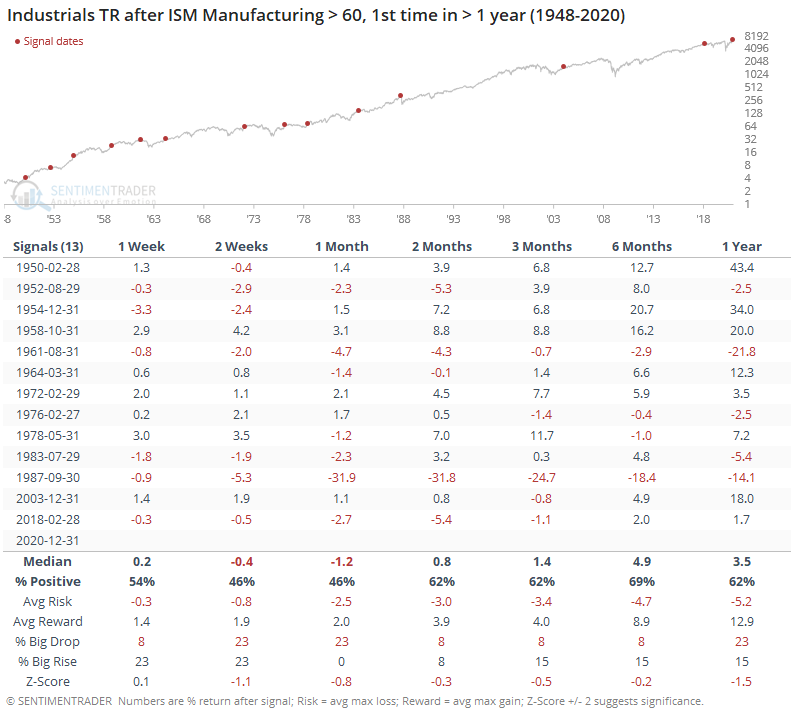
The returns in the table are total return - including dividends - so they will tend to be higher than price-only returns. Even so, the overall bias was "meh," with a median that was below random across almost every time frame.
Many sectors are showing strong trends, and Industrials haven't been much different. It has started to crack a bit, though, with some internal deterioration. There are other headwinds facing the sector at the moment, and the positive economic news isn't necessarily a strong counter-argument.
Active Studies
| Time Frame | Bullish | Bearish | | Short-Term | 0 | 0 | | Medium-Term | 2 | 1 | | Long-Term | 14 | 2 |
|
Indicators at Extremes
Portfolio
| Position | Description | Weight % | Added / Reduced | Date | | Stocks | 10.6% VWO, 10.1% XLE, 8.5% RSP, 8.3% PSCE | 37.5 | Added 3% | 2021-01-05 | | Bonds | 10% BND, 10% SCHP, 10% ANGL | 27.8 | Reduced 0.1% | 2020-10-02 | | Commodities | GCC | 2.3 | Reduced 2.1%
| 2020-09-04 | | Precious Metals | GDX | 9.8 | Added 4.8% | 2020-12-01 | | Special Situations | | 0.0 | Reduced 5% | 2020-10-02 | | Cash | | 22.6 | | |
|
Updates (Changes made today are underlined)
There hasn't been much that changed in recent weeks, with sky-high sentiment on many measures receding a bit, but that's not necessarily a good sign, just ask February 2020. We still have the lingering positives from all the breadth thrust last year, as late as October and November. Those have a very good historical record at preceding higher prices over a longer time frame. Of more immediate concern is the explosion in speculation in the most leveraged parts of the market. So far, that hasn't translated to price troubles, though there have been more oddities n the latter half of December than we'd seen since August, like the major indexes rising but on very poor breadth. I continue to avoid tech- and cap-heavy indexes, and don't see that changing any time soon. Energy stocks are doing what they should, and I added a bit more there. I'm not a momentum trader and do not focus on pyramiding positions in this account - it's more about protecting capital - but I like the setup on a long-term time frame. RETURN YTD: 2.8% 2020: 8.1%, 2019: 12.6%, 2018: 0.6%, 2017: 3.8%, 2016: 17.1%, 2015: 9.2%, 2014: 14.5%, 2013: 2.2%, 2012: 10.8%, 2011: 16.5%, 2010: 15.3%, 2009: 23.9%, 2008: 16.2%, 2007: 7.8%
|
|
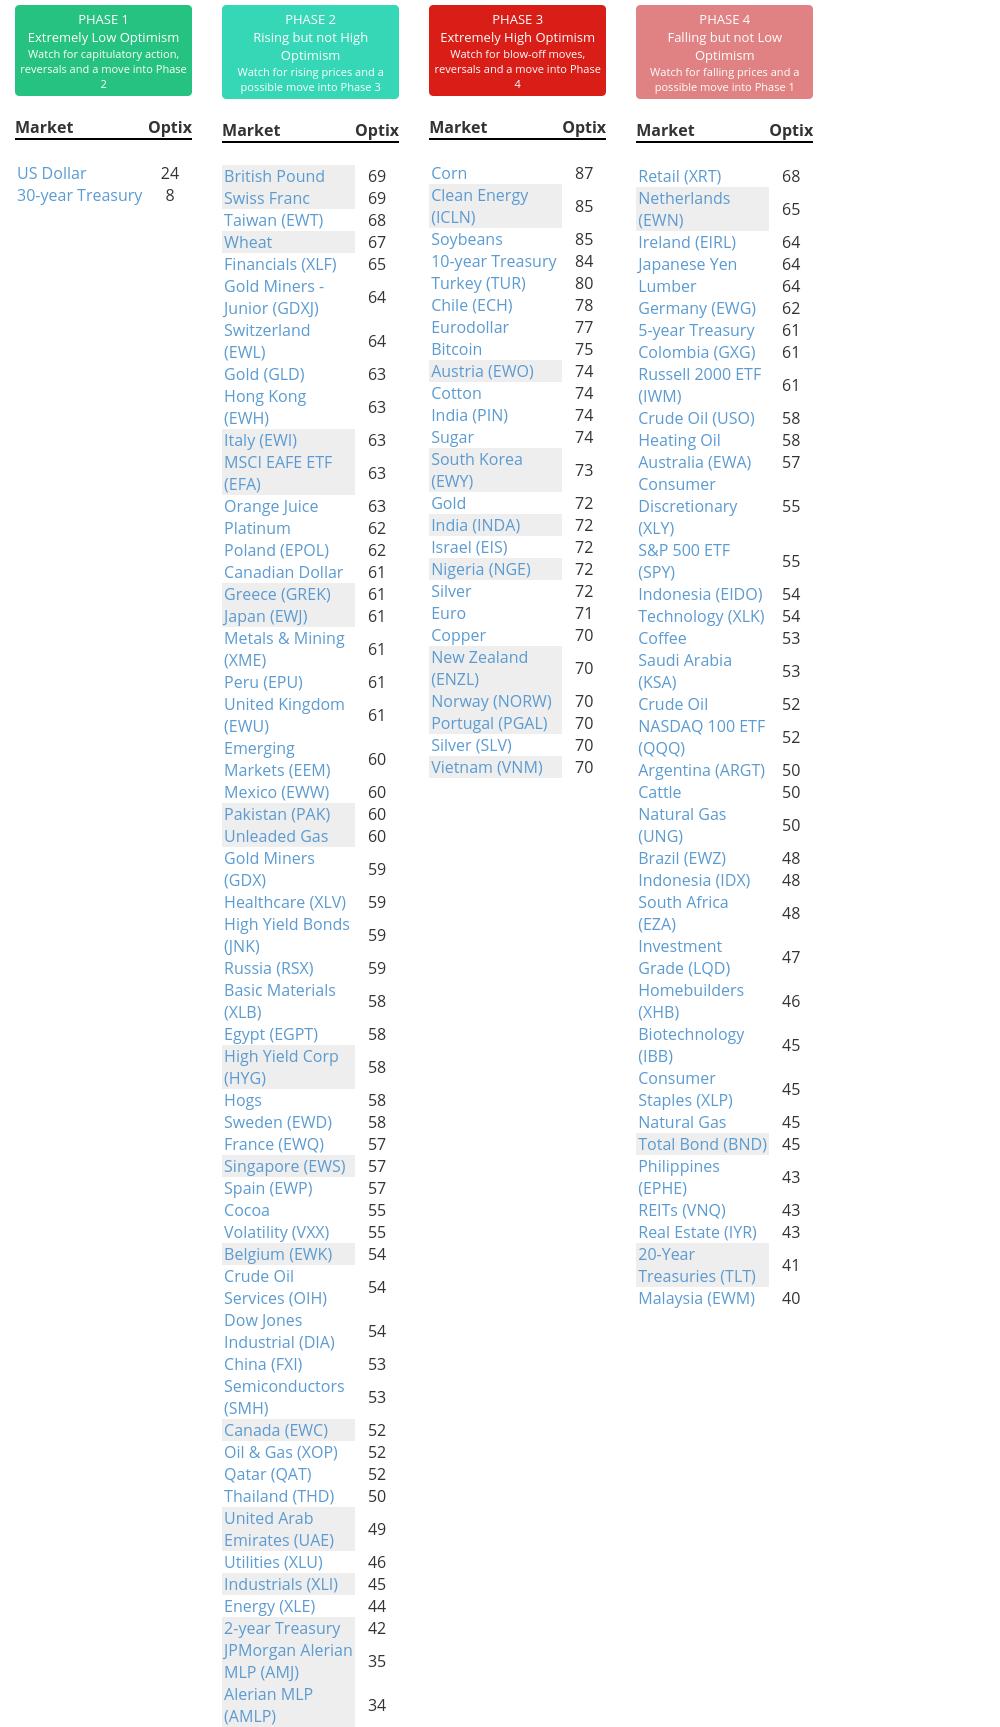
Phase Table
Ranks
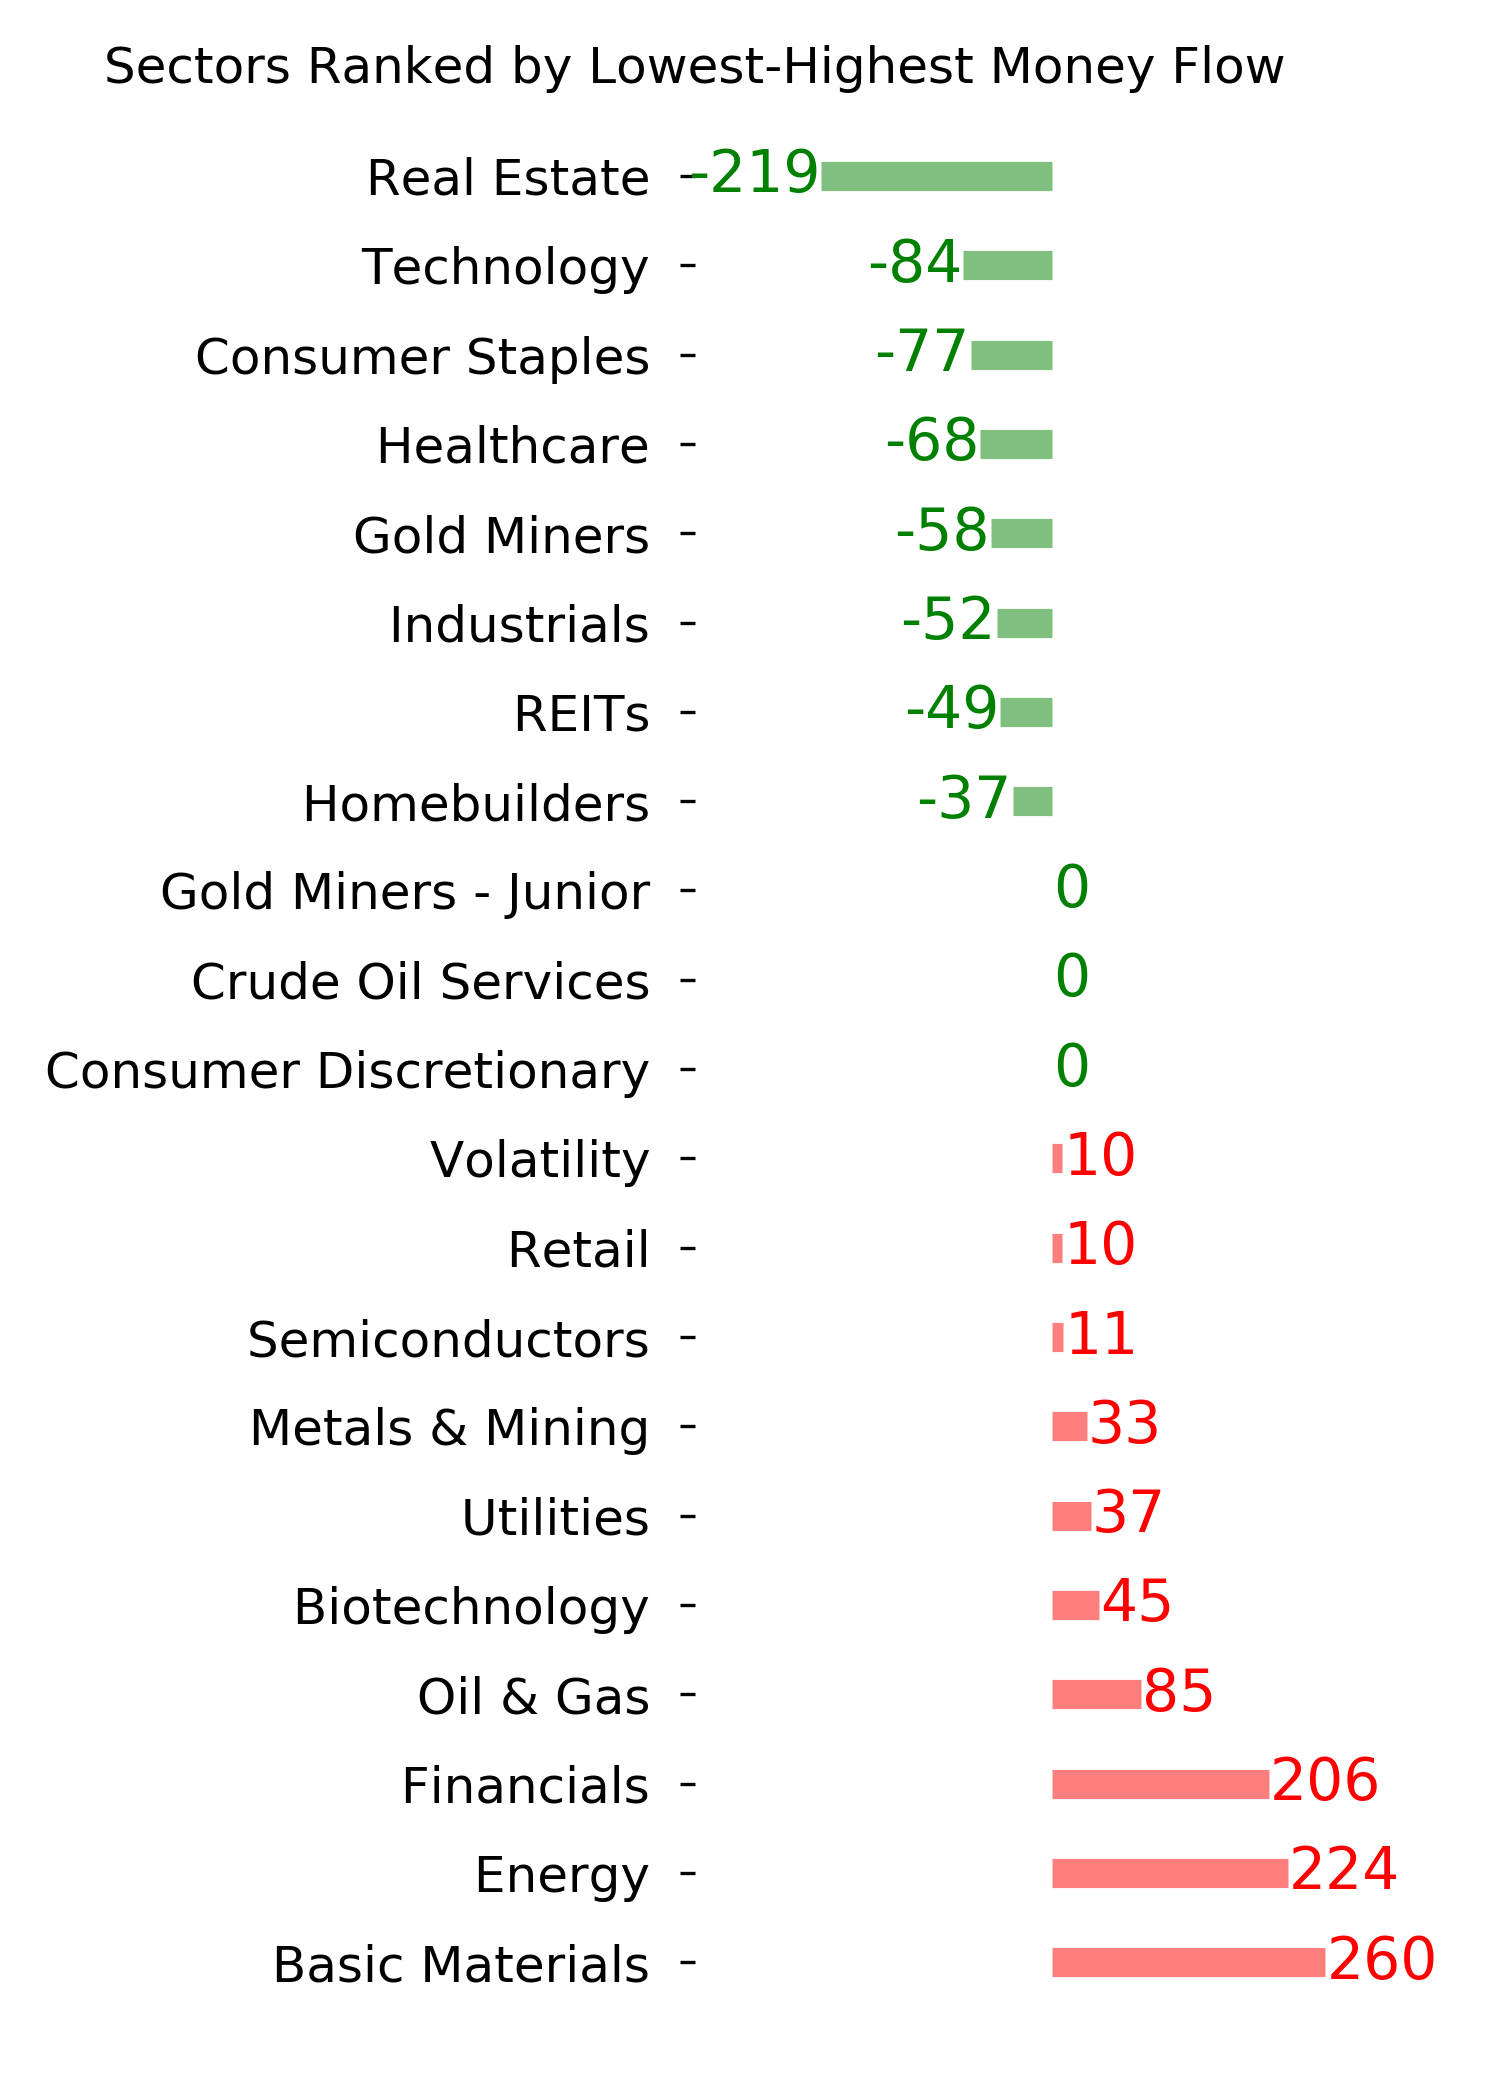
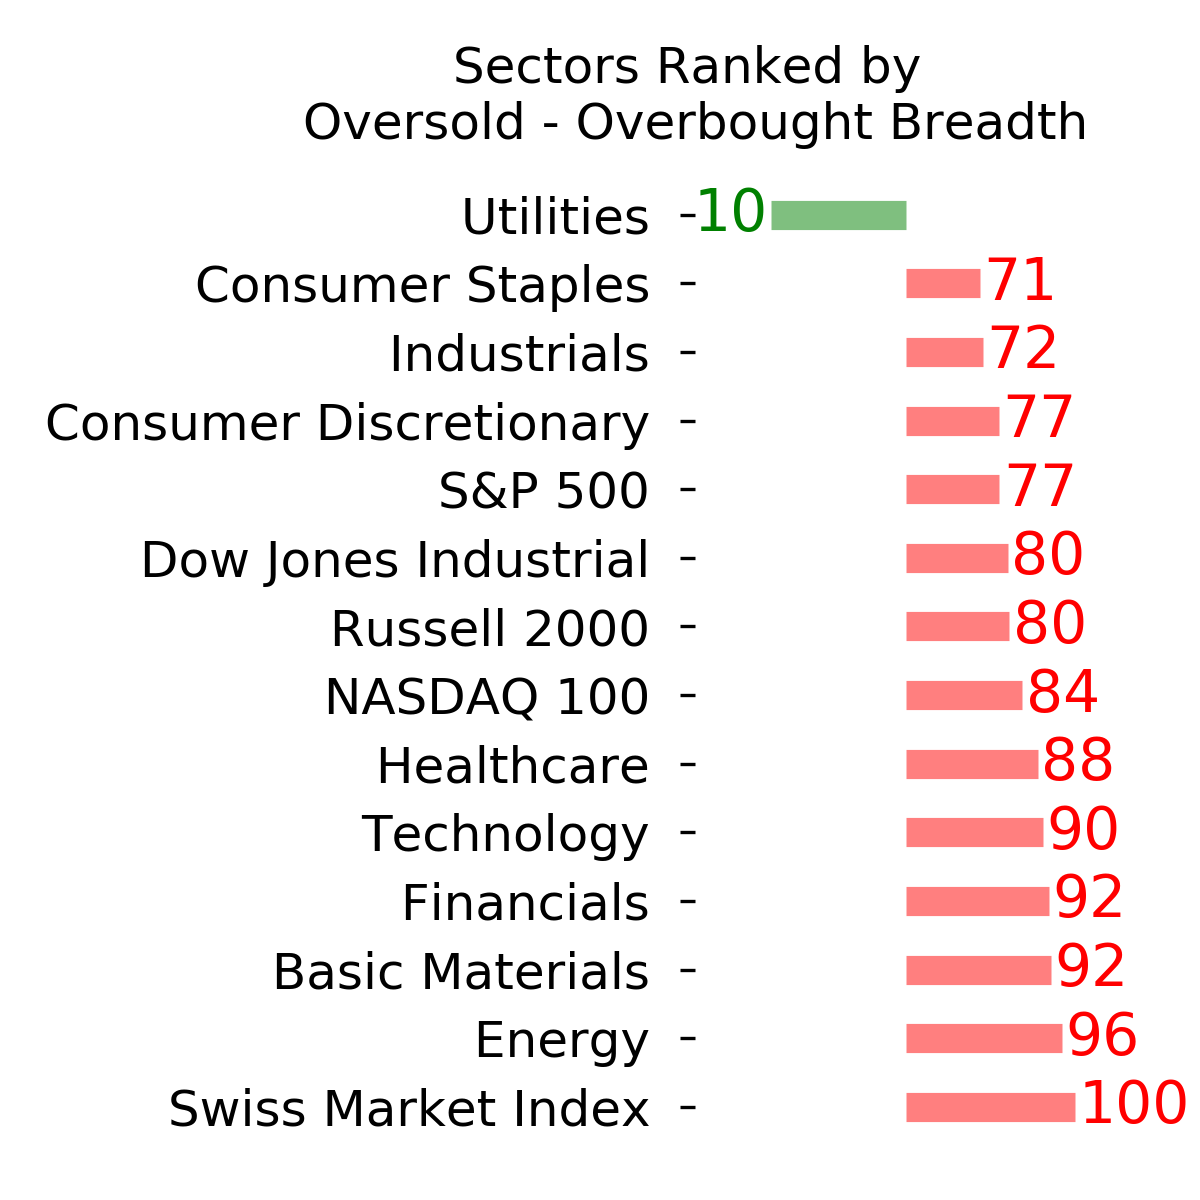
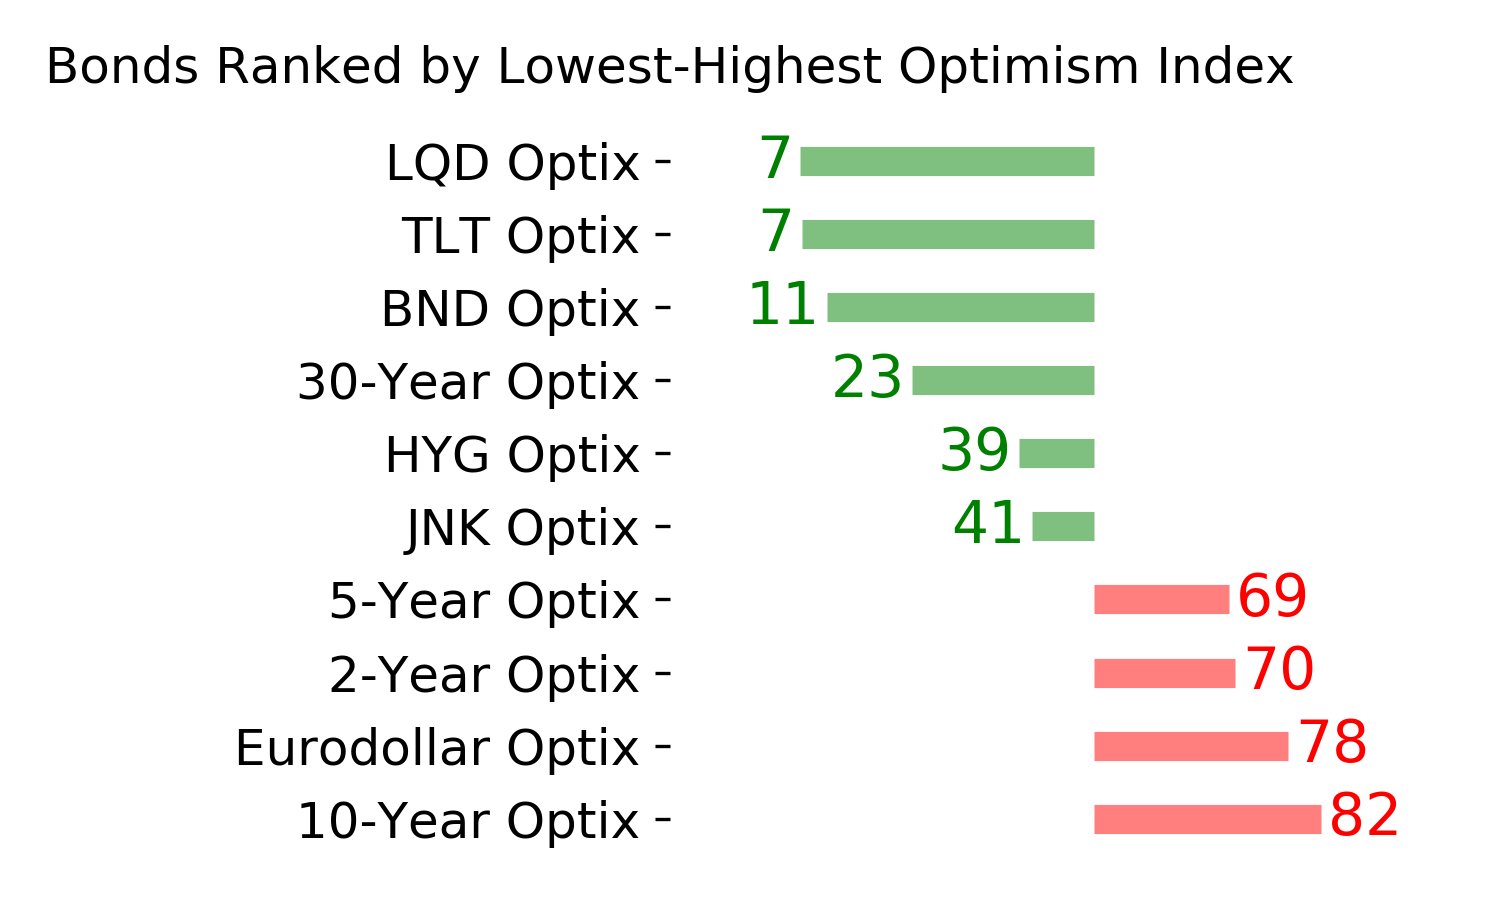
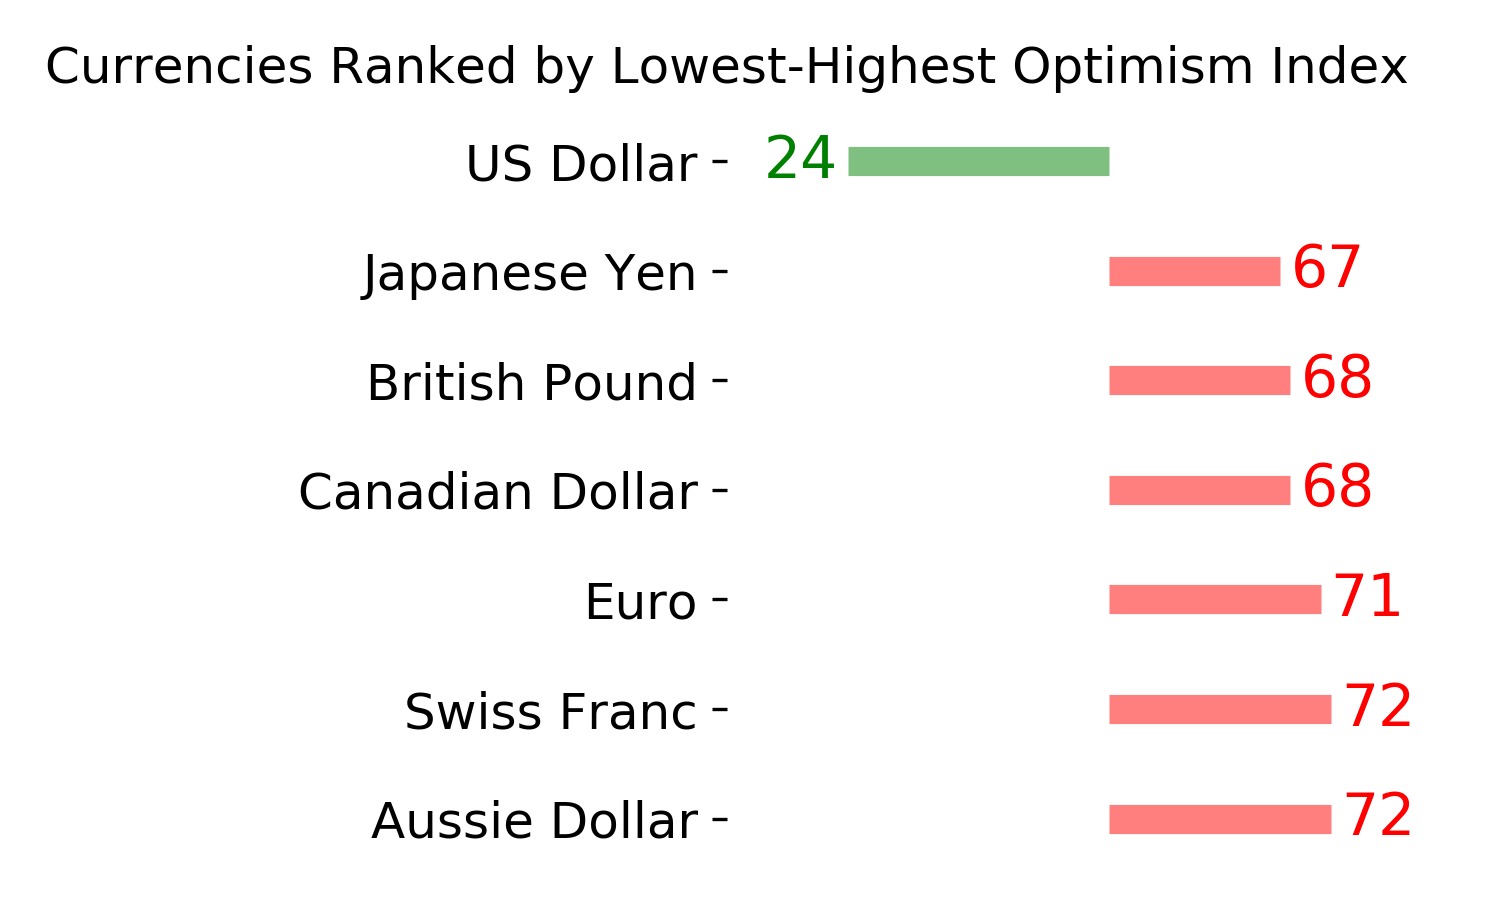
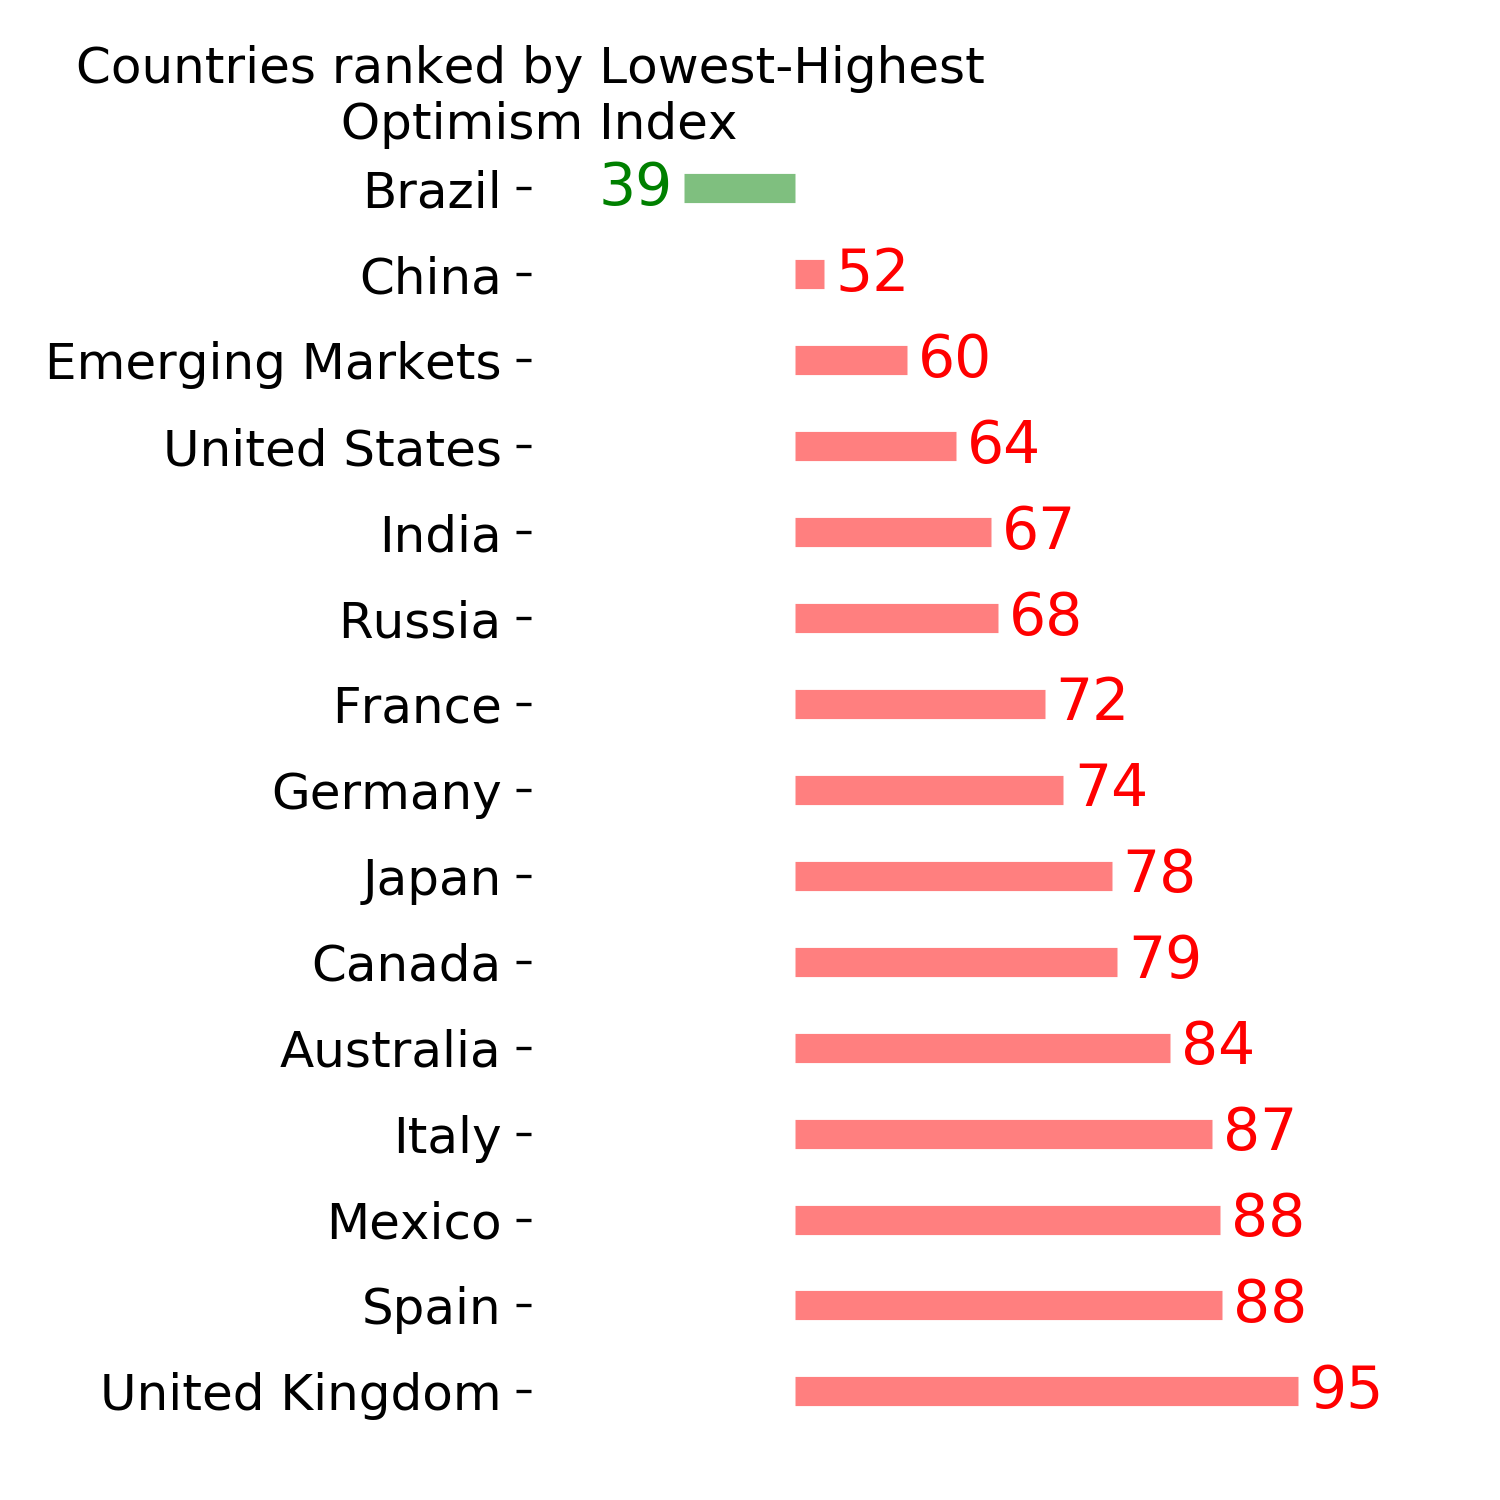
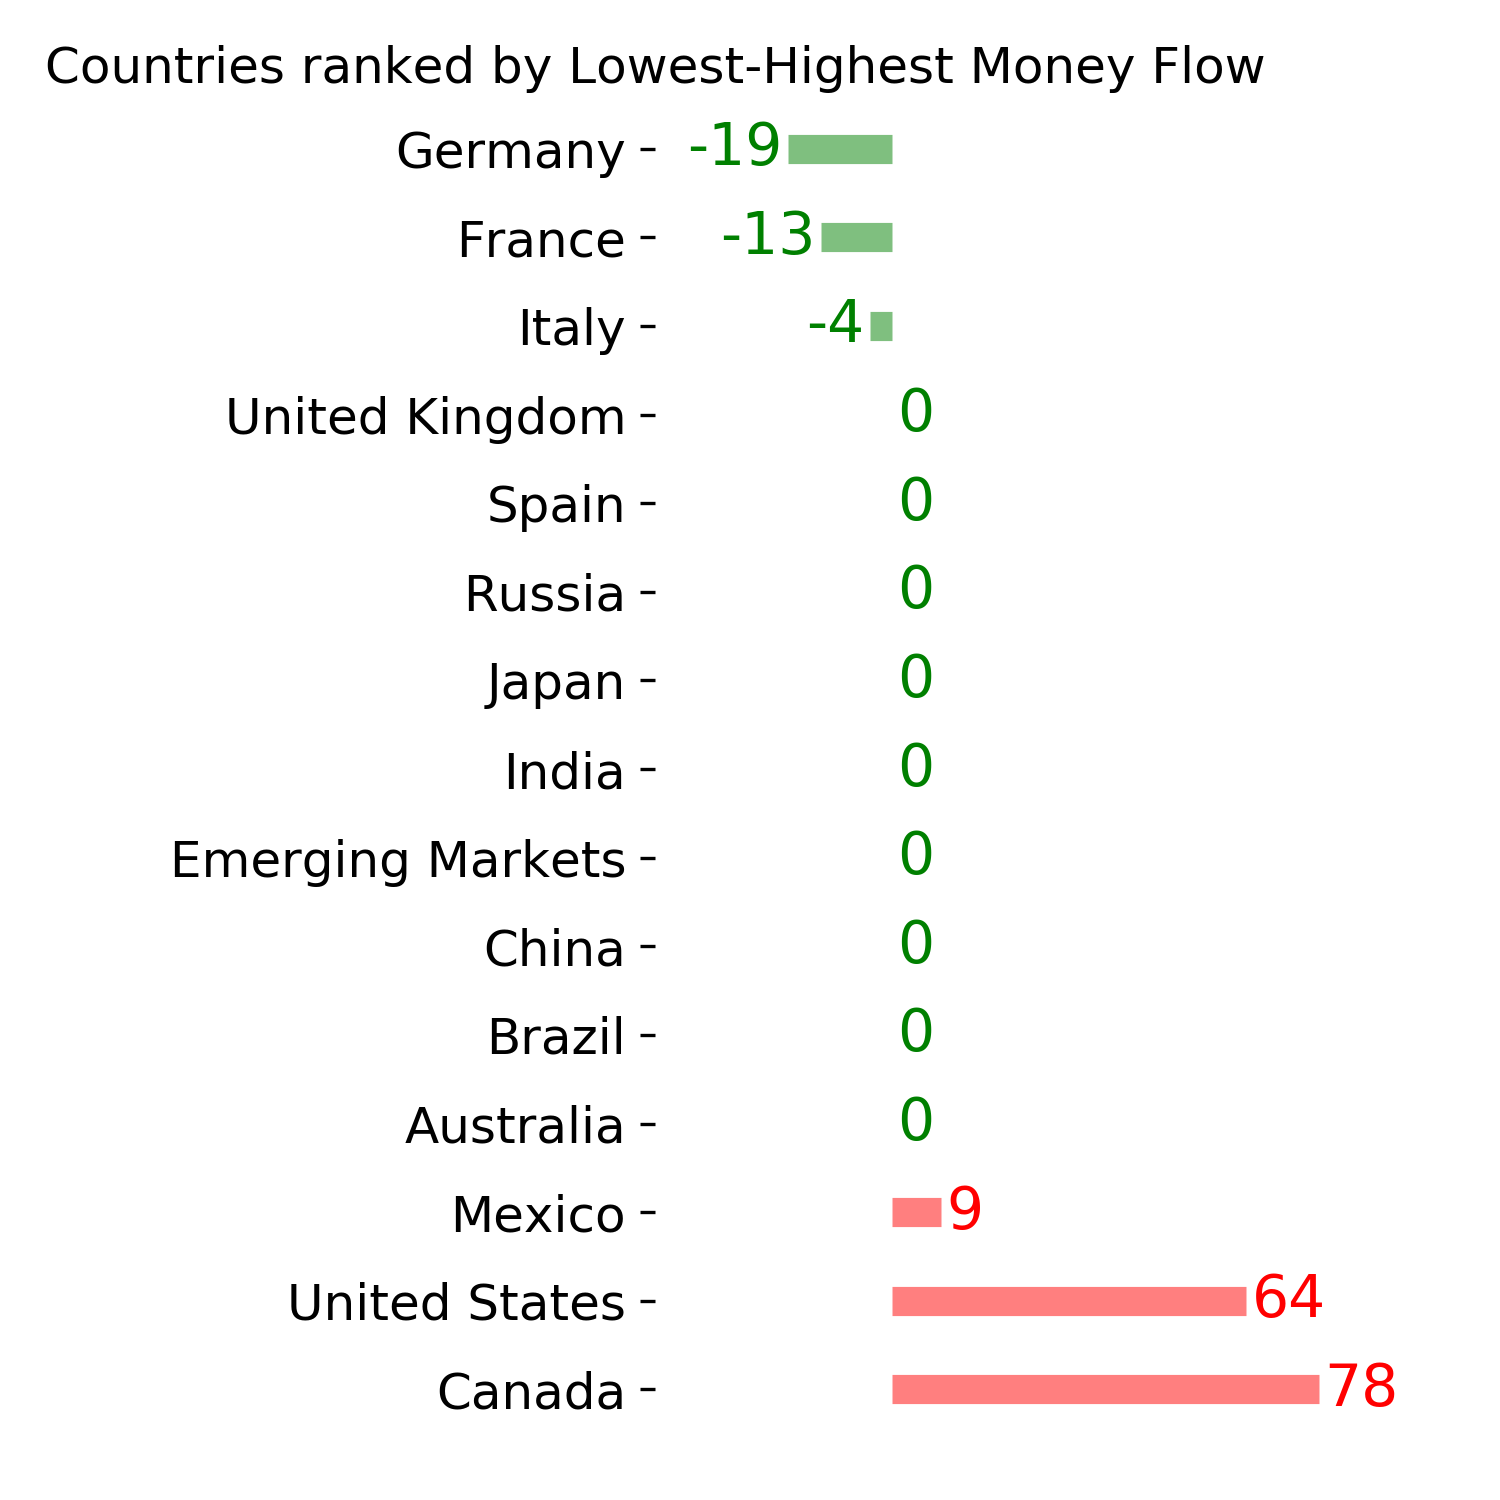
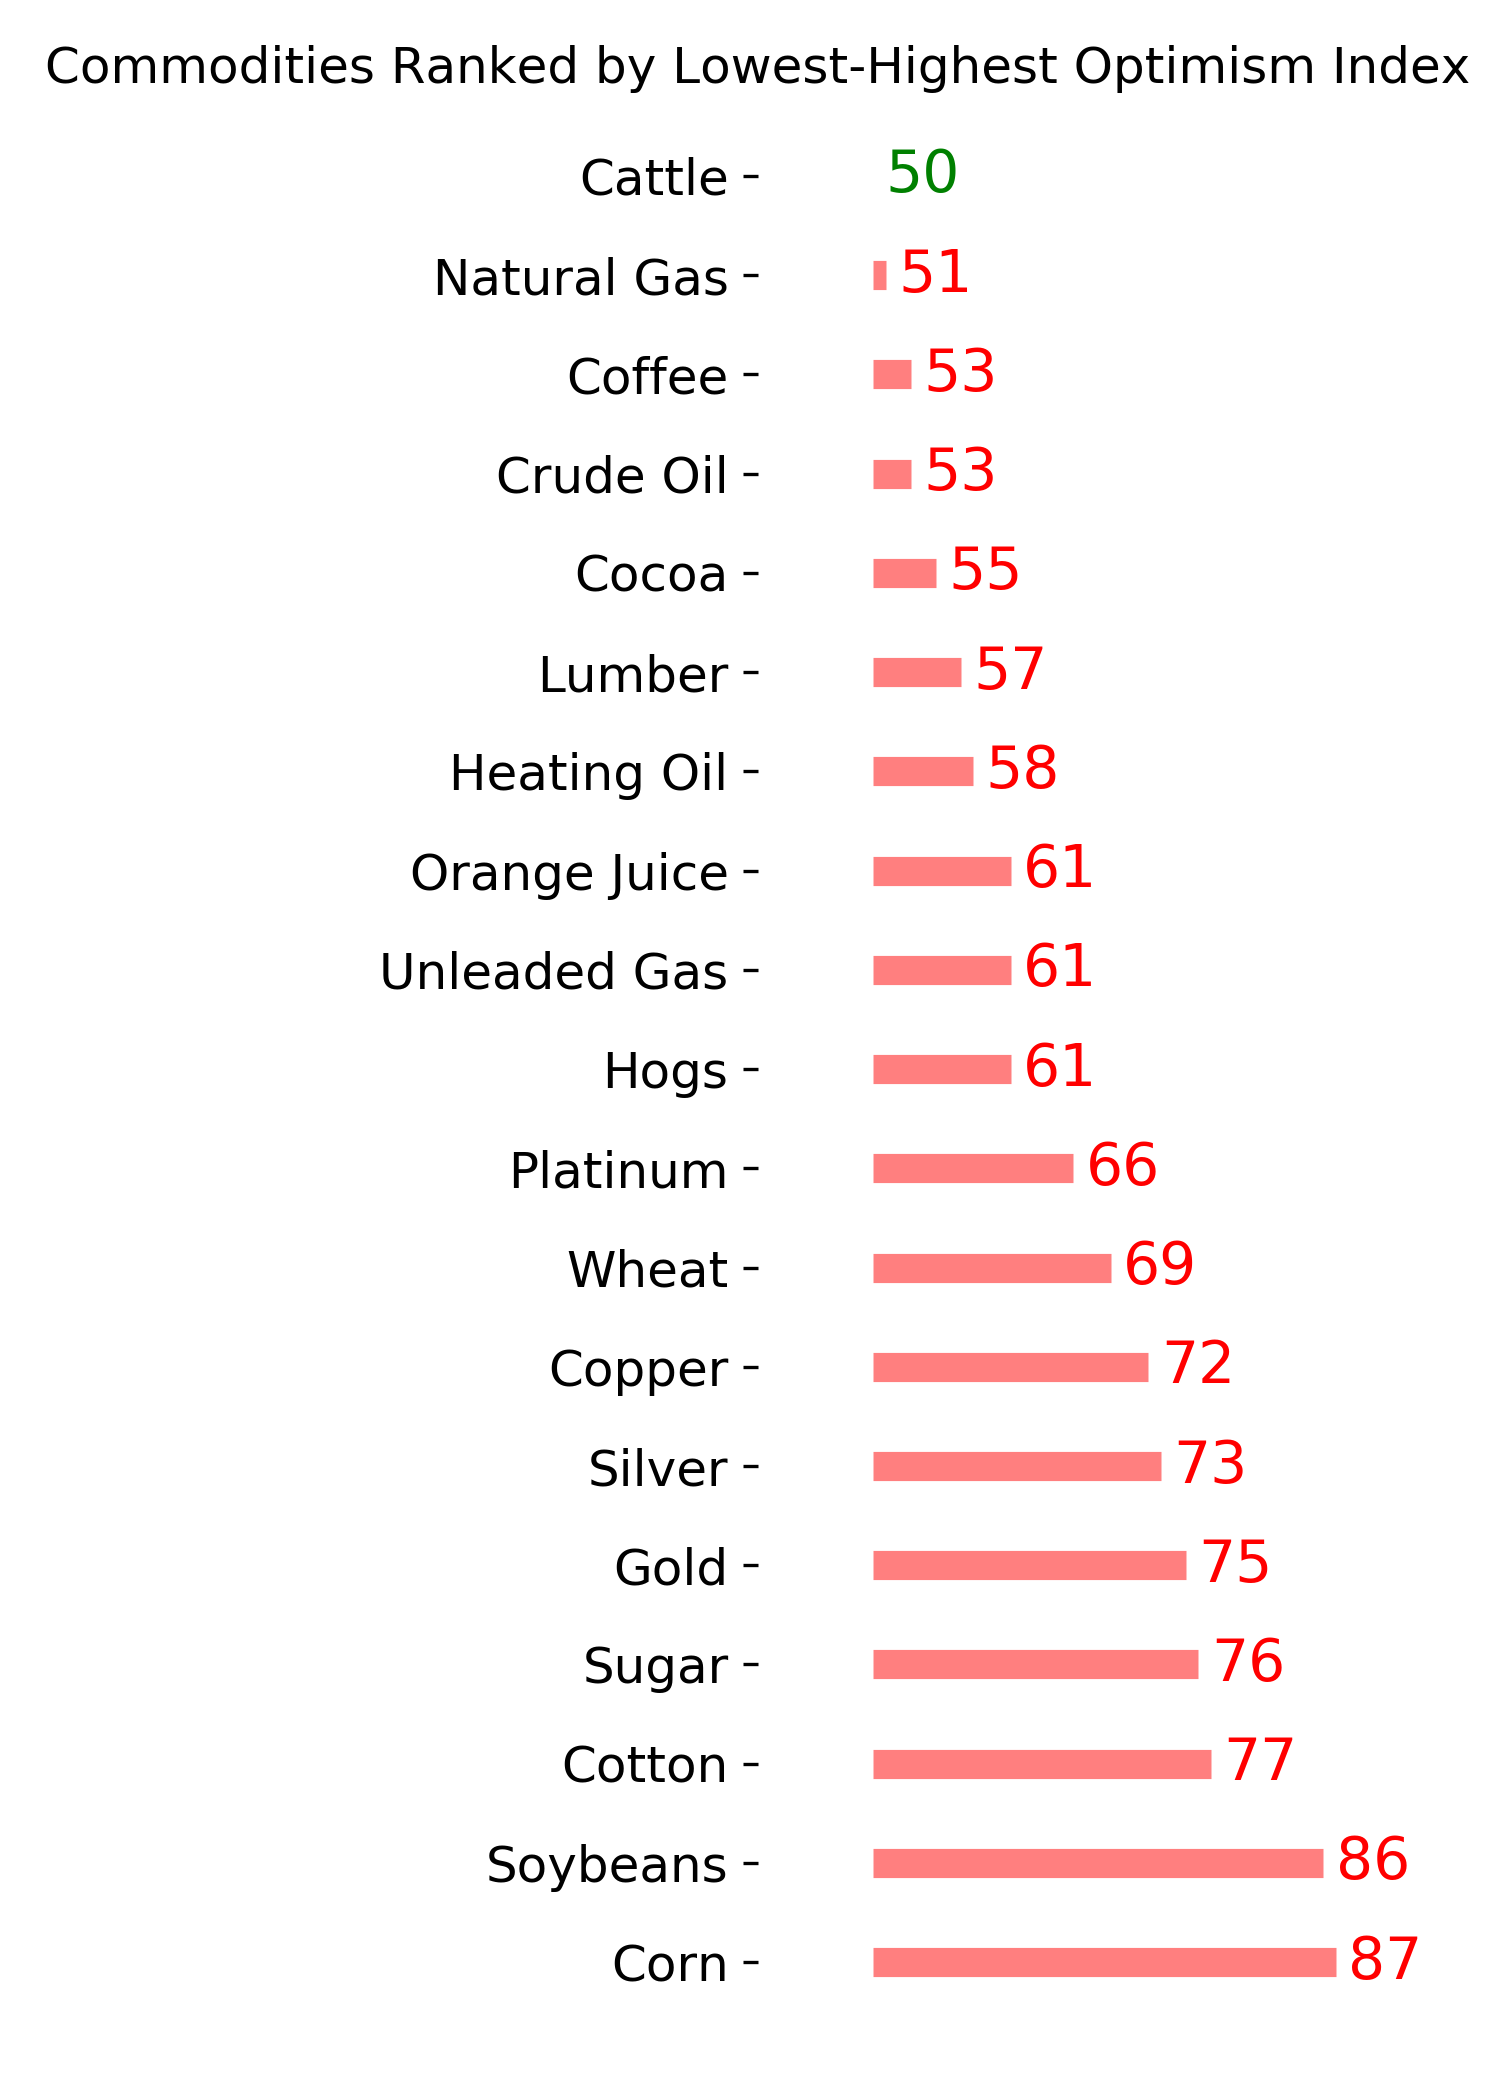
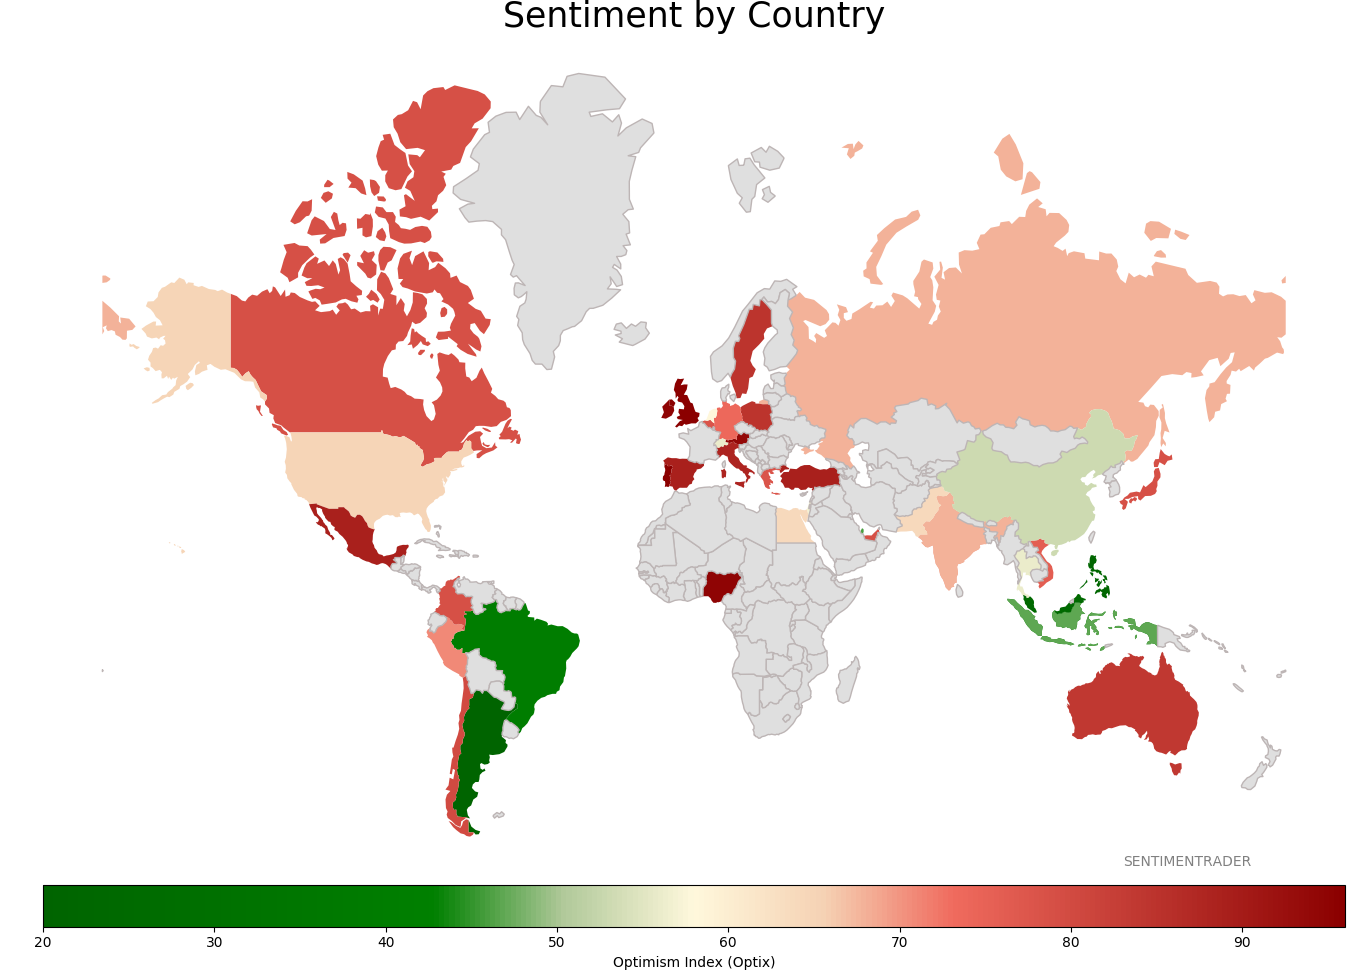
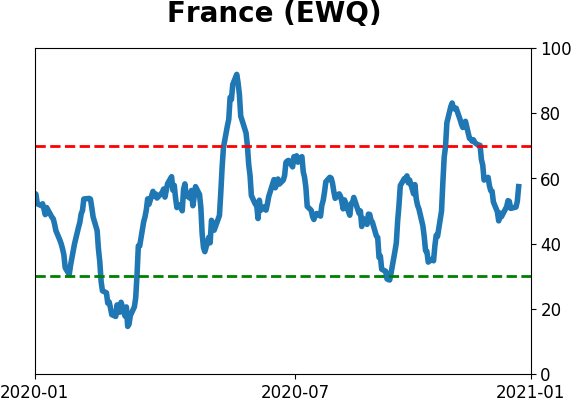
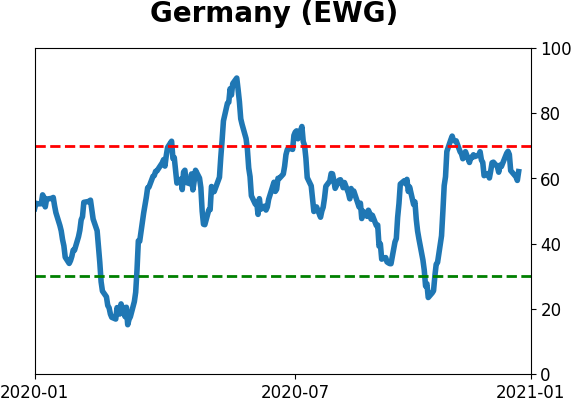
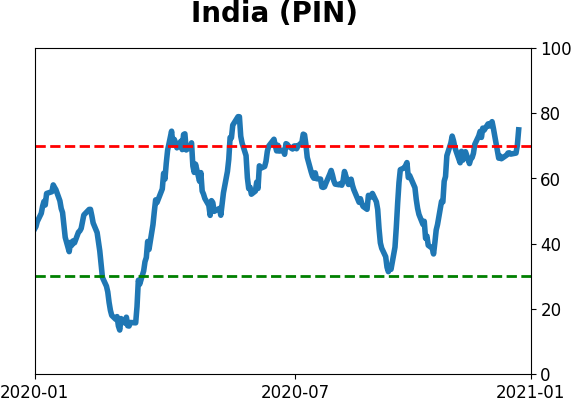
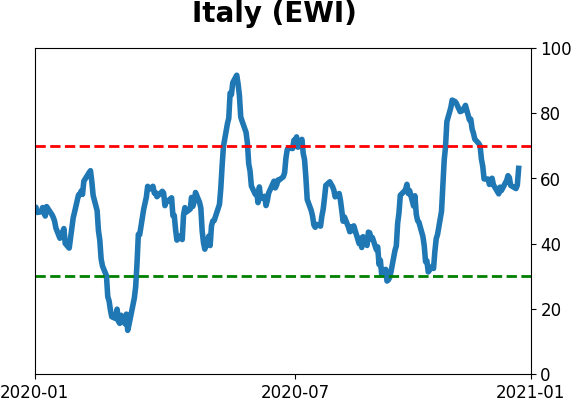
Sentiment Around The World
Optimism Index Thumbnails
|
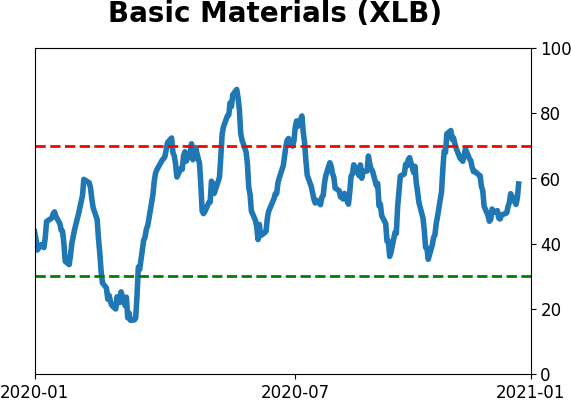
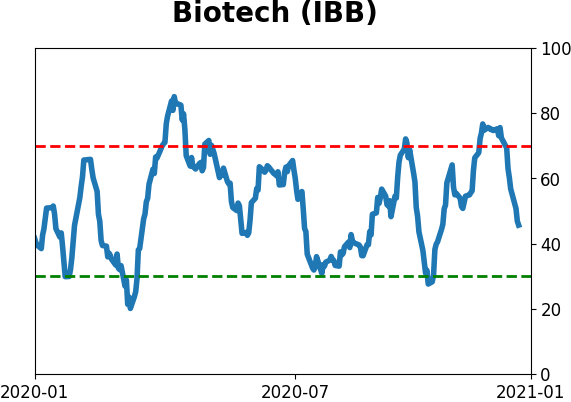
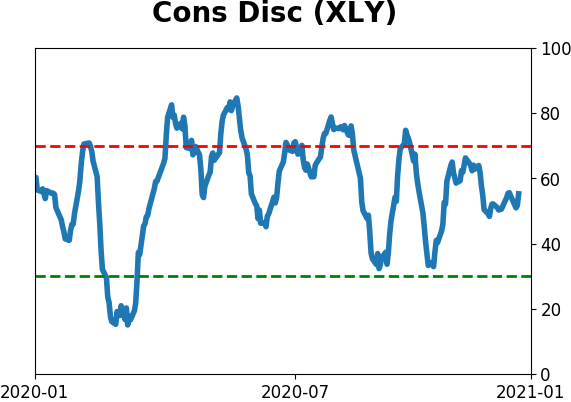
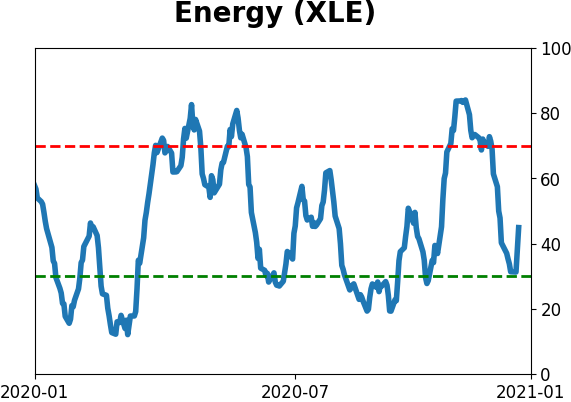
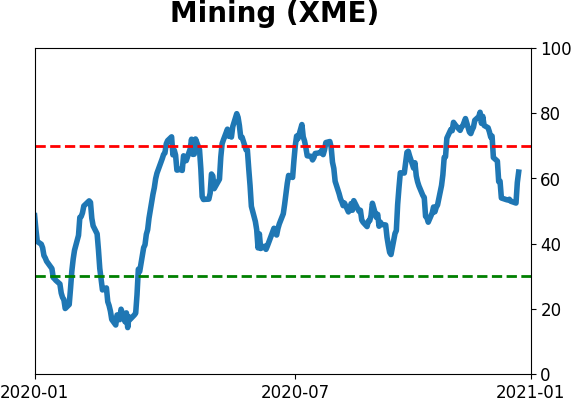
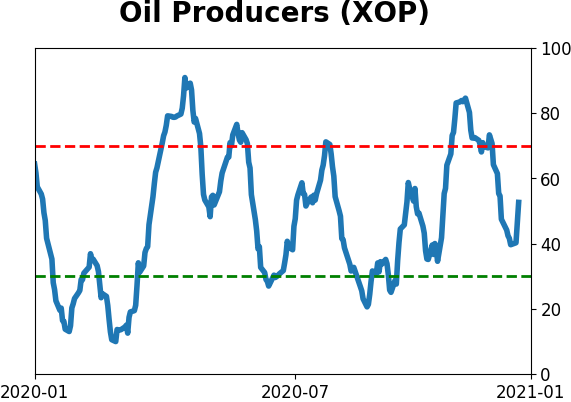
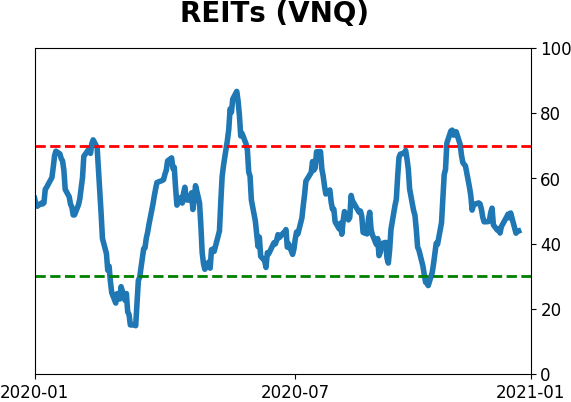
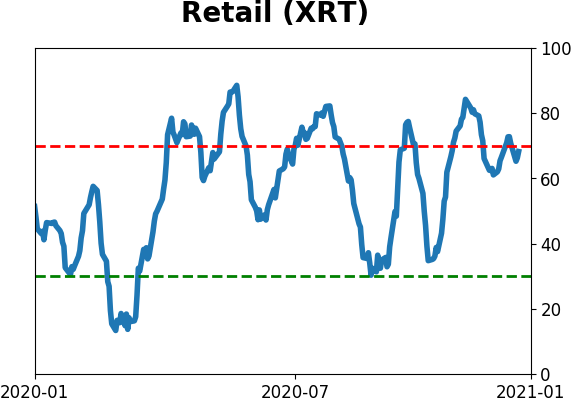
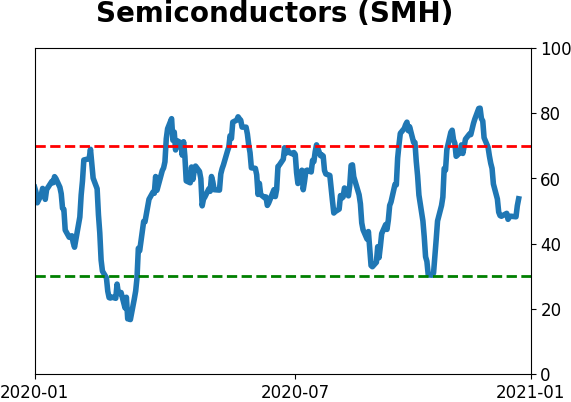
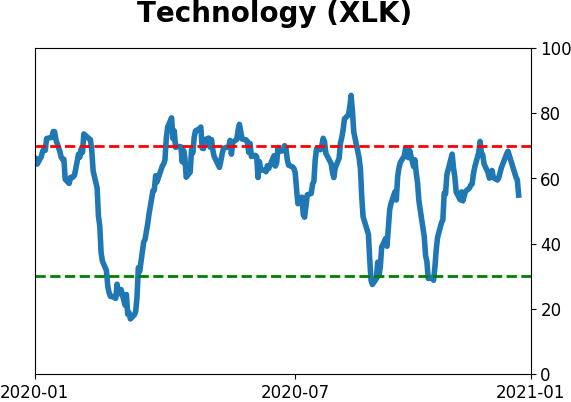
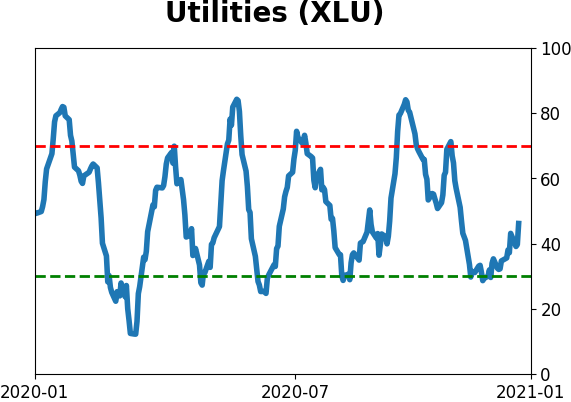
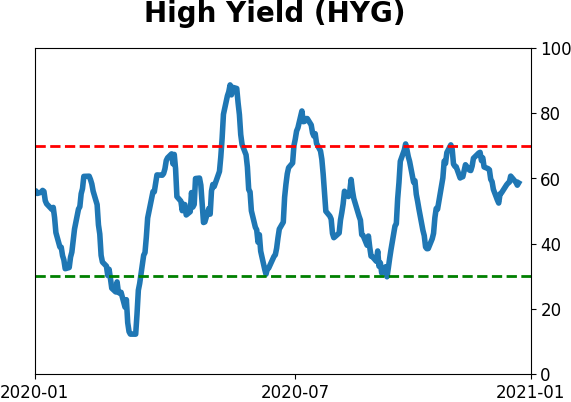
Sector ETF's - 10-Day Moving Average
|
|
|
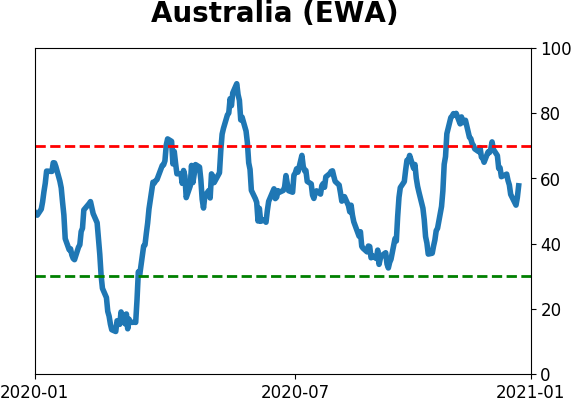
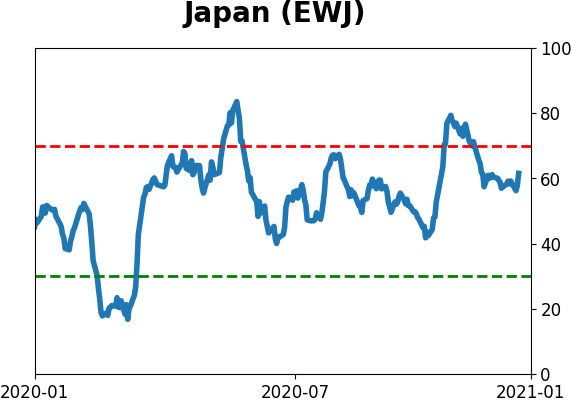
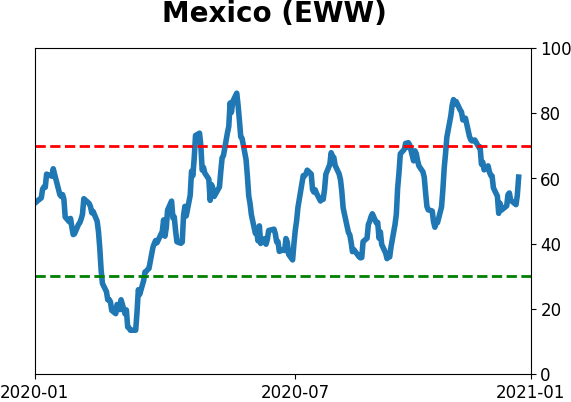
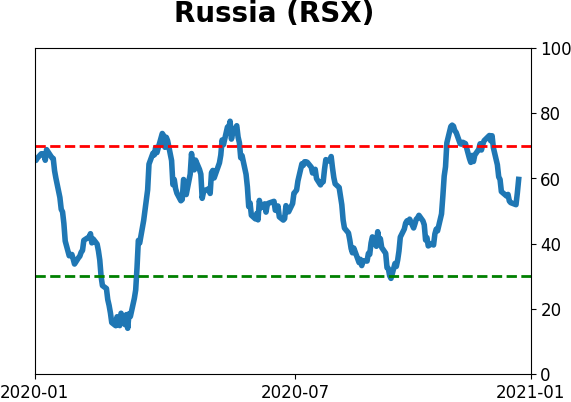
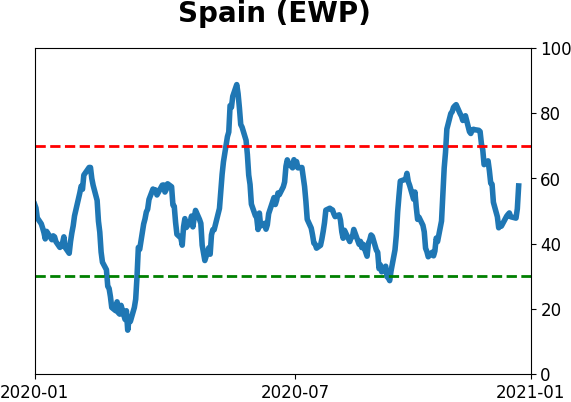
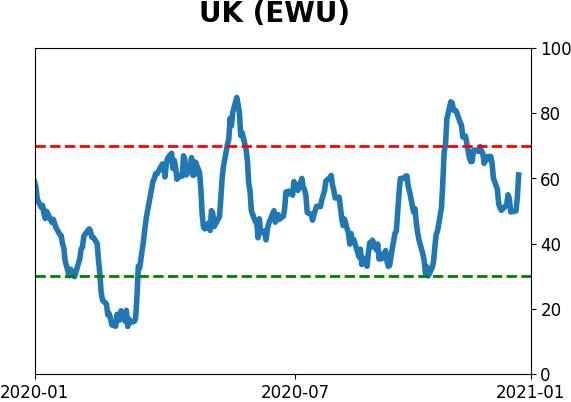
Country ETF's - 10-Day Moving Average
|
|
|
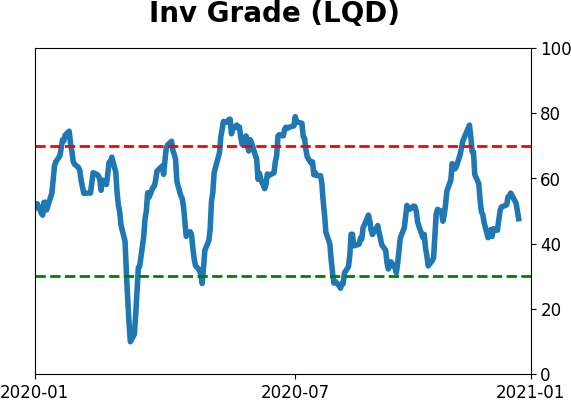
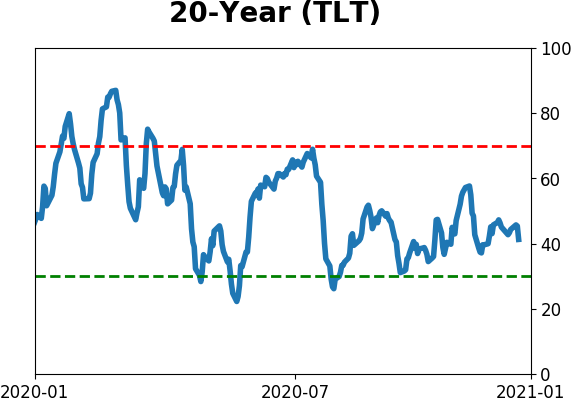
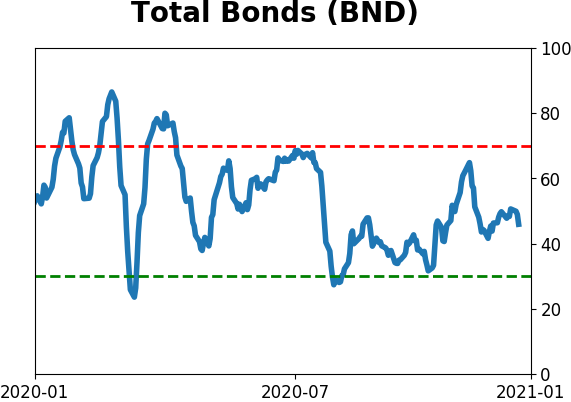
Bond ETF's - 10-Day Moving Average
|
|
|
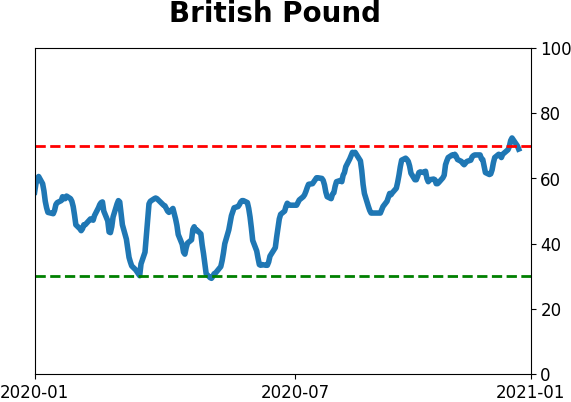
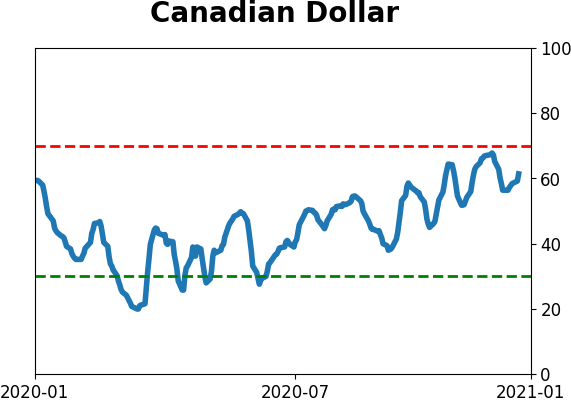
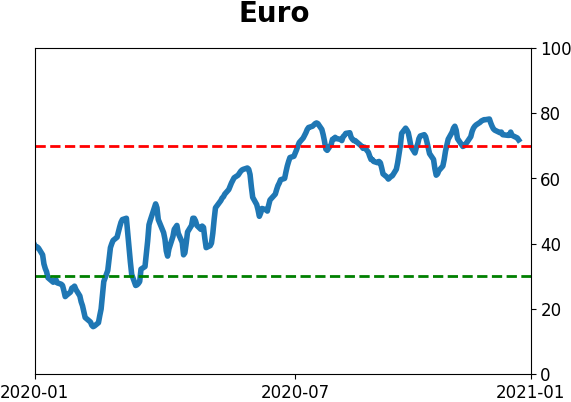
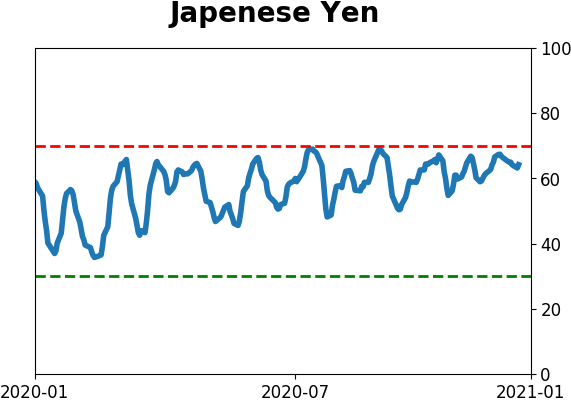
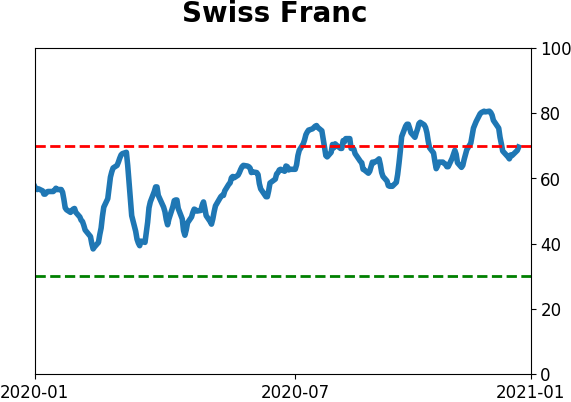
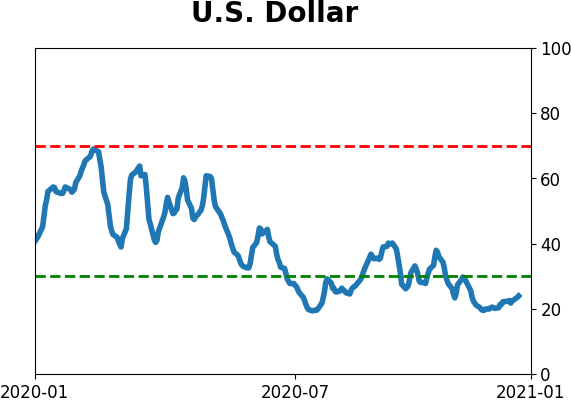
Currency ETF's - 5-Day Moving Average
|
|
|
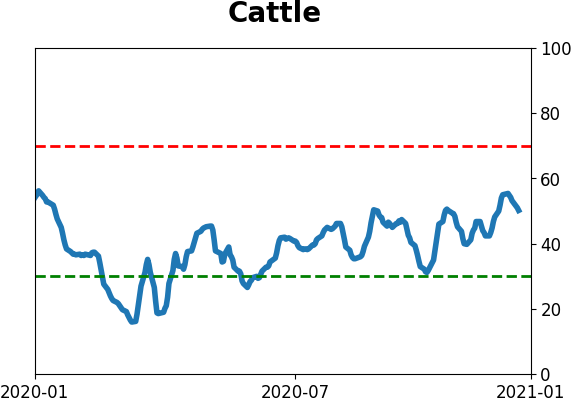
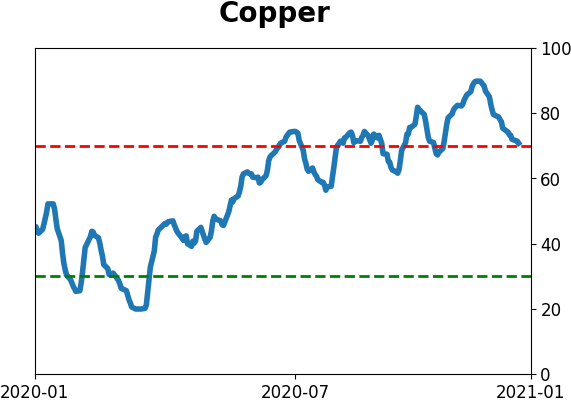
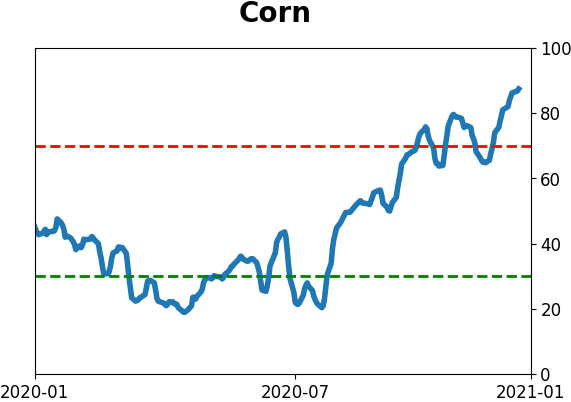
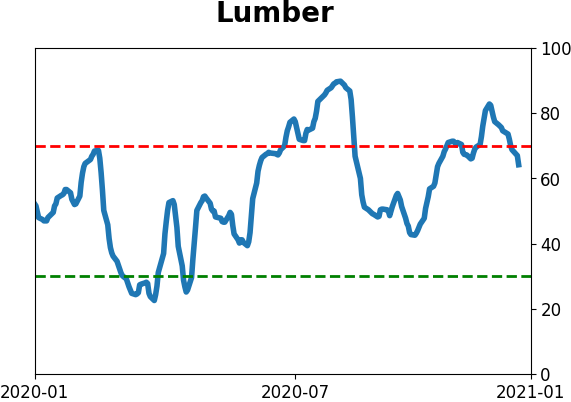
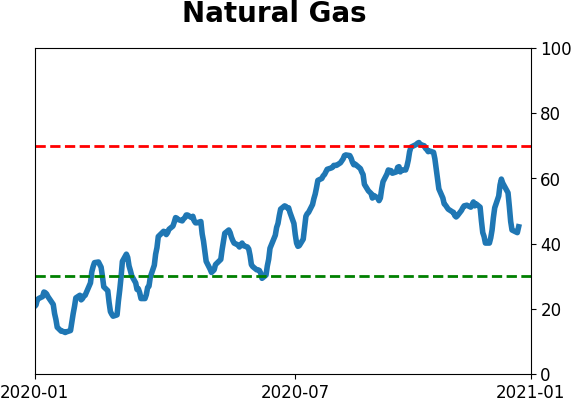
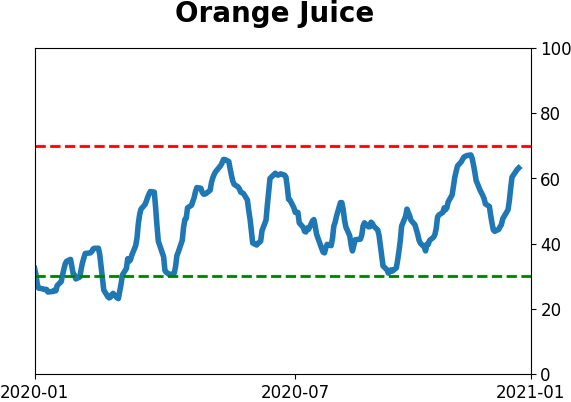
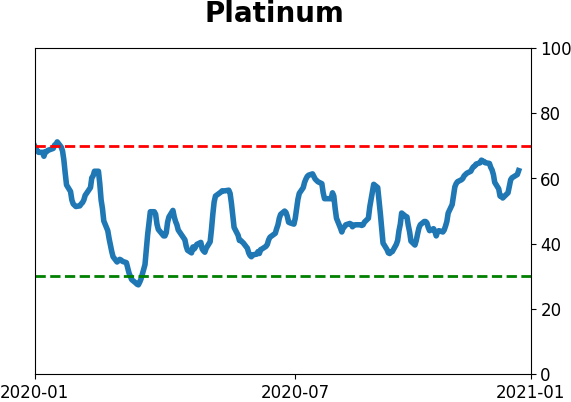
Commodity ETF's - 5-Day Moving Average
|
|