Copper on Cue
The following is a follow-up to this previous article.
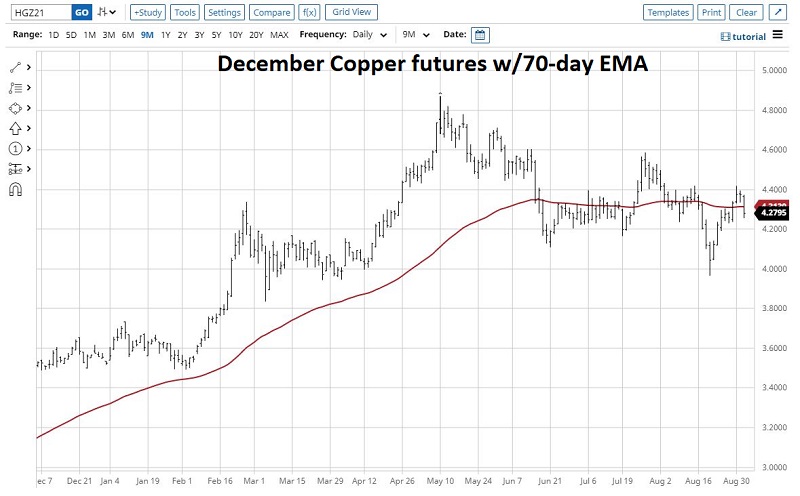
As you can see in the chart below (courtesy of StockCharts), copper:
- Has essentially spent the last 6 months trying to decide which way it should go
- Took it on the chin on September 1st
- Once again dropped back below its 70-day exponential moving average

On a subjective basis, certain factors suggest that copper should rise in price. These factors include:
- Inflation and inflationary expectations
- Infrastructure expectations
- Perceptions of supply and demand imbalances
- Supply chain issues
If these issues play out the wrong way (i.e., if inflation remains higher or rises even more, and/or if demand remains strong and supply is an issue), there is no reason that copper cannot march to new all-time highs.
But in the meantime, several quantifiable factors may influence copper in the opposite direction. Let's take a look at these factors.
SEASONALITY
The chart below displays the Annual Seasonal Trend for copper. As you can see, yesterday's decline came right on cue at the onset of a seasonally unfavorable period.
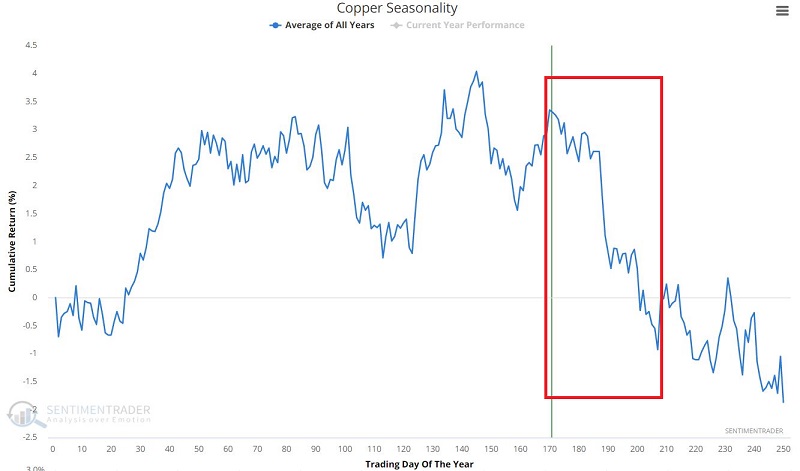
This unfavorable period extends from Trading Day of the Year #170 through Trading Day of the Year #191. The chart below displays:
- The cumulative percentage price performance for copper
- If held long ONLY from TDY #170 through TDY #191
- Since 1959
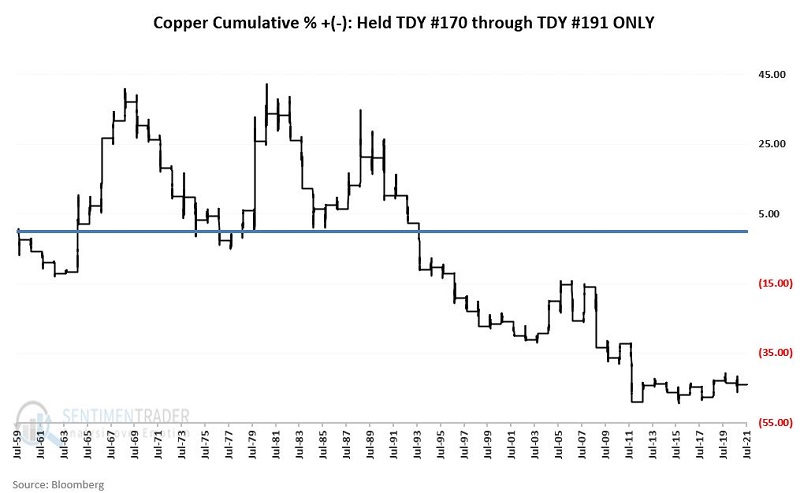
The cumulative result has been a loss of -44%.
As always, it is important to recognize that seasonality is "climate, not weather" and that in any given year, copper can rally sharply despite any supposed "negative seasonal bias."
The chart below displays year-by-year results.
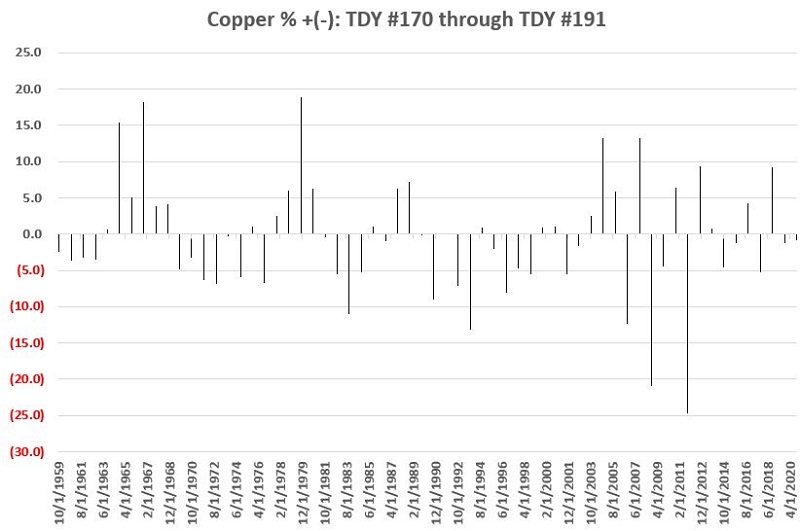
As you can see, in any given year, copper is capable of powering sharply higher despite any supposed "unfavorable seasonal headwind."
For the record, during the TDY #170 through TDY #191 period, copper:
- UP 27 times
- DOWN 35 times
- Average UP = +6.1%
- Average DOWN = (-5.8%)
PRICE
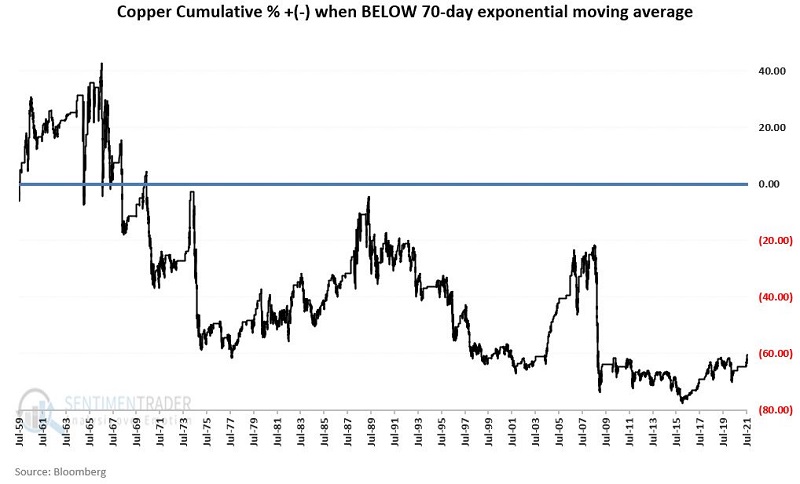
The first chart we showed displayed copper futures with a 70-day exponential moving average. There are no "magic numbers" regarding moving averages, but 70 days has been useful for copper.
The chart below displays copper's cumulative percent price return when it is below its 70-day exponential moving average.
The bottom line is that in the long run, when copper crosses below its 70-day EMA, it's been wise to be cautious about playing the long side.
SENTIMENT
As also noted in the original linked article:
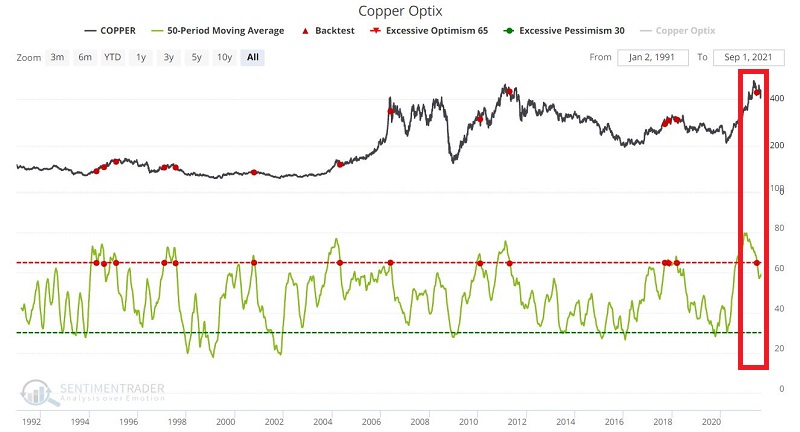
- The 50-day average of copper Optix
- Dropped below 65
- On 6/28/2021
As you can see in the figures below, historically, results have been OK for as much as 3 months after such signals. After that, 6- and 12-month results have been negative on average.

SUMMARY
The "perception" seems to be that copper is headed higher as a key industrial metal. And if inflation and/or supply/demand issues play out a certain way, it may well be.
But if copper is going to break down, several objective measures suggest that that could happen in the months directly ahead.
Stay tuned.


