
Time to Keep a Close Eye on Copper

A lot of people consider copper to be one of the most important commodities in the world. Several factors appear to be coming together soon, affecting the future price direction for this key commodity. Let's take a closer look.
PRICE ACTION
As I write, copper futures are surging, as you can see in the chart of September 2021 copper futures below (courtesy of Stockcharts.com)
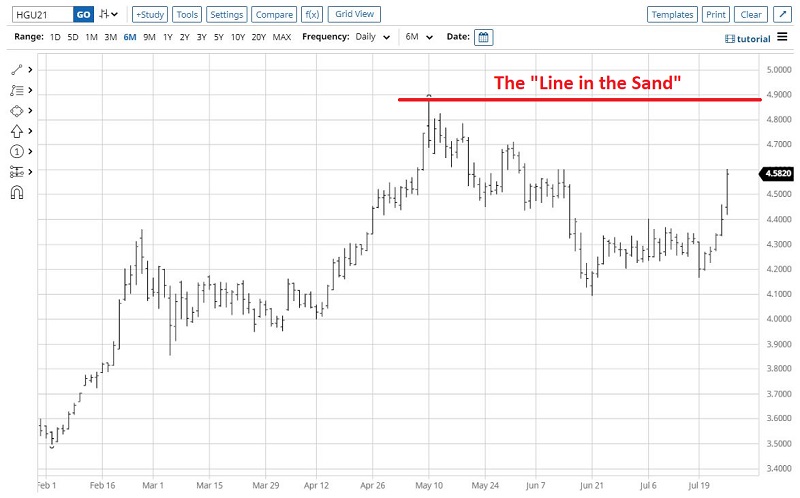
For those who rely on charts to make trading decisions, the key question is, "will price take out the 5/10/2021 high of 4.884?"
For a bigger picture perspective, the chart below (courtesy of ProftSource) displays a quarterly price chart for copper futures since 1970.
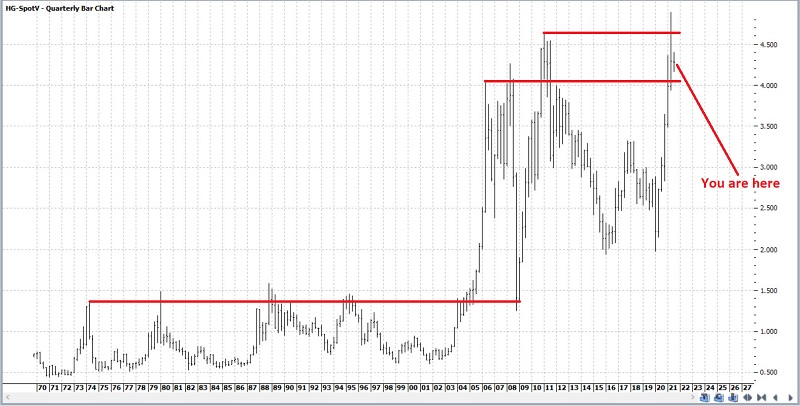
There are a few key things to note:
- Copper is presently near an all-time high, and there is an obvious resistance level above. While this may sound ominous, any implication is mostly subjective. Resistance levels typically matter a lot - right up until the point that they don't. Then one day, price breaks through and moves on to unexpectedly higher levels.
- It took Copper almost 30 years to break through the 1.50 resistance level. It is now taking its 3rd try at breaking and holding above 4.00. People can make all the predictions they'd like, but the bottom line is "either it will or it won't."
- The primary thing to note from this chart is that copper is presently at an elevated price level. Until it breaks through to the upside, traders need to be very vigilant regarding potential downside risk - particularly if the 4.00 level fails to hold.
In the meantime, remember that a surge in price can be one of the most bullish signs for a commodity. To wit, see Dean's post from earlier this year here. As you can see in the table below, there was a favorable signal in February this year. Previous signals have been primarily bullish during the 2 to the 6-month time frame (i.e., through 8/18 of this year), but a number have also been quite favorable 12 months out.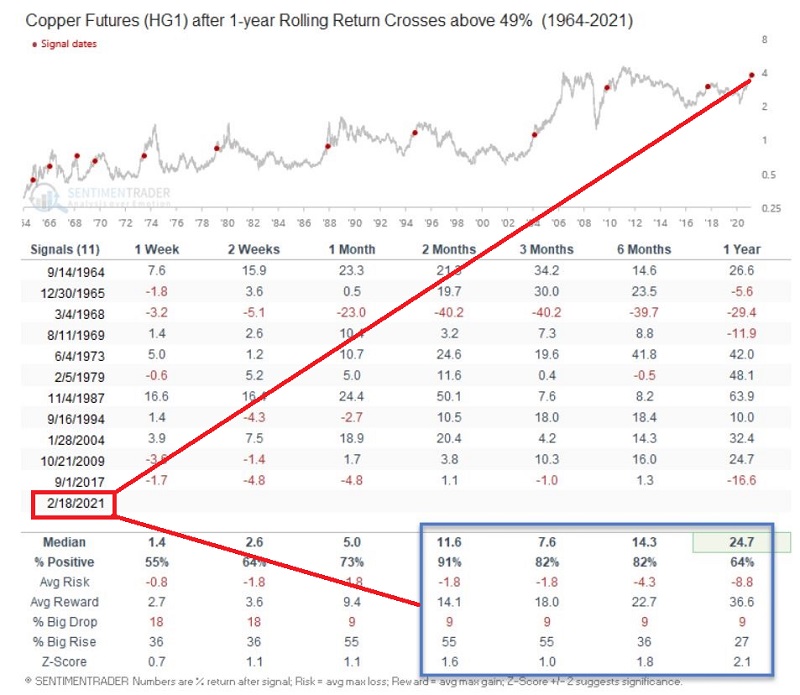
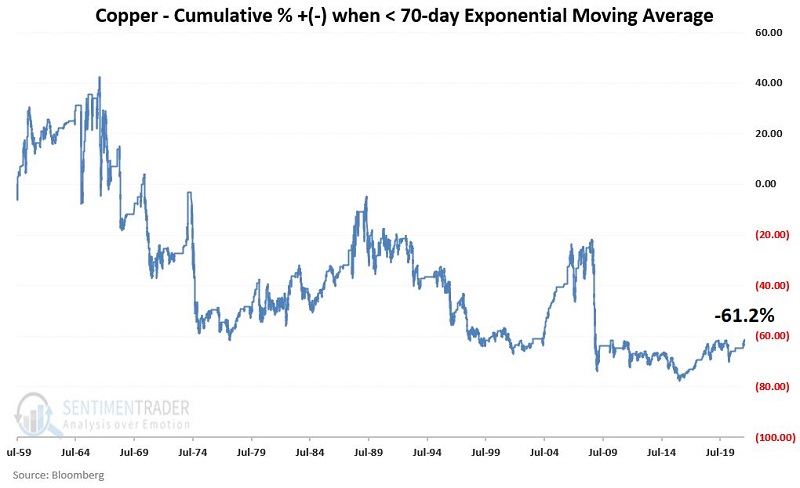
Let's take yet another angle in looking at price action. The chart below (courtesy of ProftSource) displays a daily bar chart of a continuous copper futures data series along with the 70-day exponential moving average.
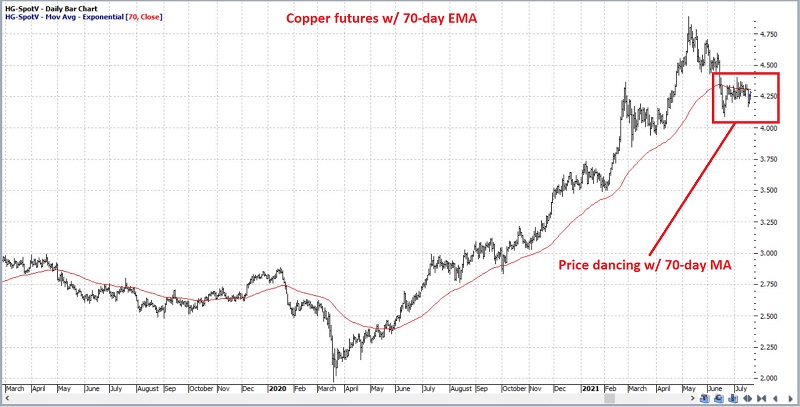
As you can see in the chart above, copper is flirting with its 70-day exponential moving average (for the record, the most recent surge in price has pushed copper back above this average). There is nothing magic about a 70-day EMA. That said, it should be noted that since 1959, copper has:
- Gained +3,678% when above its 70-day EMA
- Lost -61.2% when below its 70-day EMA
The chart below displays the cumulative % performance for copper when trading below its 70-day EMA.
Once again - and as obvious as it sounds - the most bullish thing copper can do is go up in price. The three things to watch are:
- Getting back above - and staying above - the 70-day EMA
- Holding above 4.00
- Ultimately breaking upside resistance above 4.88
SEASONALITY
The chart below displays the Annual Seasonal Trend for copper.
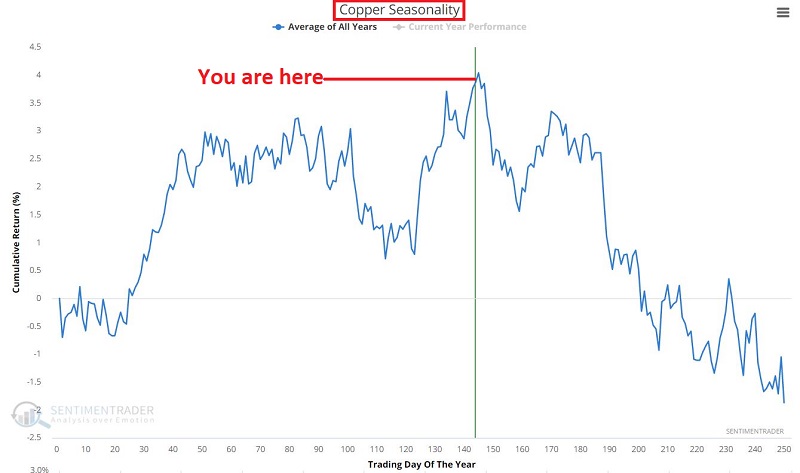
As you can see, the seasonal chart is reaching its apex. This DOES NOT mean that copper is doomed to run out of steam and fall for the rest of the year. All this chart tells us is that the second half of the year tends to be much more difficult for copper and that any new rally from current levels will have to come into a stiff seasonal headwind.
However, it also suggests that any breakdown in price in the weeks and months ahead (particularly below the 70-day EMA and/or below the 4.00 level) should be taken very seriously by traders.
The chart below displays the cumulative % +(-) for copper if held long from the close of Trading Day of the Year #145 through Trading Day of the Year #159 since 1959.
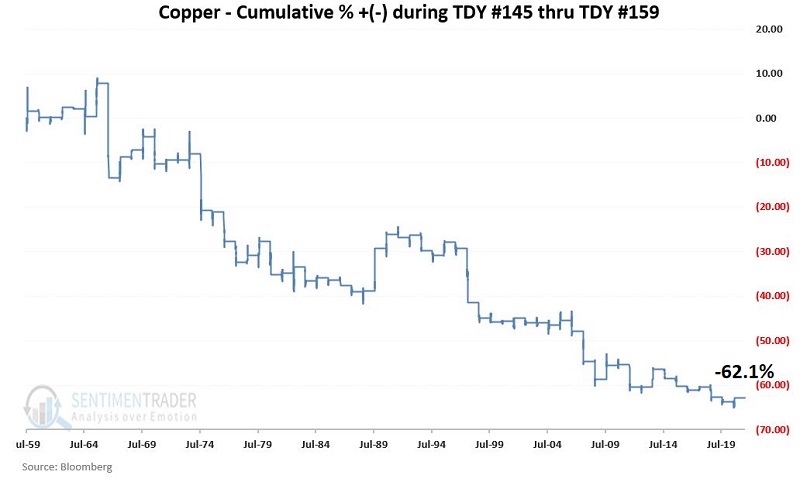
The bottom line on seasonality: Copper CAN rally during these typically unfavorable seasonal timeframes - but they have been very much the exception to the rule.
SENTIMENT
Now let's look at how copper performed after:
- The 50-day average for Copper Optix
- Dropped from above to below 65%
The chart below displays the signal dates for this test (which you can run by clicking here).
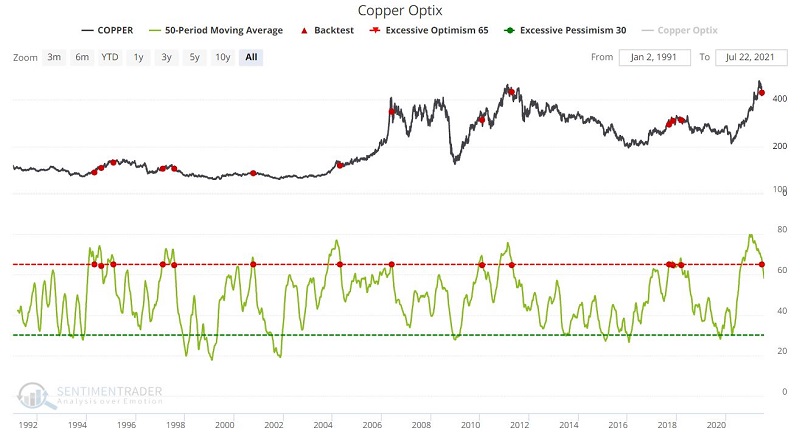
The table below displays the summary of results following previous signals. These results are by no means uniformly or overwhelming unfavorable during the first 3 months after a signal. However, 6 months out, the average and median results are negative, and the median 1-year result has been a double-digit loss.
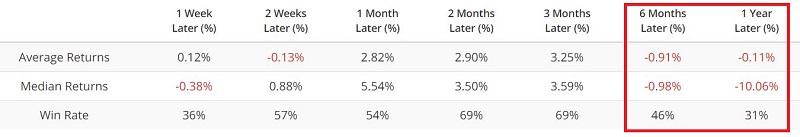
The most recent signal was on 6/28/2021. Based on the results above, this is by no means a "sell copper and run for the hills" kind of signal. But it does suggest that the "clock is ticking" in terms of further upside for copper in the months ahead.
PUTTING IT ALL TOGETHER
Copper looks very vulnerable in the near term:
- Nearing a seasonally unfavorable time of year
- Flirting with 70-day EMA
- Coming off of an Optix warning signal
Price is always the most important factor. As long as copper continues to trend higher, there is no reason to "fight the trend." However, if price, seasonality, and sentiment all line up on the wrong side, traders might consider steering clear of copper or playing it from the short side.
The time for deciding may be near, and traders are urged to pay close attention.