Commodity at the Crossroads - The Gold Edition
Everywhere I look, I keep finding headlines about "the coming rally in gold." Meanwhile, many of the things I follow related to gold are just not lining up in the bullish camp (see here and here). That said, gold appears to be nearing a crossroads and setting up for the next big move.
SEASONALITY
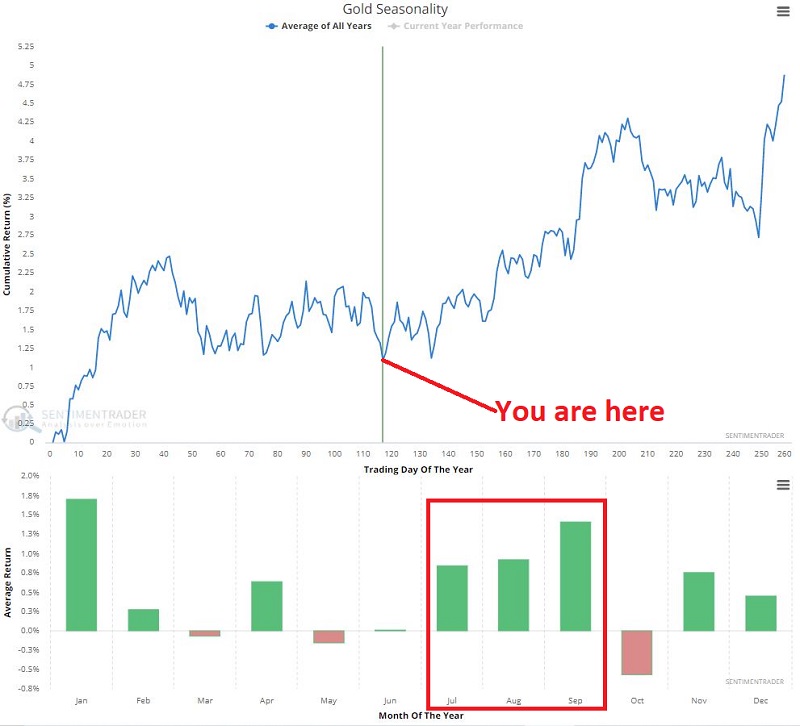
The chart below displays the annual seasonal trend for gold.

Regarding seasonality:
- It might not be quite accurate to deem this chart as "bullish," as historically, there has been a lot of "chop" in the month ahead
- But most importantly, the chart does suggest that the worst may be over for a while
- Additionally, July, August, and September have demonstrated a bullish bias for gold
ELLIOTT WAVE
Truth be told, I am not a true "Elliott Head." But as a proud graduate of "The School of Whatever Works" (good ‘ole SWW), I do pay attention to Elliott Wave when the counts of different timeframes (daily, weekly, etc.) match up and/or if the wave count appears to line up with seasonal expectations. Because I have never had much success discerning wave counts on my own, I rely upon - for better or worse - the algorithm built into ProfitSource software to generate wave counts.
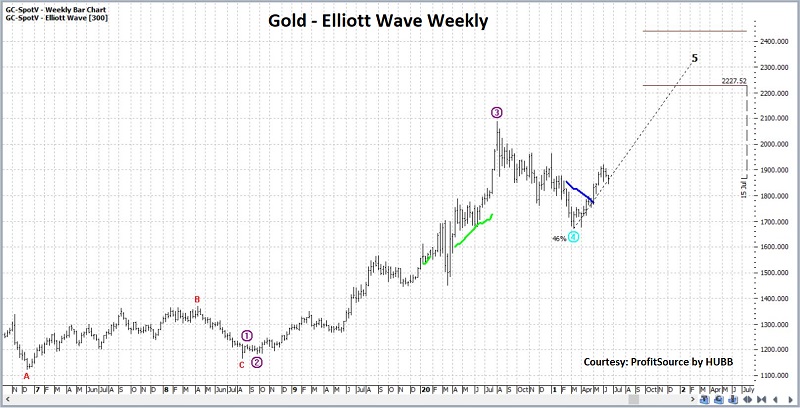
- The chart below displays a bullish Wave 5 possibly developing on the weekly gold chart
- It is presently projecting higher prices in the months ahead - much like the seasonality chart above
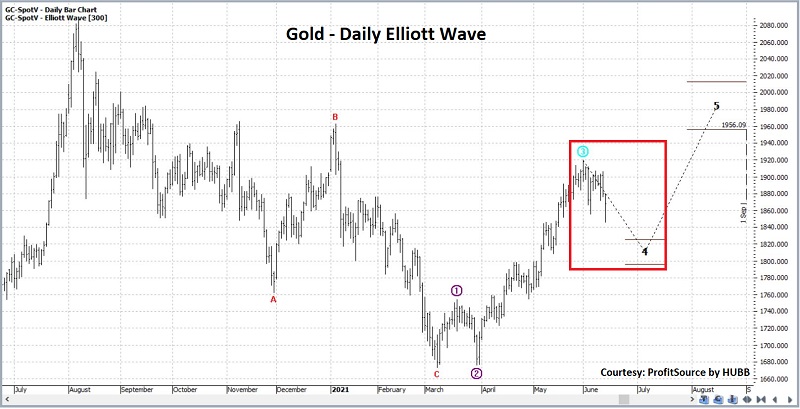
- The chart below displays the daily Elliott Wave count that is suggesting the possibility of another pullback in the weeks ahead
- This scenario also fits well with the seasonality chart shown above
The Lumber/Gold Ratio
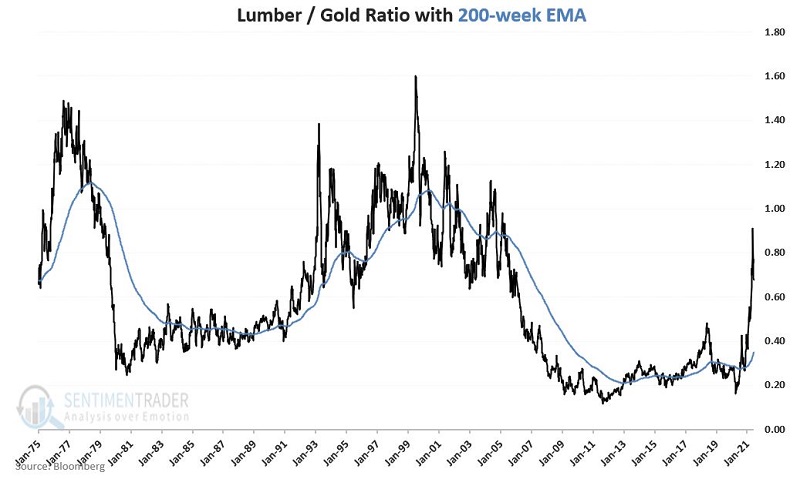
The chart below displays the Lumber/Gold Ratio since 1975 (black line) and its 200-week exponential moving average (blue line).
The chart below measures the deviation of the lumber/gold ratio from its own 200-week exponential moving average as follows:
(((Current lumber/gold ratio divided by 200-week EMA) - 1) * 100)).
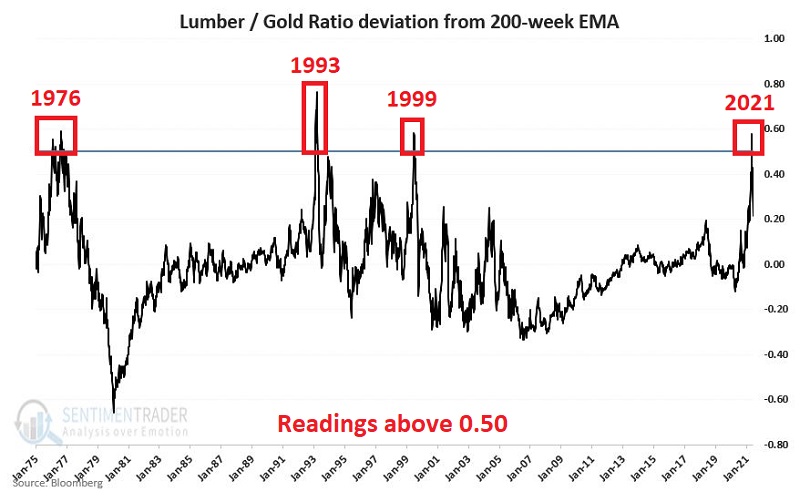
- Note that before May 2021, there have been only 3 previous occasions when this ratio exceeded 0.50 - 1976, 1993, and 1999
- The ratio pierced 0.50 for only the 4th during the week of 5/7/2021
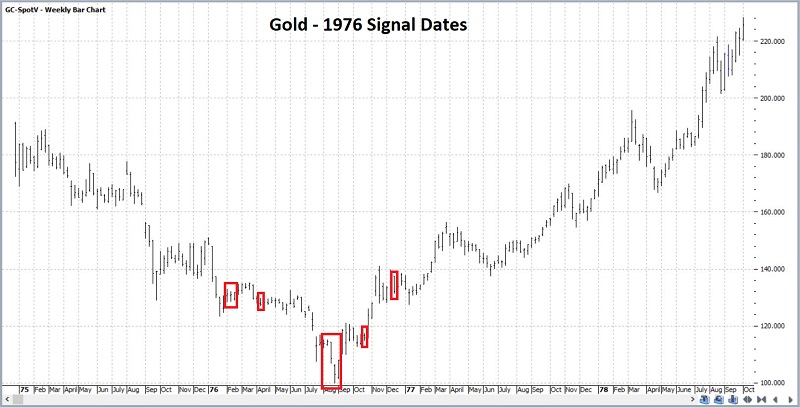
Let's look at the previous instances. The ratio exceeded 0.50 during February, March, April, August, September, and October 1976. You can see in the chart below that gold first worked lower for a while before moving significantly to the upside.
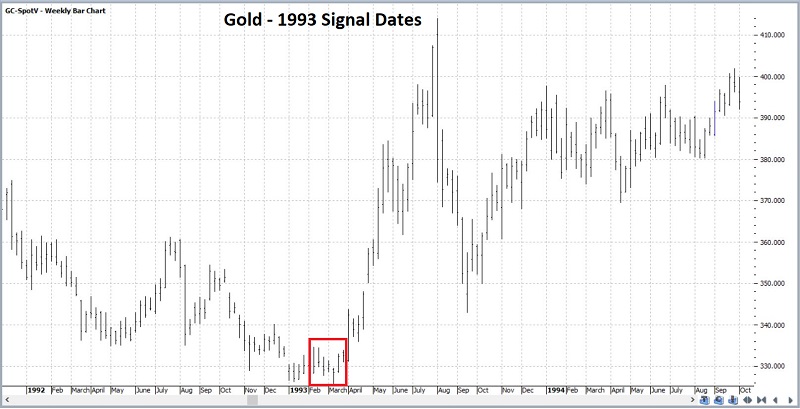
The next round of signals occurred in February and March of 1993. This proved to be a low-risk buying opportunity as gold rally sharply over the next 3 months.
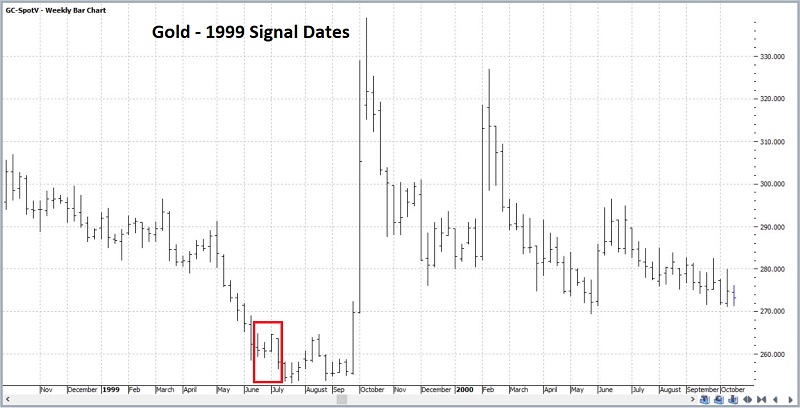
The third instance of signals occurred in June and July of 1999. Gold drifted lower for a short while and then spiked sharply higher (albeit only briefly) during September and October.
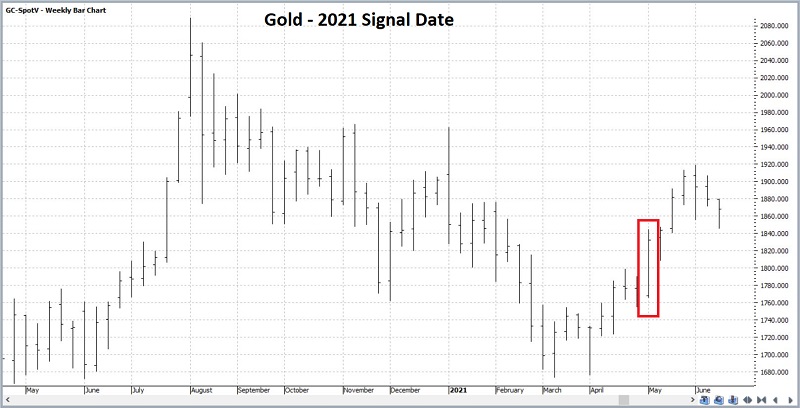
The final and most recent instance occurred on 5/7/2021. The recent chart for gold appears below. Since then, gold has worked moderately higher, albeit with a pullback in recent weeks.
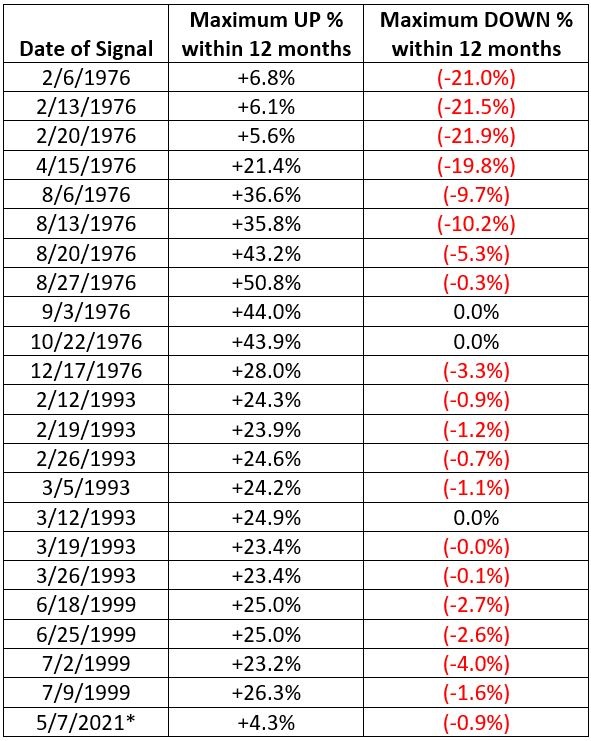
The problem, of course, is that this is a tiny sample size of instances to draw any conclusions from. To get a sense of what this signal has meant in the past, the table below displays:
- the largest gain for gold within 12 months of each previous signal
- the largest decline for gold with 12 months of each previous signal
SUMMARY
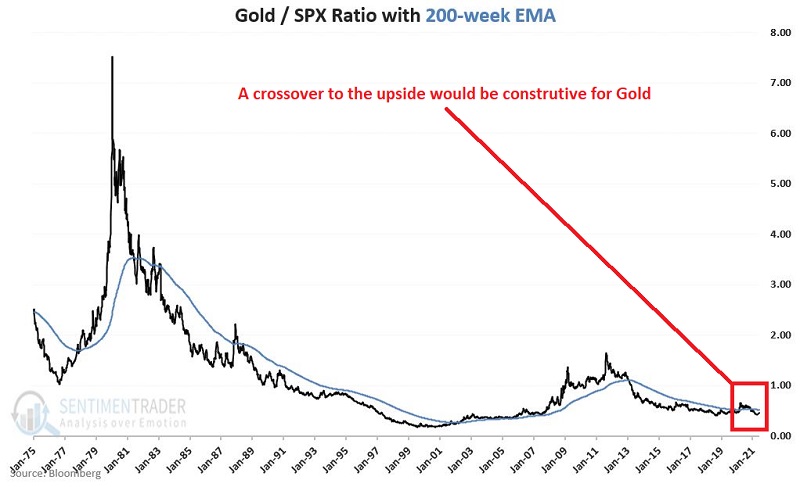
Nothing discussed above guarantees that gold will not decline in the weeks and months ahead, let alone that it will, in fact, rally in any meaningful way. A useful confirmation signal would occur if the Gold/S&P 500 Ratio closed above its 200-week exponential moving average. See the chart below and this article for more details.
The bottom line is that gold appears to be nearing a crossroads - inching ever closer to deciding the direction of the next major movement in price.


