
Bonds and the 45-Month Cycle

One of the primary goals of all investors and traders is to maximize their profitability. One of the keys to achieving this goal is to invest in a given vehicle when the probability of making money is at its highest.
This seems like a good time to invoke:
Jay's Trading Maxim #27: Long-term investment success is not about finding "sure things" but about finding a slight edge here and there and exploiting it ruthlessly and repeatedly.
The bond market has been a terrific wealth generator over the last almost 40 years as interest rates have declined from over 15% to less than 1%. Unfortunately, there is no way for this performance to be duplicated in the years ahead (interest rates of -13%, anyone?). As a result, "picking one's spots" in the bond market will take on added importance in the years directly ahead.
The 45-Month Cycle
Over the past roughly 50 years the bond market has operated on a roughly 45-month cycle. Within the last roughly 40 years this cycle has played out within the context of a longer-term bull market due to the aforementioned long-term decline in interest rates.
This distinction is important in that instead of designating one part of the cycle "bullish" and the other part "bearish", we will refer to the two parts of the cycle as "favorable" and "less favorable." In other words - at least in theory - we expect to see better bond market performance during the "favorable" phase over time than during the "less favorable" phase.
Which leads to some obvious questions:
- Has the supposed favorable portion of the cycle outperformed the less favorable portion?
- If so, how big is the difference in performance?
- How consistently has the favorable period outperformed the less favorable period?
- Where are we now in this cycle?
Let's take a closer look.
The 45-Month Cycle
Starting on 7/31/1973 we will designate the first 22 months of each subsequent 45-month period as "favorable" and the second 23 months as "less favorable." Please note that when the day comes that interest rates establish a new long-term uptrend these two periods may be renamed "less unfavorable" and "very unfavorable." For now, let's look at the results since 1973.
Our first full 45-month cycle breaks down as follows:
- August 1973 through May 1975 = Favorable
- June 1975 through April 1977 = Less Favorable
The cycle then repeats every 45-months with the first 22 months designated as "favorable" and the following 23 months designated as "less favorable". For testing results, we will use monthly total return data for the Bloomberg Barclays Long Treasury Index.
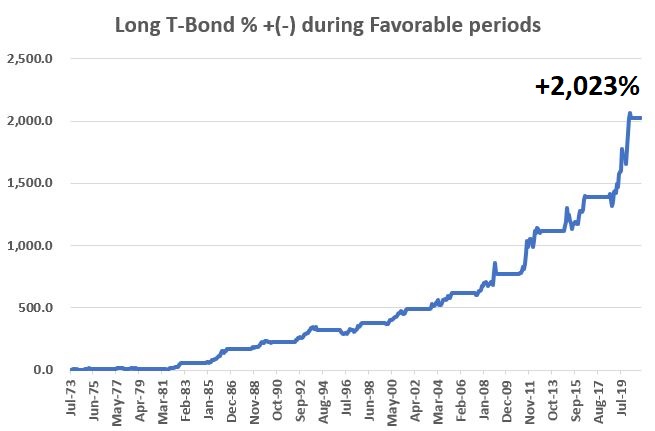
The chart below displays the cumulative total return for the long treasury bond index ONLY during Favorable months from August 1973 through March 2021. The total cumulative gain during Favorable months was +2,023%.
The chart below displays the cumulative total return for the long treasury bond index ONLY during "Less Favorable" months from August 1973 through March 2021. The total cumulative gain during Less Favorable months was +105%.
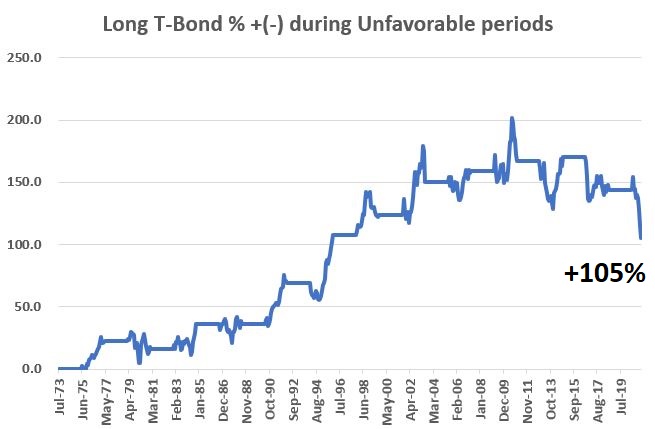
As you can see in the chart above - and as I mentioned earlier, it would be incorrect to deem these results as outright "bearish". A gain of 105% is a gain of 105%. However, if you were looking to maximize your profitability in bonds you would clearly have favored the first 22 months of the 45-month cycle.
The bottom line is that the vast majority of profitability that the long-term treasury has enjoyed over the past 5 decades has come during the "Favorable" part of the 45-month cycle.
The table below displays the cycle-by-cycle and cumulative returns for each part of the 45-month cycle since 1973.
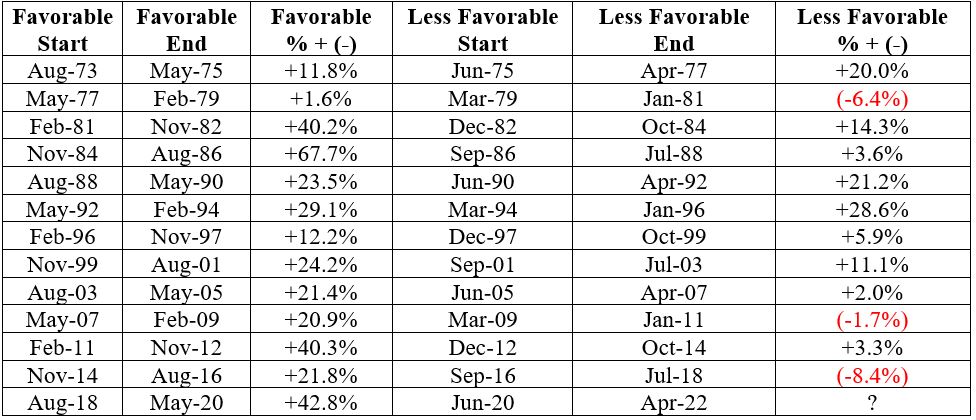
It should be noted that within all 12 of the completed 45-month cycles listed in the table above, the Favorable period outperformed the Less Favorable period in every instance except the first one.
The table below compares performance between the two periods.
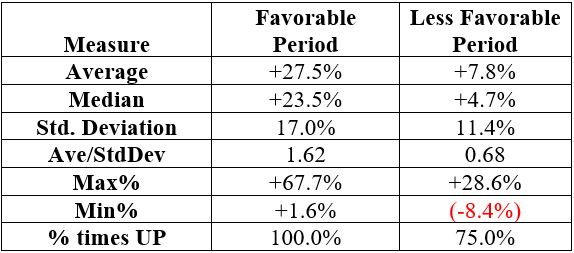
The median gain:
- during Favorable periods was +23.5%
- during Less Favorable periods was +4.7%
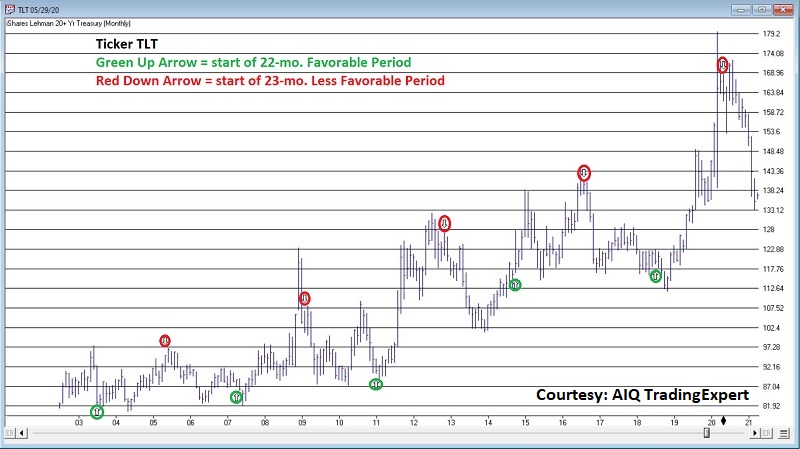
The chart below displays the Favorable and Less Favorable periods since 2002 using ticker TLT.
The Current Cycle
- The current 45-month cycle in t-bonds has been in the Less Favorable portion of the cycle since the end of May 2020
- Since that time long treasuries have declined -15.9% through the end of March 2021
- This particular Less Favorable phase will last through the end of April 2022
Does this mean t-bonds cannot rally in the days, weeks, and months ahead? Not at all. The bond market is extremely oversold and appears due for a meaningful bounce (hopefully). But at least for the next 12+ months, any rally in bonds will be into the headwind of the 45-month cycle.