
An In-Depth Look at the New Risk-Off Composite Model

Key points
- This report introduces the Risk-Off Composite Model, a sophisticated tool designed to identify the transition from bull markets to potential bear markets.
- It aggregates five distinct risk-off signals-ranging from breadth deterioration and defensive outperformance to structural divergences-into a single composite indicator.
- A signal triggers when the composite count hits 60% or higher, followed by a breakdown in short-term price momentum.
- Historically, this model has effectively identified high-risk periods where market exposure should be managed carefully, often preceding weak short-to-medium-term returns.
The Risk-Off Composite Model Components
Identifying the primary market trend is one of the most critical tasks for any trader or investor. The Tactical Composite Trend Model (TCTM) is the culmination of decades of professional trading and financial market research, designed to aid in this process. The TCTM utilizes a weight-of-the-evidence approach, combining seven key time-tested components to identify major market turning points. The Risk-Off Composite Model is not a member of the S-TCTM. We use it as a secondary input to assess risks around potential market peaks.
Risk-off models are designed to identify periods when the market transitions from a bull to a bear phase. While these models can serve as standalone tools, we always prefer a weight-of-the-evidence approach, as single models are more susceptible to market noise. In today's report, we want to share a new composite model that incorporates five risk-off models for managing market risk exposure.
The new model includes the following components described below:
- Percentage of Members Outperforming the Index Risk-Off Model
- Percentage of Members above the 50-Day MA Risk-Off Model
- Percentage of Members Outperfroming Defensive Spread
- New High-Low Spread with Weak 50 & 200-Day MA
- Breadth Composite Divergence
Notes:
- The composite model utilizes a 21-day lookback period for the signal count.
- We want to stress the importance of utilizing a momentum condition in trading signals. We never want to catch a falling knife on down moves or prematurely reduce exposure in a market that is ripping to the upside. This is why we have the 5-day rate of change condition.
Risk-Off Composite Model Signal Criteria
- Composite signal count >= 60%.
- If condition 1 is met, then start "days since true count."
- If "days since true count" <= 5, AND the 5-day rate of change for the S&P 500 is <= 0%, signal Risk-Off.
- The composite count resets below 20%. i.e., the reset screens out duplicate signals.
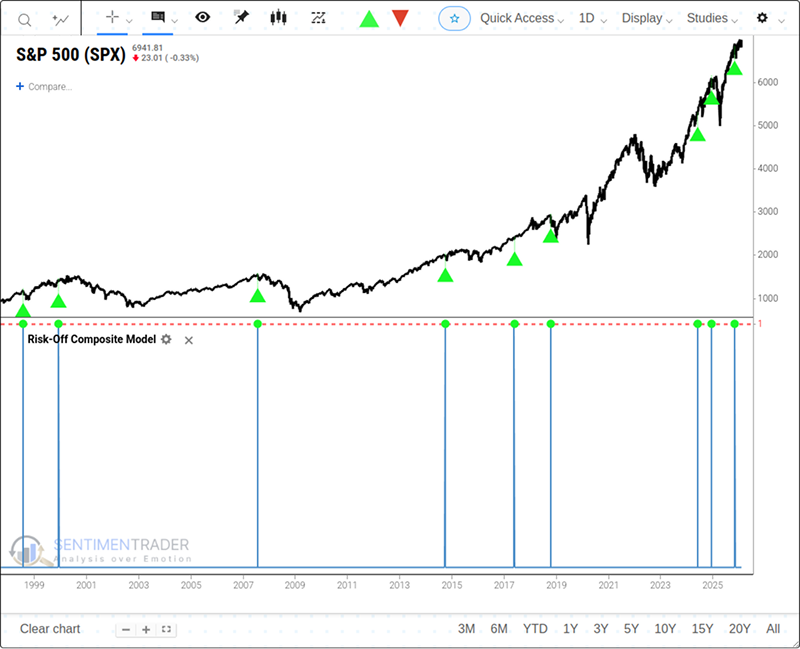
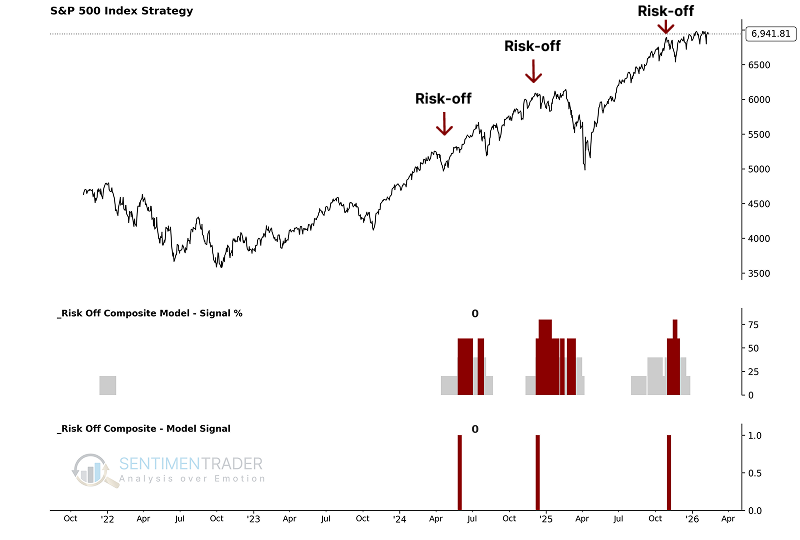
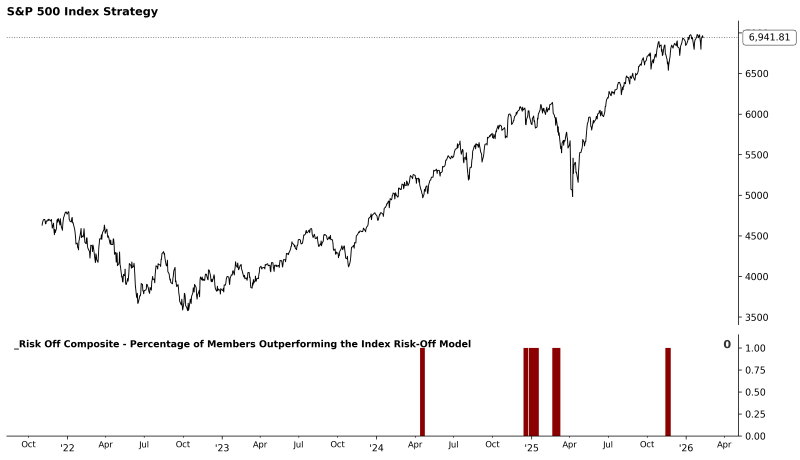
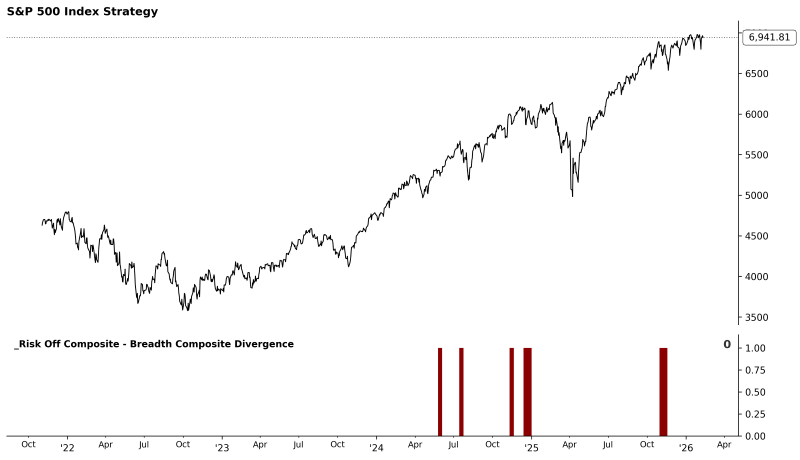
As the chart below illustrates, these individual components are combined into a single composite indicator-the Risk-Off Composite Model-which uses a 0 or 1 value to issue alerts. Currently, the model shows a reading of 0, indicating no Risk-Off signal is active.
Utilizing the S-TCTM Risk-Off Composite Model
The model's output allows us to define the market environment as "Favorable" or "Unfavorable" without subjective interpretation. Specifically:
- When the Risk-Off Composite Model flips from 0 to 1, the primary trend is considered Unfavorable for stocks.
With this framework, we can construct a systematic trend-following strategy to see how this approach has performed historically.
Using the Backtest Edge engine, we can set up the entry and exit criteria to follow the model's signals. The setup is straightforward:
The Entry Criteria are set for when the S-TCTM Risk-Off Composite Model equals 1, initiating a long position when the trend becomes unfavorable.
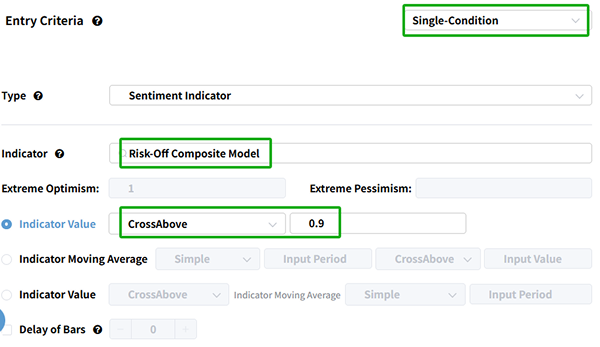
We can skip setting an explicit exit for this test, as we are primarily interested in the forward returns after the signal triggers.
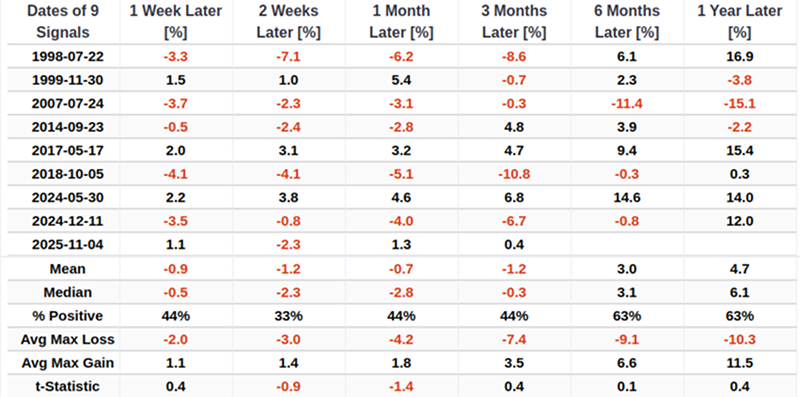
As shown in the table below, market performance typically weakens after this signal is triggered. For the related backtest, click here.
Component Deep Dive
Percentage of Members Outperforming the Index Risk-Off Model
As the famed investment strategist Bob Farrell once said, "Markets are strongest when they are broad and weakest when they narrow to a handful of issues."
The percentage of members outperforming the S&P 500 Index risk-off signal seeks to identify instances in history when very few members participate as the S&P 500 Index hovers near a high. The model will issue four separate alerts based upon the following conditions.
Components
- Percentage of S&P 500 members outperforming the Index on a rolling 21-day basis
- Percentage of S&P 500 members outperforming the Index on a rolling 63-day basis
Signal Criteria
- Signal 1: Outperformance <= 22nd percentile (21 & 63 day), S&P 500 near high, momentum breakdown.
- Signal 2: Outperformance <= 3rd percentile (21 & 63 day), S&P 500 near high, momentum breakdown.
- Signal 3: 21-day Outperformance <= 1st percentile, S&P 500 near high, negative 5-day ROC.
- Signal 4: 63-day Outperformance <= 1st percentile, S&P 500 near high, negative 5-day ROC.
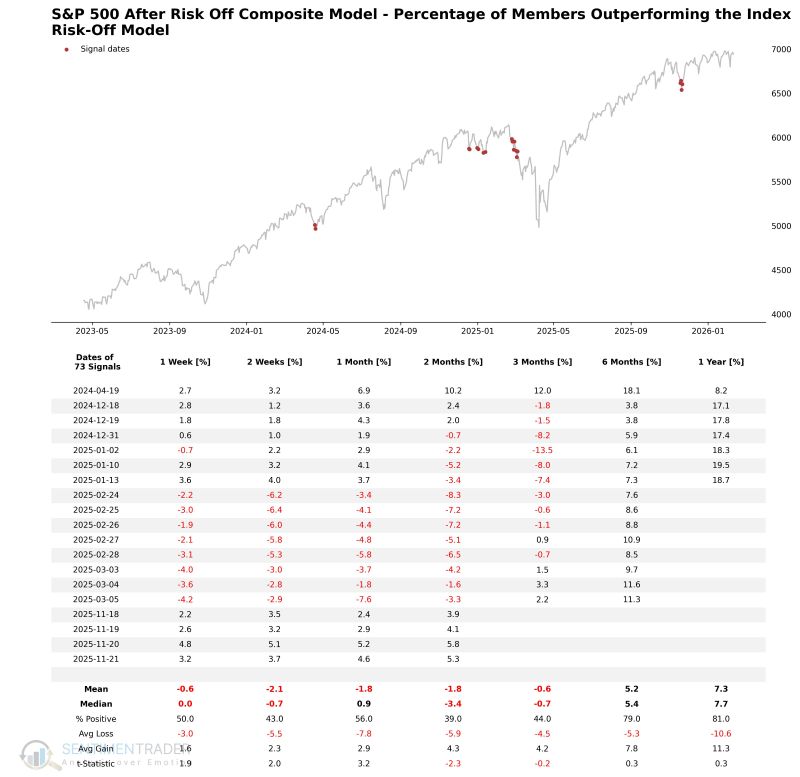
Current Day Chart
Signal Performance
As seen in the chart, the S&P 500 shows consistent weakness over the 1-12 week timeframe following these signals.
NOTE: Due to size limitations, the chart only displays the last 20 signals.
Percentage of Members above the 50-Day MA Risk-Off Model
The percentage of members above the 50-Day moving average risk-off model seeks to identify instances in history when a low number of Index members are trading above their respective 50-day average as the Index hovers near a high. The model will issue two separate alerts based upon specific participation thresholds.
Components
Signal Criteria
- Signal 1: Members > 50-day MA <= 65%, S&P 500 near high, subsequent drop below 50%.
- Signal 2: Members > 50-day MA <= 54.5%, S&P 500 near high, subsequent negative 5-day ROC.
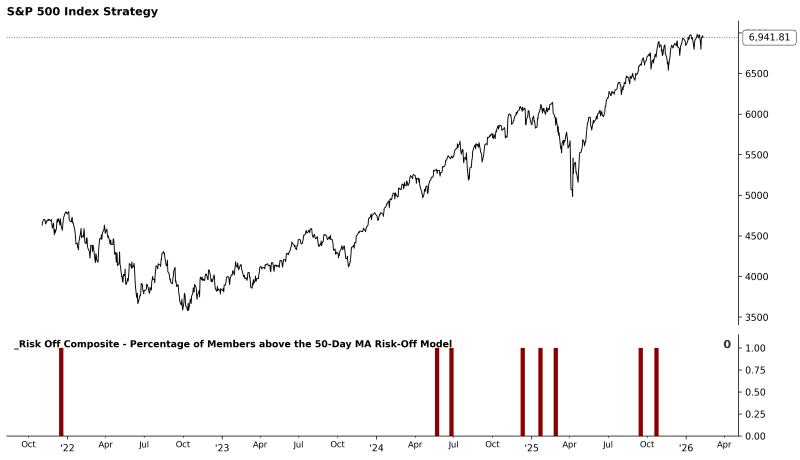
Current Day Chart
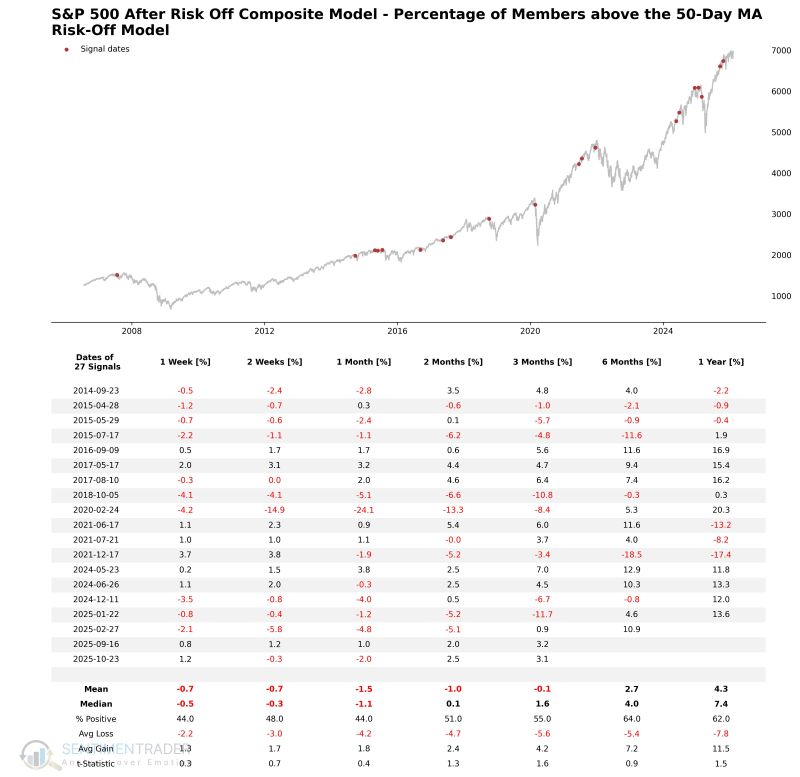
Signal Performance
As you can see, the model performance is weak over the 1-4 week timeframes.
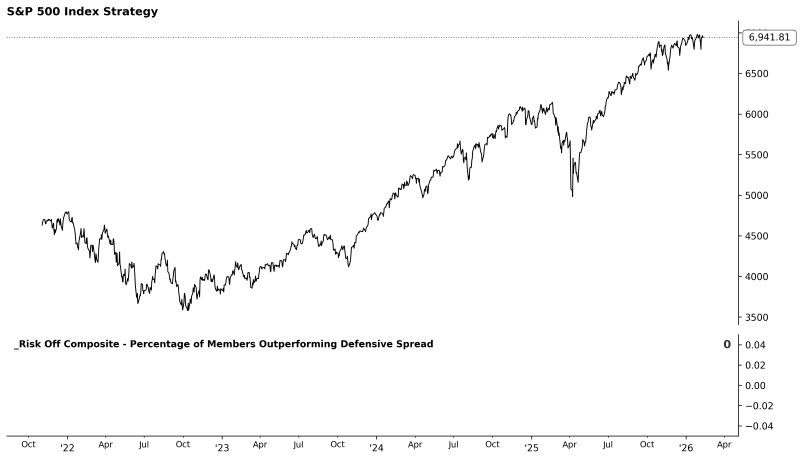
Percentage of Members Outperforming Defensive Spread
This model calculates a composite index by determining the spread between individual sector indices and the S&P 500. It then counts the number of defensive sector groups where the spread exceeds a user-defined threshold, indicating defensive leadership.
Components
- Percentage of Consumer Staple / Health Care / Utility / S&P 500 Members Outperforming the S&P 500 Index
Signal Criteria
- Condition 1 = The Composite Index breaks above 2.1 (Defensive sectors outperforming).
- Condition 2 = Within 15 days of Condition 1, the S&P 500 drops below its 75% price range rank while still being within 2% of a 252-day high.
- If the above logic path is satisfied, a Defensive Outperformance Risk-Off signal is issued.
Current Day Chart
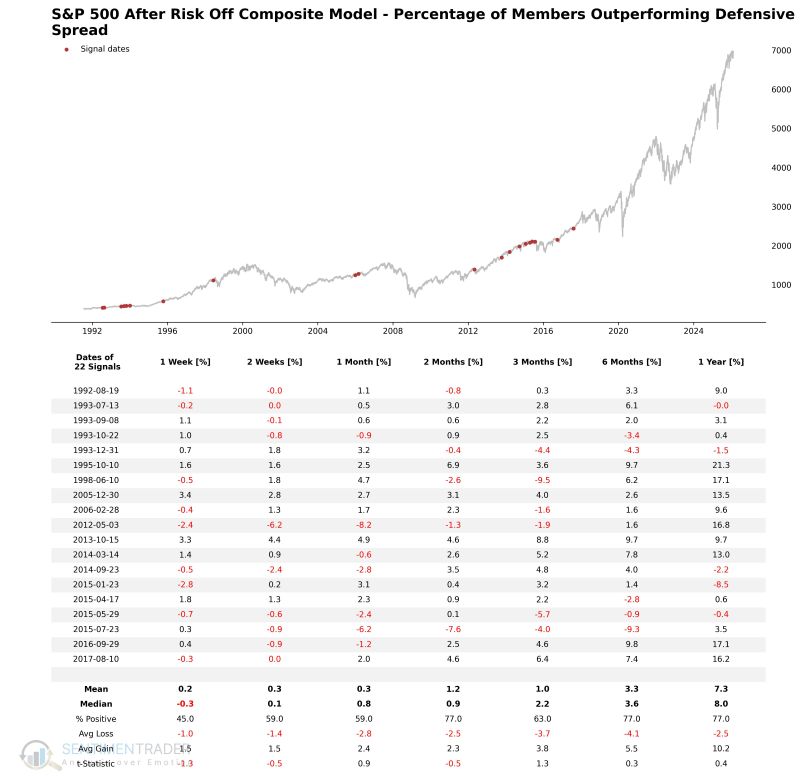
Signal Performance
As shown in the table below, the signal performs quite weakly in the short term.
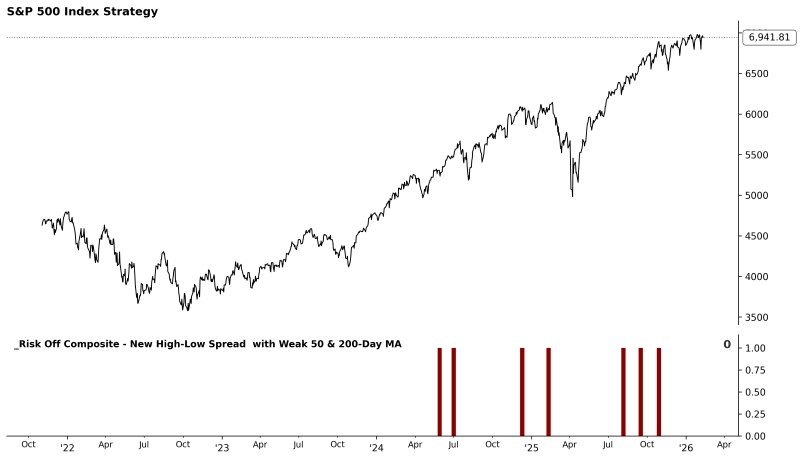
New High-Low Spread with Weak 50 & 200-Day MA
This model aims to identify structural breakdowns at market tops by monitoring the extreme divergence between the number of new highs and new lows. Its core logic is to capture "breadth deterioration": even if the S&P 500 remains near historical highs, if the proportion of stocks hitting new highs drops significantly while new lows begin to rise, and a majority of stocks have fallen below medium-to-long-term moving averages, it indicates that the internal structure supporting the index has become extremely fragile.
Components
- Percentage of S&P 500 members at 21-Day Highs/Lows
- Percentage of S&P 500 members above 50/200-Day MA
Signal Criteria
- Condition1 = 21-Day High-Low % Spread <= 0% (today)
- Condition2 = 21-Day High-Low % Spread <= 25% (2 days prior)
- Condition3 = 21-Day High-Low % Spread <= 10% (1 days prior)
- Condition4 = S&P 500 Index <= 3% from a 252-day high
- Condition5 = Number of members above the 50-day MA <= 55%
- Condition6 = Number of members above the 200-day MA <= 70%
- If Conditions 1-6 are met, a High-Low Spread Risk-Off signal is issued.
Current Day Chart
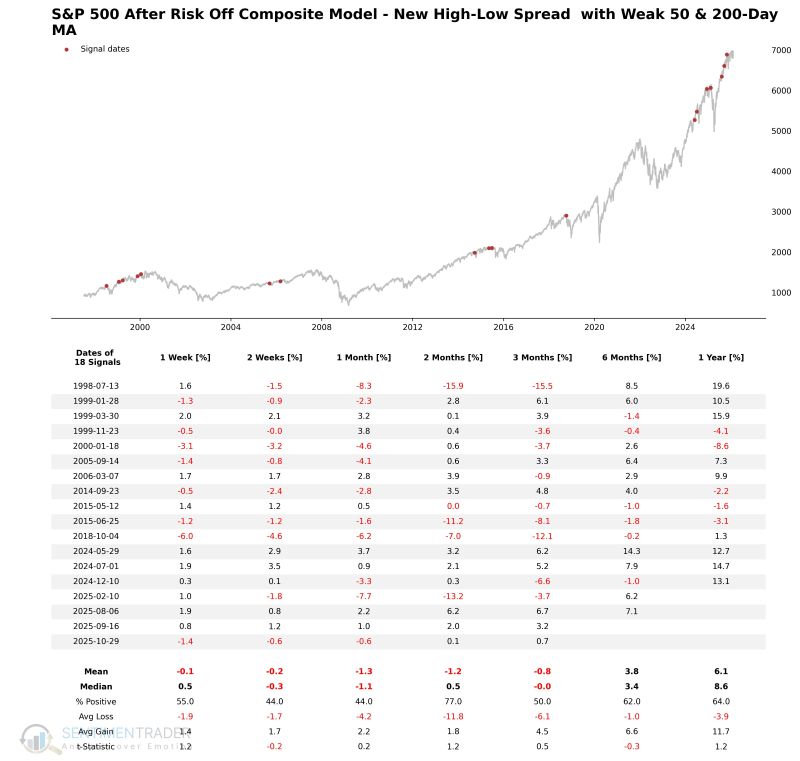
Signal Performance
As shown in the table below, the S&P 500 performs weakly over the 1-4 week timeframe.
Breadth Composite Divergence
This model aims to identify a classic bull market exhaustion divergence: when the index appears extremely strong on the surface, but its internal support (a composite indicator combining long-term moving average performance and high-low spreads) has withered to quarterly lows. The model issues a risk-off signal by identifying price breakdowns following such deep divergences.
Components
- Percentage of Issues above the 200-Day Moving Average
- Percentage Spread Between 252-Day Highs and Lows
Signal Criteria
- Condition 1 = Index Price Range Rank >= 90% (Strong Price).
- Condition 2 = Breadth Composite Range Rank <= 30% (Weak Internals).
- Condition 3 = Within 10 days of the divergence, the Index drops below the 80% price range rank AND breadth remains weak.
- If the above conditions are met, a Breadth Composite Divergence Risk-Off signal is issued.
Current Day Chart
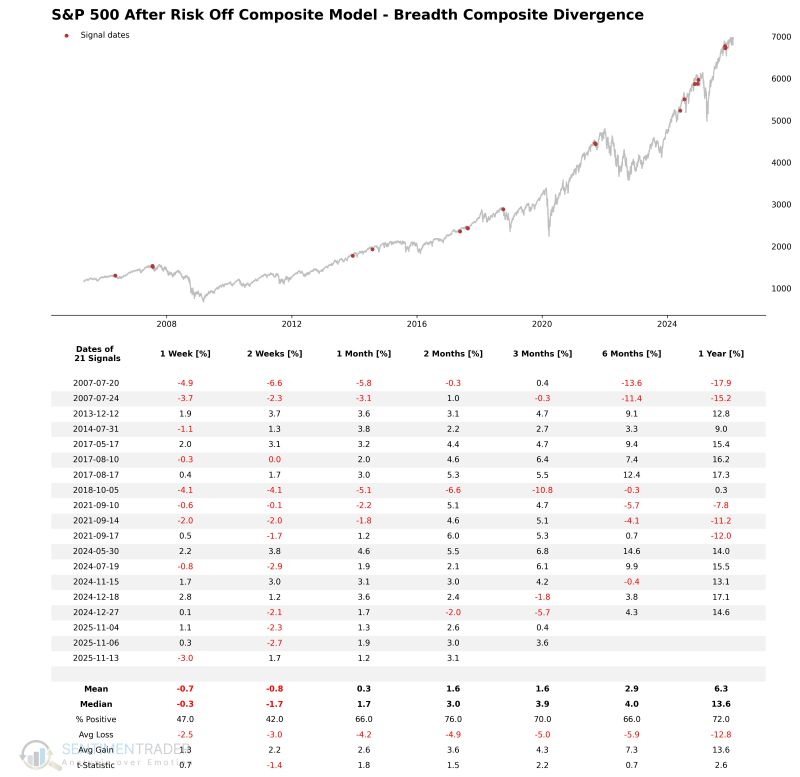
Signal Performance
As shown in the table below, short-term performance is weak following a composite breadth divergence signal.
What the research tells us...
The Risk-Off Composite Model serves as a critical counterbalance to our trend-following systems. By monitoring the market's internal engine-breadth, participation, and defensive rotation-it detects when the "engine" is sputtering even as the "car" (price) keeps moving forward. When the composite score elevates (>= 60%) and momentum falters, it provides an objective, evidence-based warning to reduce risk exposure, helping investors avoid significant drawdowns often masked by headline index strength.