
Absolute & Relative Trend Update

Today's note intends to provide some input on what I'm seeing with my absolute and relative trend following indicators for domestic and international groups. As always, the goal is to provide you with some new information that hopefully confirms or contrasts your research process.
Data as of 4/23/21 close. All relative comparisons are versus the S&P 500 ETF (SPY). For absolute and relative indicator definitions, please scroll down to the end of the note.
ABSOLUTE & RELATIVE TRENDS
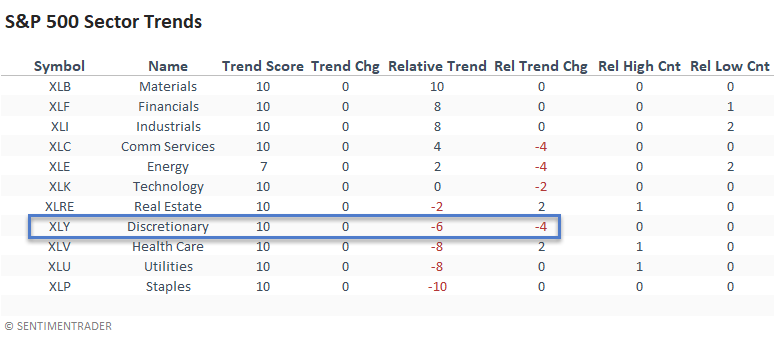
The absolute trend scores for all sectors look exceptional, with 10/11 groups posting a perfect score. One should expect this type of profile in a bull market. When I glance at the relative trend score, we see a more mixed bag. While it's not a surprise to see the traditionally defensive groups with negative relative trend scores, the consumer discretionary sector caught my attention. Typically, it performs well on a comparable basis in year two after a bear market bottom.
HISTORICAL RELATIVE PERFORMANCE
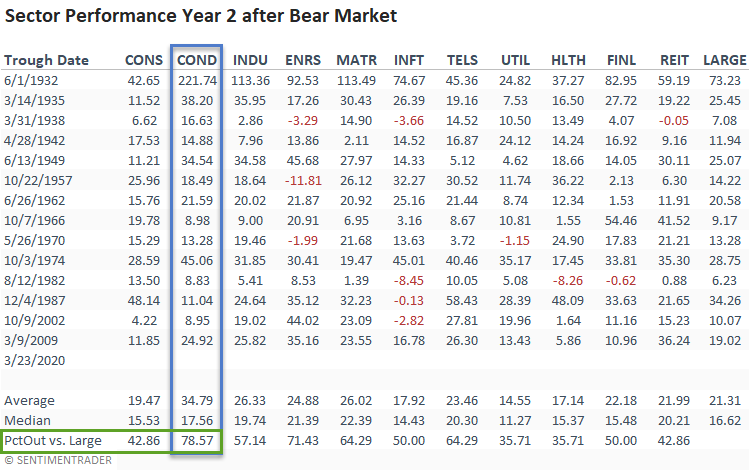
The table shown below is from a note that I posted on 3/25/21 that reviewed style and sector performance in year two after a bear market bottom. The weak relative trend profile in the consumer discretionary sector looks unusual when compared to history. Whenever I see something that stands out in the cap-weighted group, I like to review the equal-weighted version to see if there is mega-cap stock influence on performance.
ABSOLUTE & RELATIVE TRENDS
The equal-weighted consumer discretionary relative trend score of 10 confirmed my suspicion that mega-cap stocks had hindered relative performance for the cap-weighted discretionary sector. One of the main culprits is AMZN, as it has been consolidating since its peak in September 2020. The weak relative trends in the defensive groups also confirm the trends in the cap-weighted version. I would also note that real estate registered two relative highs last week with an increase in its relative trend score.
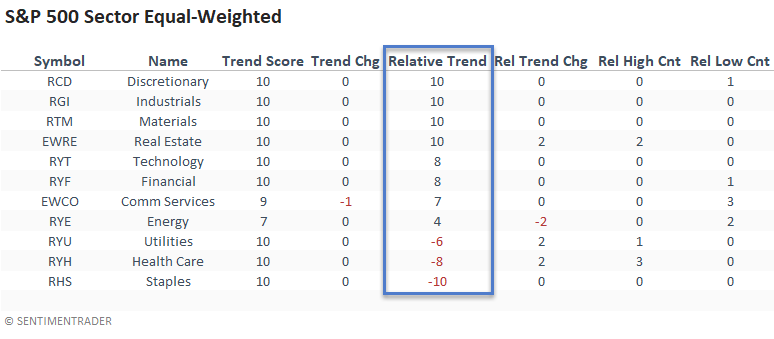
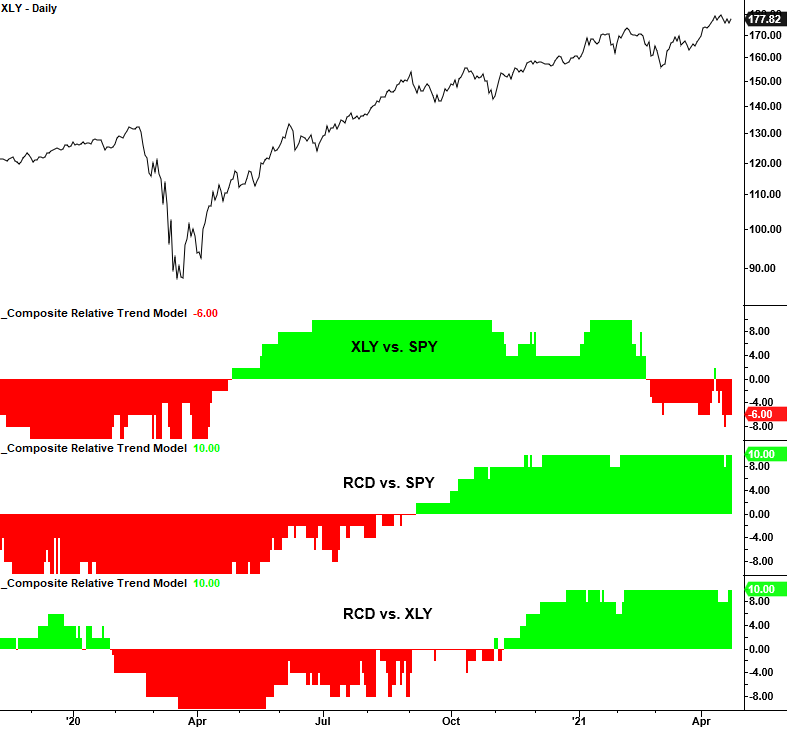
CHART IN FOCUS - CAP VS. EQUAL-WEIGHT DISCRETIONARY
The following chart emphasizes why one should focus on individual stocks within the consumer discretionary sector, as the equal-weight discretionary group is outperforming the cap-weighted S&P 500 and discretionary group.
ABSOLUTE & RELATIVE TRENDS
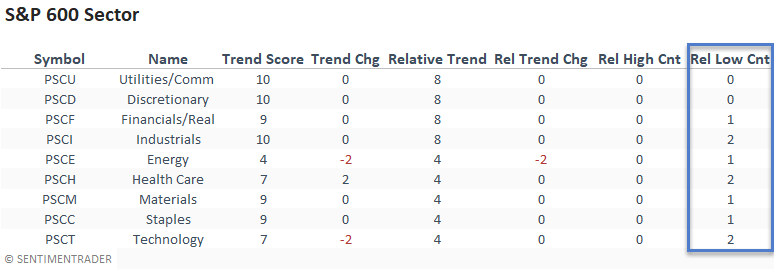
Small-cap relative trends versus the S&P 500 look okay. However, several groups registered 1-month relative lows last week.
 ABSOLUTE & RELATIVE TRENDS
Homebuilders continue to look solid as it was the only Industry Group to registered a new 1-month relative high last week. I would also note that the equal-weighted retail group confirms the strength in the equal-weighted discretionary sector.
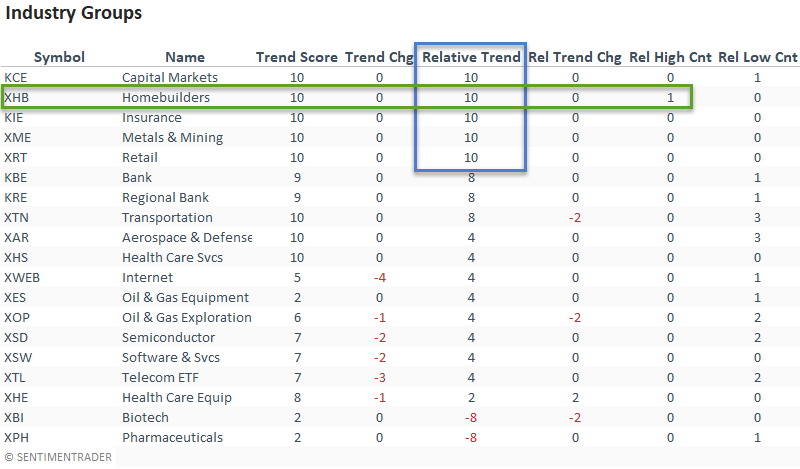
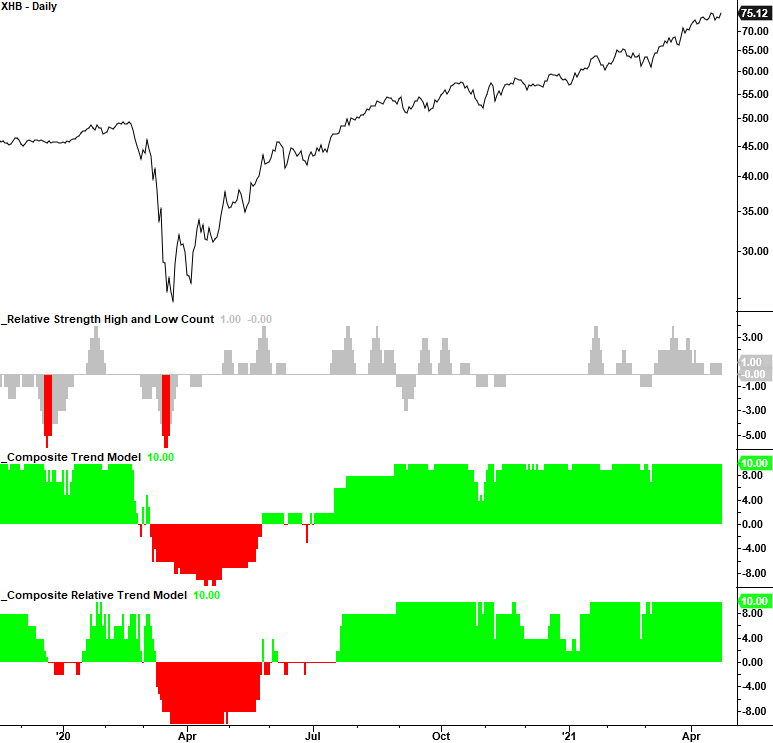
CHART IN FOCUS - HOMEBUILDERS
ABSOLUTE & RELATIVE TRENDS
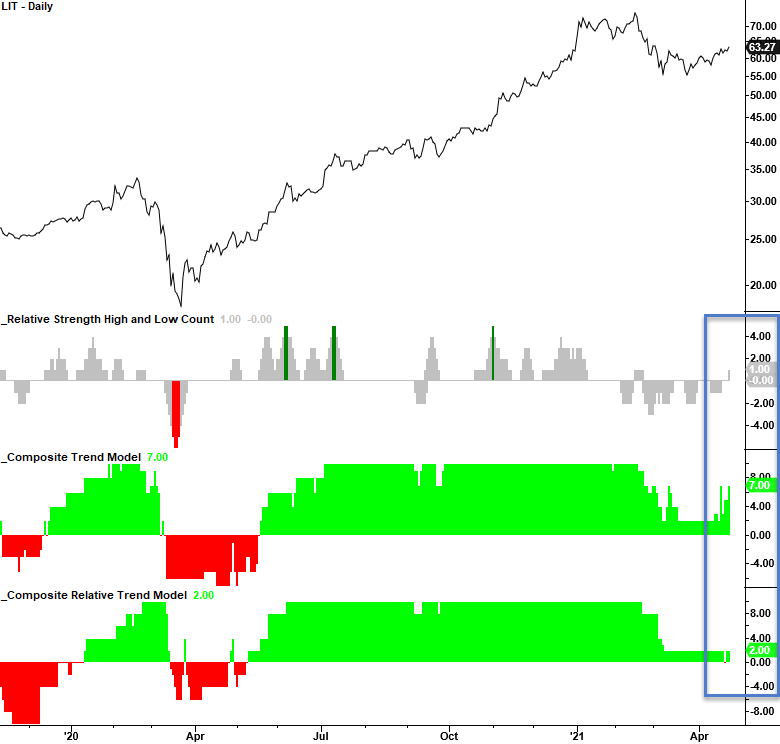
A majority of thematic growth groups registered new 1-month relative lows versus the S&P 500 last week. However, the Lithium & Battery Technology group bucked the trend with a new relative high. The group is trying to regain its former favorable absolute and relative trend profile.
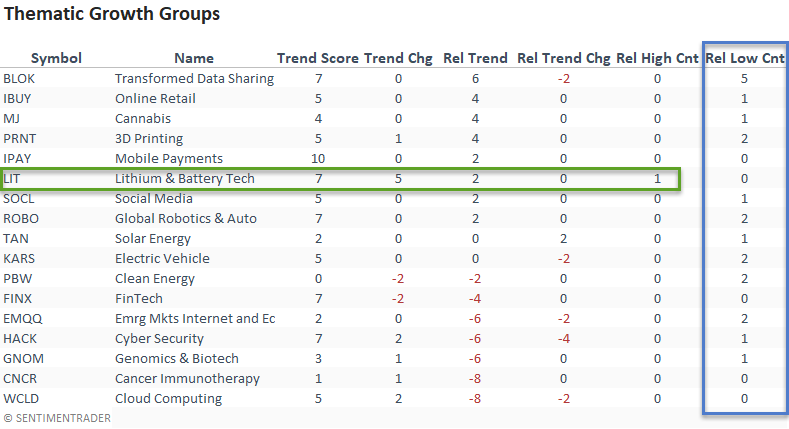
CHART IN FOCUS - LITHIUM & BATTERY TECHNOLOGY
ABSOLUTE & RELATIVE TRENDS
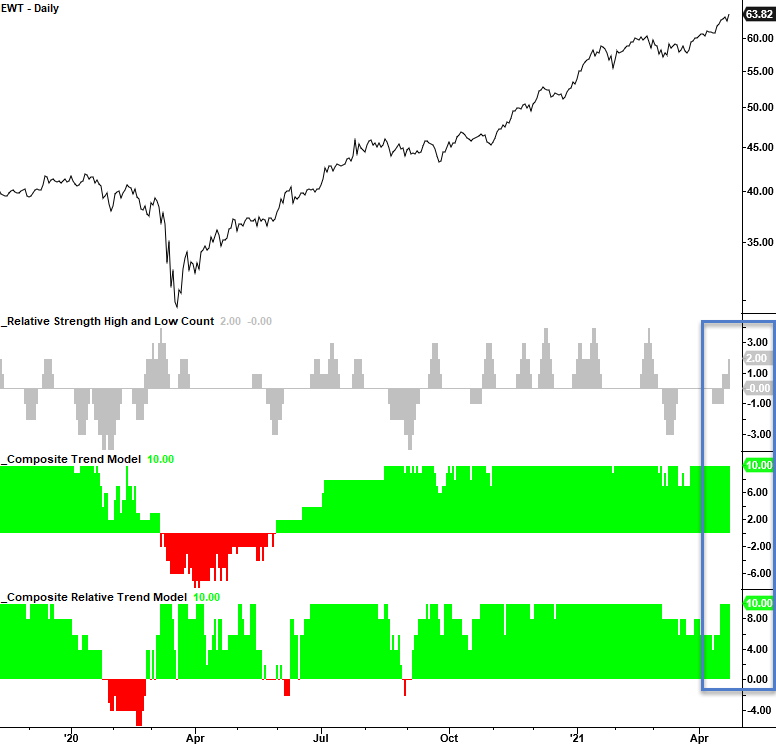
Ireland, Vietnam, Sweden, Taiwan, and the Netherlands maintain perfect relative trend scores versus the S&P 500. I would note that Taiwan and Vietnam registered new relative highs versus the S&P 500 last week. From a big-picture relative perspective, international markets continue to underperform the U.S. As of Friday, more groups had a negative relative trend score versus a positive one.
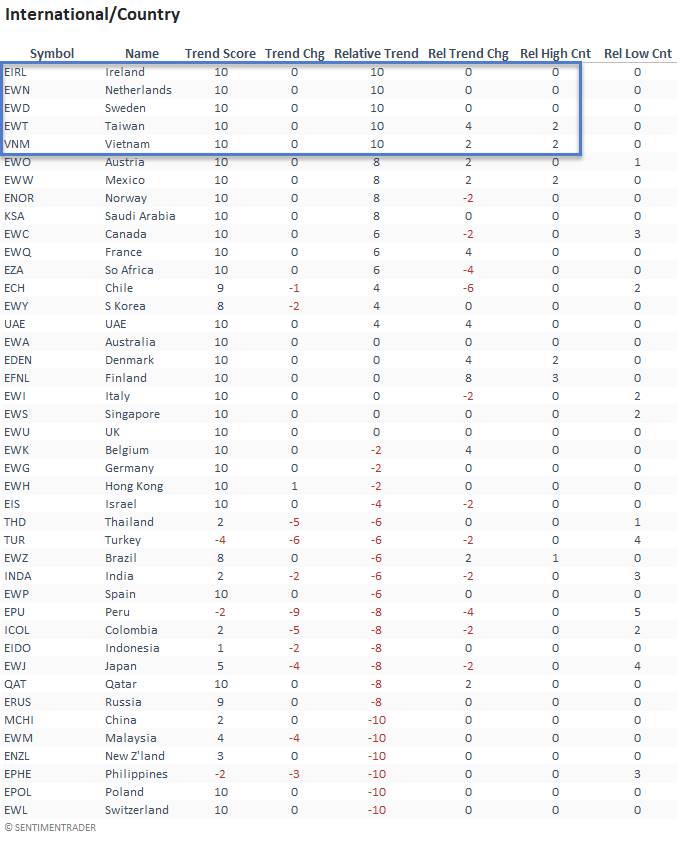
CHART IN FOCUS - TAIWAN
ABSOLUTE AND RELATIVE TREND COLUMN DEFINITIONS
1.) Absolute Trend Count Score - The absolute trend model contains ten indicators to assess absolute trends across several durations.
2.) Absolute Trend 5-Day Change - This indicator measures the 5-day net change in the absolute trend model.
3.) Relative Trend Count Score - The relative trend model contains ten indicators to assess relative trends across several durations. Relative to S&P 500.
4.) Relative Trend 5-Day Change - This indicator measures the 5-day net change in the relative trend model.
5.) Relative High Count - This indicator measures the number of 21-day relative highs versus the S&P 500 in the last 5 days.
6.) Relative Low Count - This indicator measures the number of 21-day relative lows versus the S&P 500 in the last 5 days.
Absolute and Relative Trend Scores - 10 (Best) to -10 (Worst)