
Absolute & Relative Trend Update

The goal of today's note is to provide you with some insight into what I am seeing with my absolute and relative trend following indicators for domestic and international ETFs.
Data as of 6/4/21 close. All relative comparisons are versus the S&P 500 ETF (SPY). For absolute and relative indicator definitions, please scroll down to the end of the note.
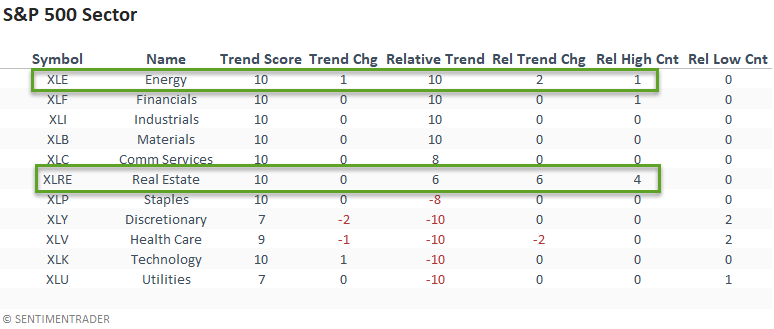
ABSOLUTE & RELATIVE TRENDS - SECTOR ETFS
The market continues to favor a value/cyclical tilt. Energy re-claimed a perfect relative trend score ranking with solid outperformance versus the broad market. Performance in the cap-weighted real estate sector showed a noticeable improvement with an increase in the relative trend score and new relative highs on 4/5 days.
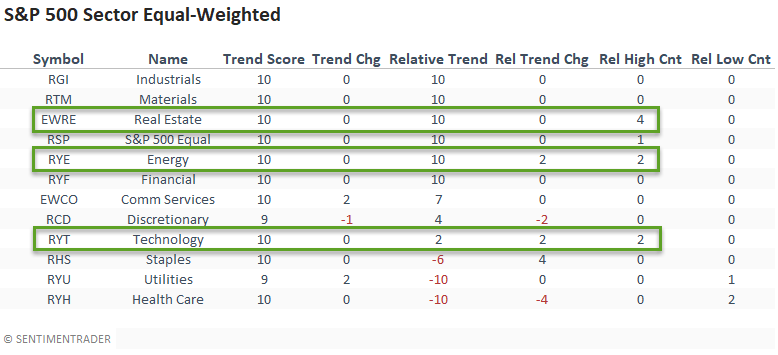
The equal-weighted real estate and energy sectors confirmed the strength in the cap-weighted versions by registering several new relative highs last week. The slight improvement in the equal-weighted technology sector is worth mentioning given the weak trends of late.
I included the S&P 500 equal-weight ETF in the table this week. I would note the perfect relative trend score versus the cap-weighted version.
Several small-cap sectors recorded an improvement in relative trend scores and registered new relative highs. Small-cap energy continues to outpace the broad market and large-cap energy stocks.
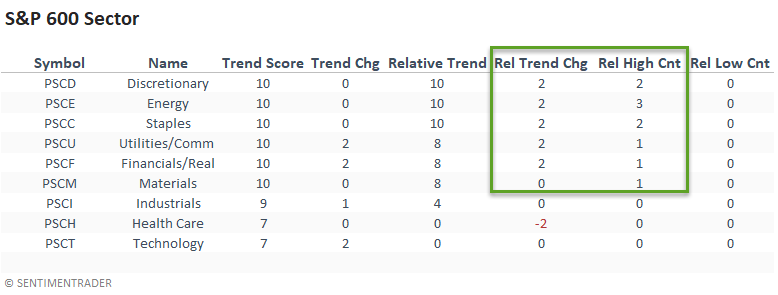
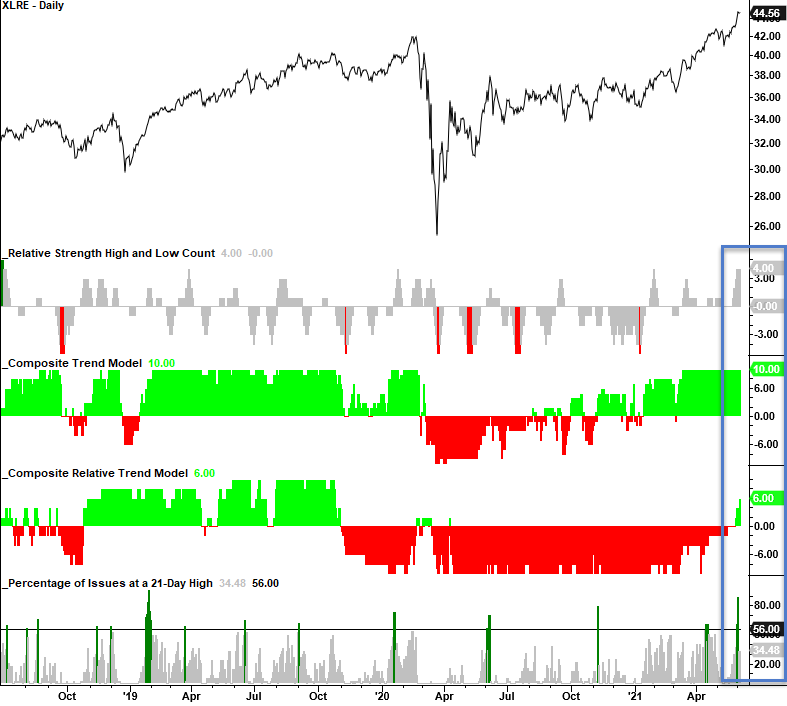
CHART IN FOCUS - S&P 500 REAL ESTATE
While the equal-weighted real estate sector has been strong of late, the cap-weighted version has underperformed the broad market. However, the cap-weighted version joined the party last week with a nice improvement across several indicators. I would also note that internal participation is solid, with the most significant increase in 21-day highs since January 2019.
ABSOLUTE & RELATIVE TRENDS - INDUSTRIES
Industry trends continue to favor value/cyclical groups. I noted the improvement in the aerospace and defense group in the previous week, and the industry had a solid week with an increase in the relative trend score and new relative highs on 4/5 days. The deterioration in transportation is worth mentioning as the group could not sustain the strength from a few weeks ago.
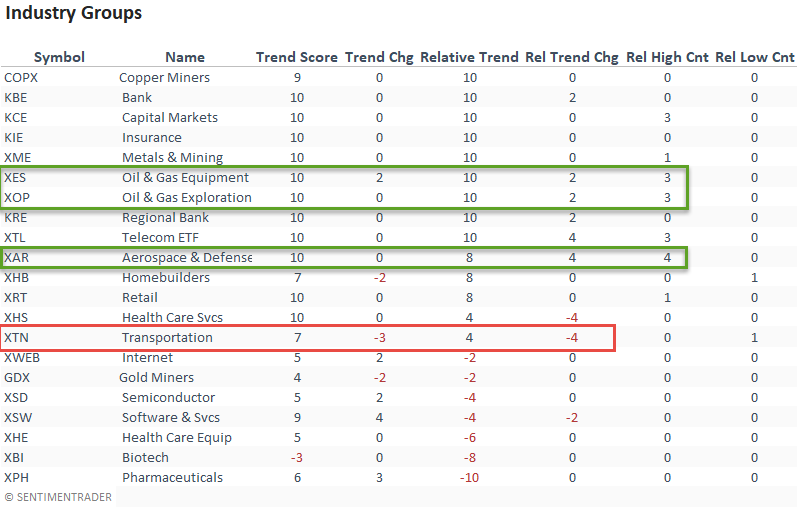
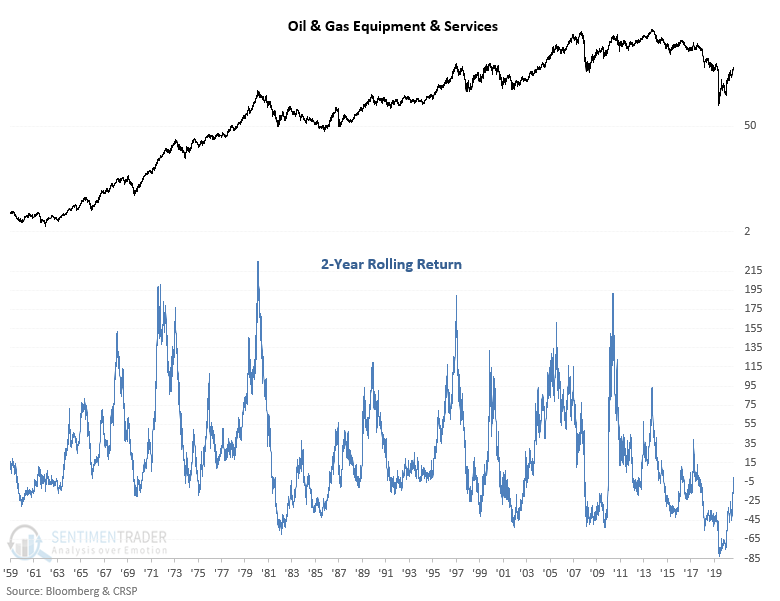
CHART IN FOCUS - OIL & GAS EQUIPMENT & SERVICES
The Oil & Gas Equipment & Services sub-industry outperformed the broad market in a meaningful way last week. Even with a massive move from the pandemic lows, the equipment and service stocks are still well below a 2-year rolling return level that would warrant caution.
ABSOLUTE & RELATIVE TRENDS - THEMATIC ETFS
The Lithium & Battery Technology ETF performed well and registered a new relative high on 4/5 days last week. I would also note that the electric vehicle ETF matched the Lithium ETF with a similar number of relative highs.

ABSOLUTE & RELATIVE TRENDS - COUNTRIES
If I sort the Country table by relative trend score change, it clearly shows an improvement from emerging market ETFs. Brazil and Taiwan are leading the way. Please see the following links for some trading signals in emerging market countries.
- Brazil - Ibovespa Index (IBOV) - Percentage of Issues with RSI > 70 Surge
- India - S&P BSE Sensex Index Momentum Thrust
- Taiwan (TWSE) Bollinger Band Buy Signal

CHART IN FOCUS - BRAZIL (EWZ)
Brazil had the best week of any emerging market country with a noticeable jump in the relative trend score and new relative highs on 4/5 days. The EWZ ETF broke above a significant pivot high and now has a clear path until the next resistance area around the 47-48 level.

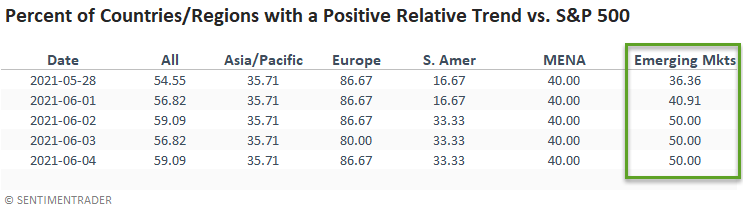
GLOBAL RELATIVE TRENDS
While still below a level that would warrant a broad-based allocation, emerging markets improved on a w/w basis.
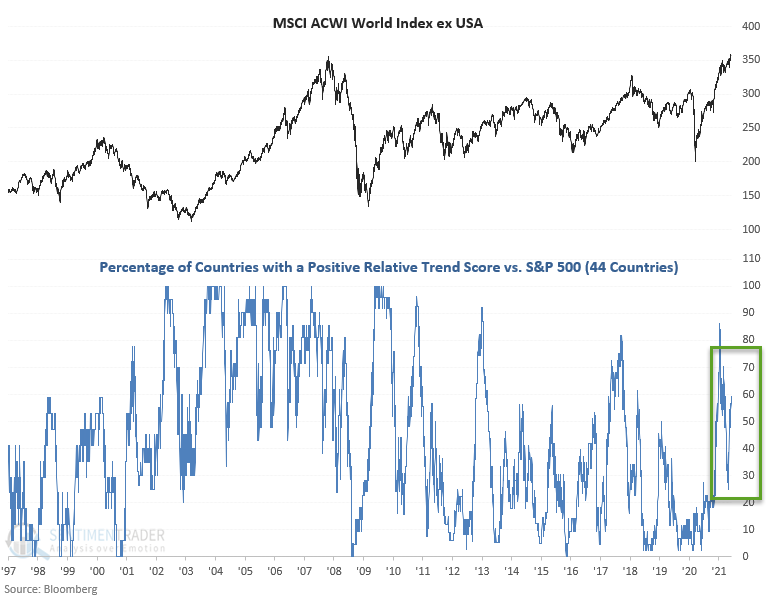
GLOBAL RELATIVE CHART
The all-country relative trend score indicator improved last week. Still, it remained below the level that would warrant a higher global allocation.
ABSOLUTE AND RELATIVE TREND COLUMN DEFINITIONS
- Absolute Trend Count Score - The absolute trend model contains ten indicators to assess absolute trends across several durations.
- Absolute Trend 5-Day Change - This indicator measures the 5-day net change in the absolute trend model.
- Relative Trend Count Score - The relative trend model contains ten indicators to assess relative trends vs. the S&P across durations.
- Relative Trend 5-Day Change - This indicator measures the 5-day net change in the relative trend model.
- Relative High Count - This indicator measures the number of 21-day relative highs vs. the S&P 500 in the last 5 days.
- Relative Low Count - This indicator measures the number of 21-day relative lows vs. the S&P 500 in the last 5 days.
- Absolute and Relative Trend Scores range from 10 (Best) to -10 (Worst)