
Absolute & Relative Trend Update

The goal of today's note is to provide you with some insight into what I am seeing with my absolute and relative trend following indicators for domestic and international ETFs.
Data as of 6/18/21 close. All relative comparisons are versus the S&P 500 ETF (SPY). For absolute and relative indicator definitions, please scroll down to the end of the note.
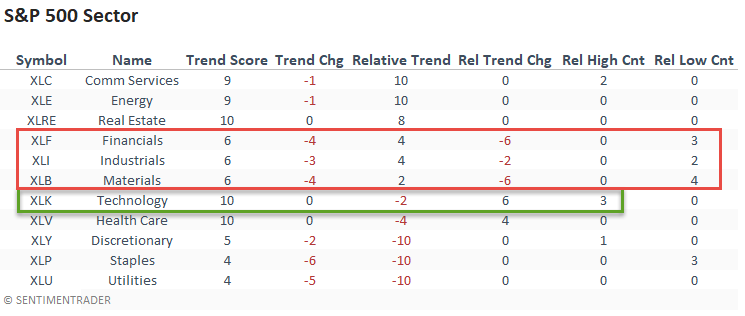
ABSOLUTE & RELATIVE TRENDS - SECTOR ETFS
The Dollar Index (DXY) surge and a flattening of the yield curve played a significant role in the w/w change in the relative trend scores for several sectors. Interestingly, the energy group did not see a downshift in its relative trend score as it remained firm. Technology once again showed some improvement. The deterioration in several absolute trend scores is noteworthy.
Please click here for a note on the surge in the Dollar Index on an FOMC decision day.
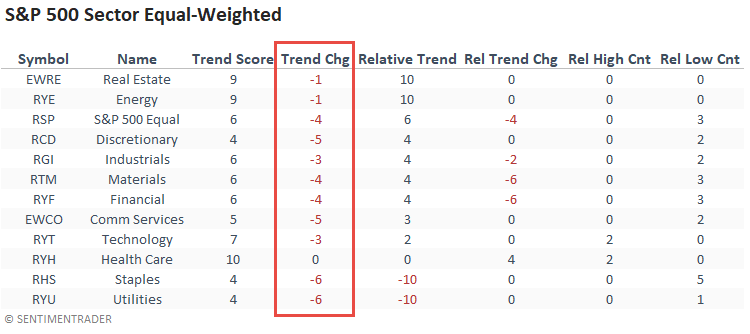
The equal-weighted industrial, material and financial sectors confirmed the deterioration in the cap-weighted indicators. I would also note that the absolute trend score for several sectors showed a meaningful decline. Price is starting to confirm the weak internal participation we noted on the most recent high in the S&P 500.
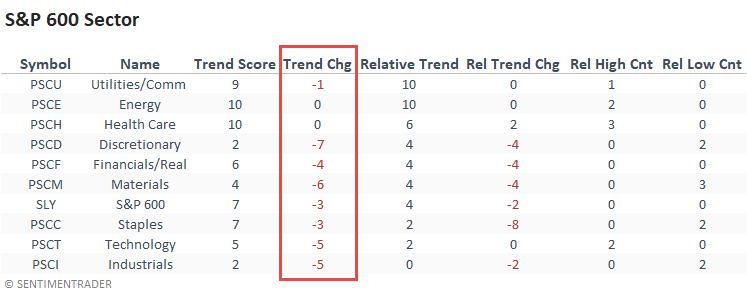
The absolute and relative trend scores for small-cap stocks showed a notable decline across most sectors with health care being the exception.
ABSOLUTE & RELATIVE TRENDS - INDUSTRIES
With a surge in the dollar and a flattening of the yield curve, growth-based industries gained at the expense of value and commodity-based groups. That said, I would note that the relative trend score for banks did not deteriorate further on a w/w basis.
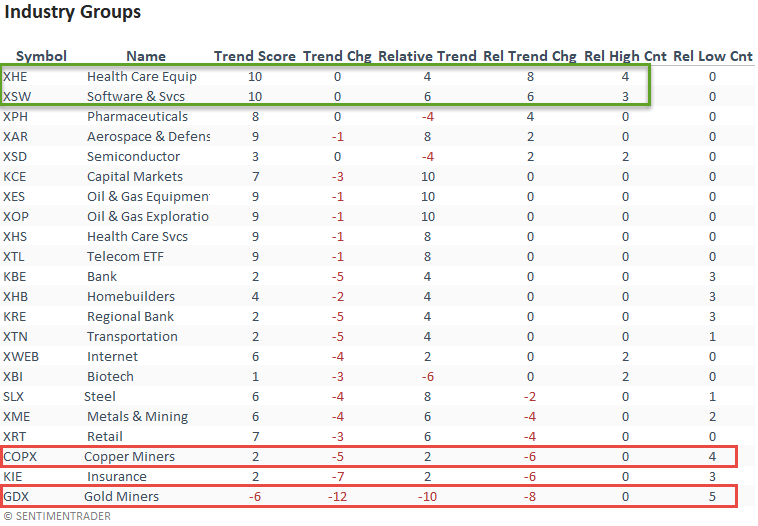
CHART IN FOCUS - Gold Miners
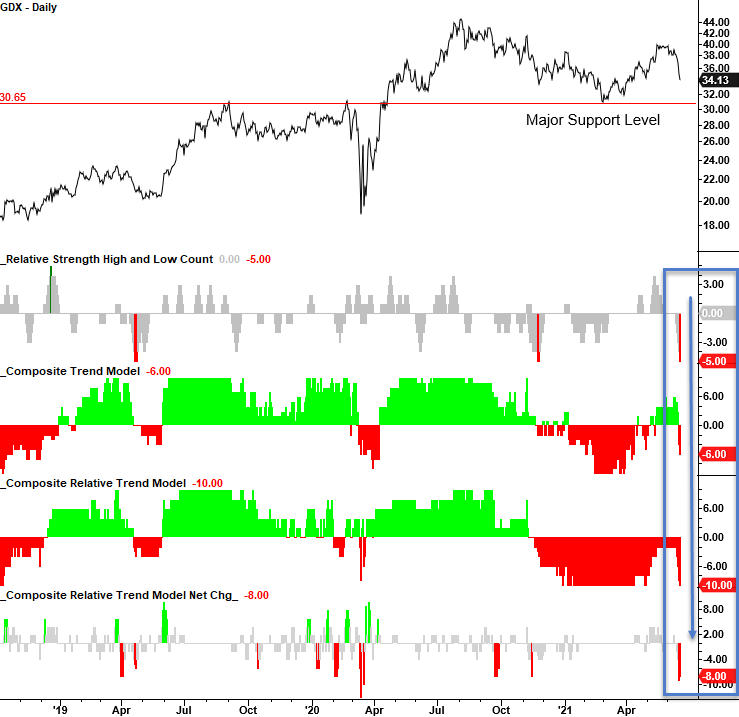
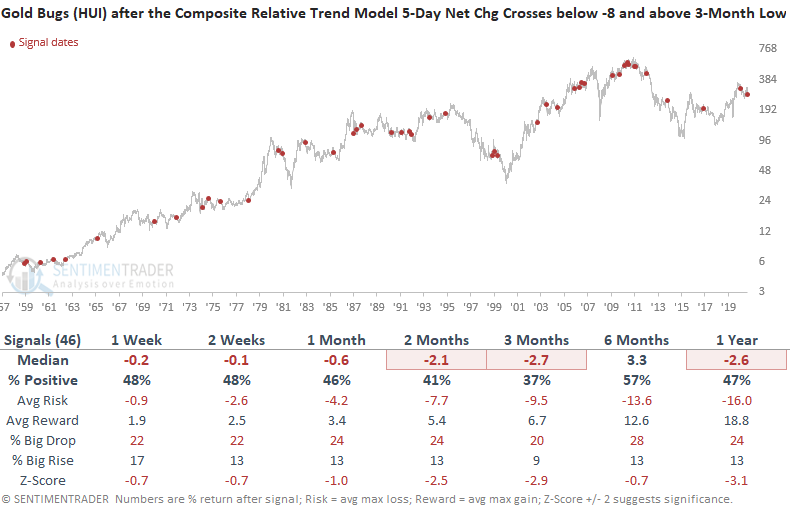
Let's conduct a study to assess forward returns when the Gold Miners composite relative trend model 5-day net change crosses below -8, and the index is above a 3-month low. i.e., the current setup. I will use the NYSE Gold BUGS Index with an extension instead of the GDX to capture more instances.
HOW THE SIGNALS PERFORMED
 ABSOLUTE & RELATIVE TRENDS - THEMATIC ETFS
Thematic trends improved last week, with cloud computing once again leading the way. Interestingly, Emerging Market Internet and Ecommerce did not participate.
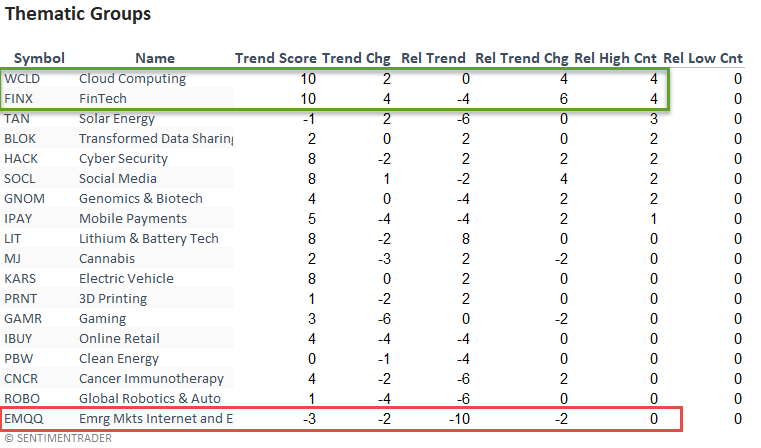
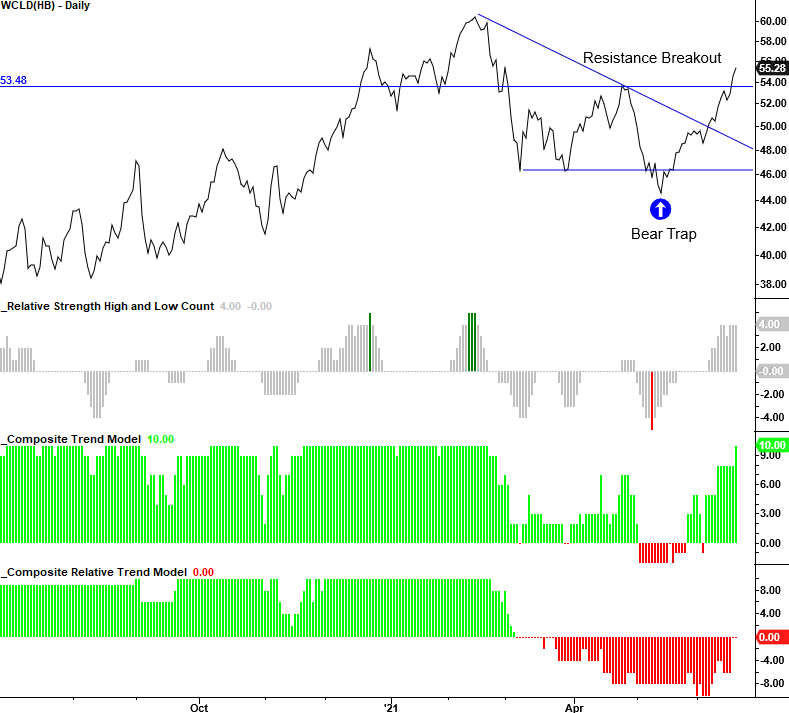
CHART IN FOCUS - CLOUD COMPUTING
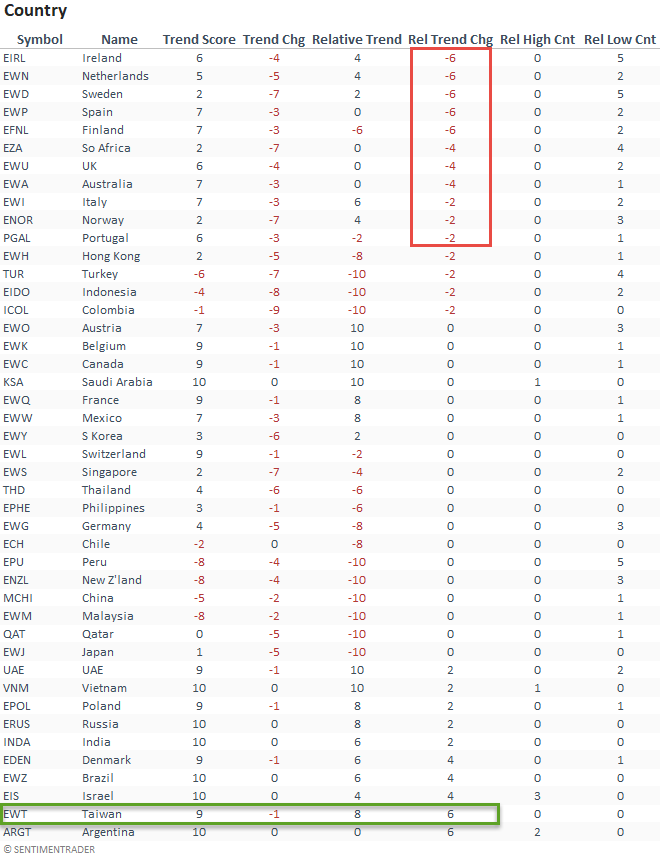
ABSOLUTE & RELATIVE TRENDS - COUNTRIES
Suppose I sort the Country table by relative trend score change. In that case, it shows several Eurozone countries had a significant decline last week. Remember, European-based indexes lean toward value. The relative trend score for Taiwan reversed higher, which is not a surprise given the heavy weighting in technology.
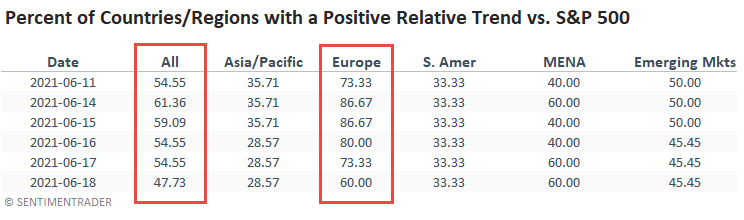
GLOBAL RELATIVE TRENDS
The percentage of total countries outperforming the S&P 500 index deteriorated last week as Europe weighed on the overall level.
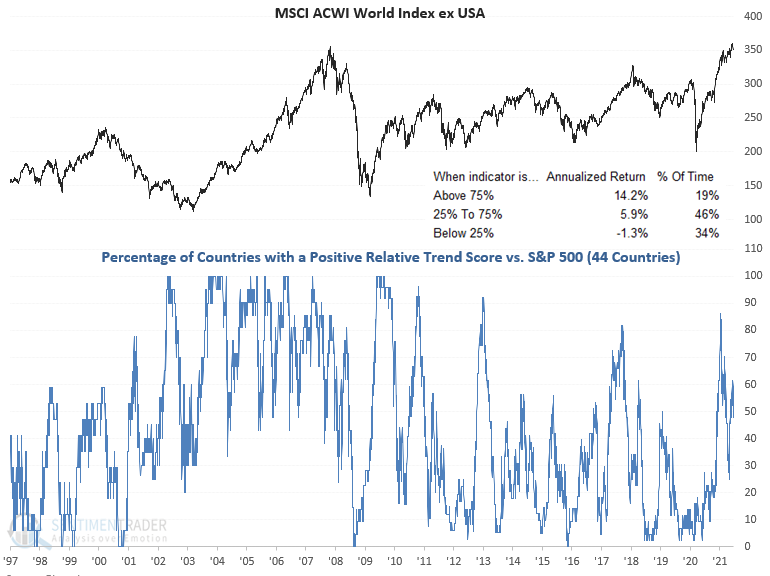
GLOBAL RELATIVE TREND CHART
ABSOLUTE AND RELATIVE TREND COLUMN DEFINITIONS
- Absolute Trend Count Score - The absolute trend model contains ten indicators to assess absolute trends across several durations.
- Absolute Trend 5-Day Change - This indicator measures the 5-day net change in the absolute trend model.
- Relative Trend Count Score - The relative trend model contains ten indicators to assess relative trends vs. the S&P across durations.
- Relative Trend 5-Day Change - This indicator measures the 5-day net change in the relative trend model.
- Relative High Count - This indicator measures the number of 21-day relative highs vs. the S&P 500 in the last 5 days.
- Relative Low Count - This indicator measures the number of 21-day relative lows vs. the S&P 500 in the last 5 days.
- Absolute and Relative Trend Scores range from 10 (Best) to -10 (Worst)