
A Warning Sign Worth Knowing About - Part I

The financial sector has had a pretty good run since the Covid low of March 2019. If we use ticker XLF (Financial Select Sector SPDR Fund) as a proxy for the financial sector, then the gain has been over +110%.
Ticker XLF remains in an uptrend but is roughly where it stood four months ago. As Dean noted in his latest Absolute & Relative Trend Update post, financials have weakened on a relative basis. While this recent weakness does not by itself constitute an outright "sell" signal, it does remind us to pay attention to signs of potential impending trouble.
So, let's take a look at a signal that you can run and save as a Favorite in the Sentimentrader Backtest Engine to be alerted when the time for caution finally does arrive.
XLF NEW LOW %
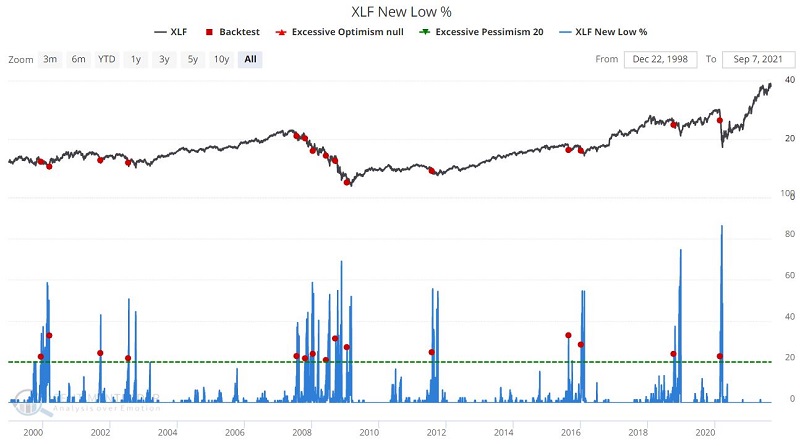
As the title implies, this indicator shows the percentage of stocks in ticker XLF (Financial Select Sector SPDR Fund ) that are currently trading at a new 52-week low. When the percentage of stocks in the portfolio hitting new 52-week lows "spikes," it signals significant weakness within the financial sector.
The XLF New Low % indicator can be launched in the Backtest Engine by clicking here. It identifies those times when:
- The percentage of XLF constituents making new 52-week lows
- Reaches or exceeds 20%
- For the first time in 60 days
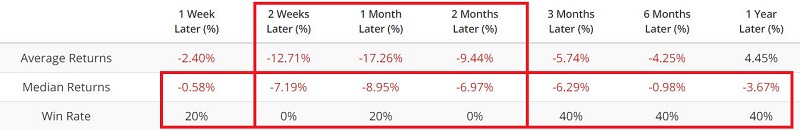
The chart below displays the signal dates since early 1999, and the table below displays some numerical results.
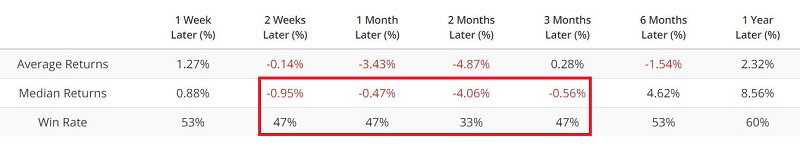
The results above are by no means "devastatingly bearish," however, they are definitely below average, with the 2-weeks to 3-months periods showing:
- Negative Median Returns
- Win Rates below 50%
These results demonstrate that a warning signal from this indicator is, in fact, a useful sign of potential trouble for financial stocks.
This raises several interesting questions:
- Isn't the financial sector often referred to as a "key" sector?
- And if it is, in fact, a key sector, wouldn't an important signal in this sector be expected to have potential ramifications beyond just the financial sector itself?
- And does this theory, in fact, hold water?
As it turns out, the answers to these questions are "Yes," "Yes," and "Yes." To illustrate this assertion, let's look at the performance of certain other securities following the same signal based on ticker XLF.
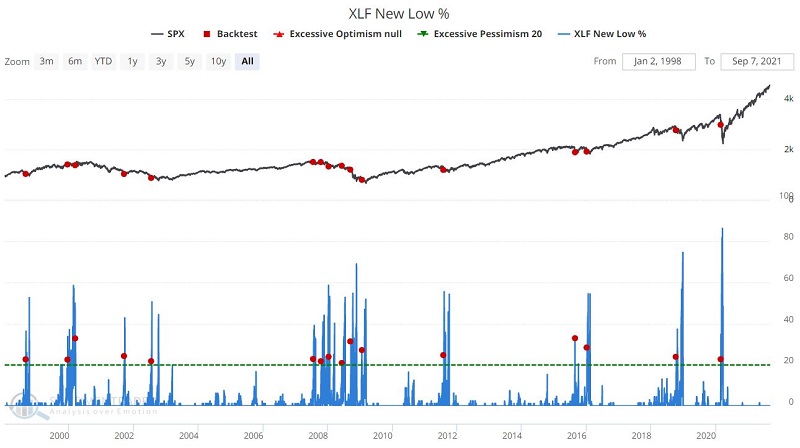
BROAD STOCK INDEXES
The chart below displays the signal dates versus the S&P 500 Index, and the table below displays some numerical results.
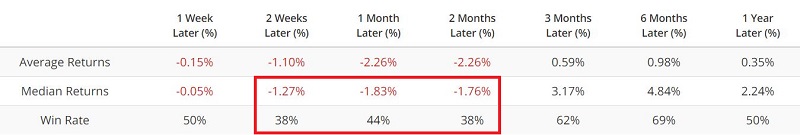
Again, the results do not scream "Sell Everything," but they do suggest that the average investor might expect below-average returns following an XLF New Low % signal.
- Median Returns through 2 months are negative
- Win Rates are well below average
- Even the Median 1-year return is just +2.24%, with only a 50% Win Rate
Now let's look at a broad international index.
The chart below displays the signal dates versus the broad international MSCI EAFE Index ETF (ticker EFA), and the table below displays some numerical results.
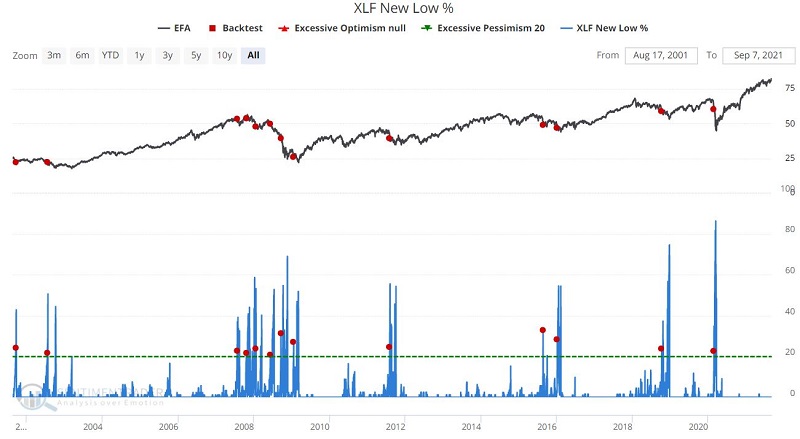
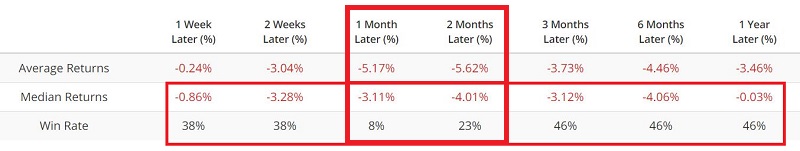
For all timeframes up to 1 Year after a signal:
- The Win Rate is less than 50%
- The Median Return is negative
- Results are particularly bearish during the 1-month and 2-month periods
So once again, the message is clear: If there is trouble in the financial sector, there will likely be trouble everywhere before long.
INTEREST RATE IMPACTED SECTORS
Now let's look at two sector ETFs that can be affected by changes in interest rates and the outlook for financial stocks and see how they performed after XLF New Low % exceeds 20% for the first time in 60 days.
The chart below displays the signal dates versus the ticker XHB (SPDR S&P Homebuilders ETF), and the table below displays some numerical results. The home construction industry tends to perform best when interest rates are low and/or declining - typically a favorable environment for financial stocks. Weakness in the financial sector can be a harbinger of trouble for home building and construction in general.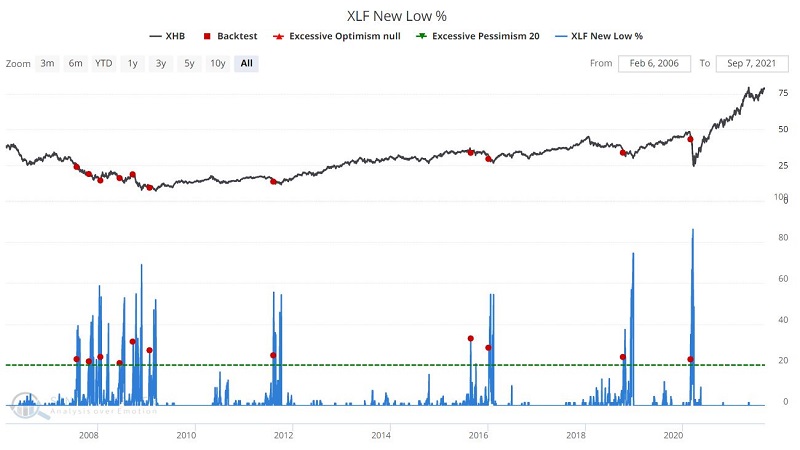
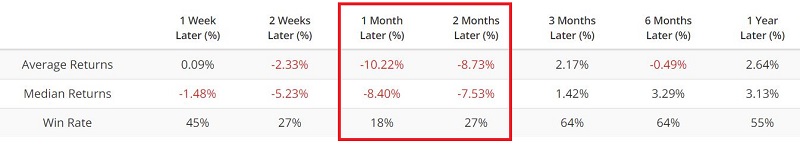
For the first 2 months after a signal:
- The Win Rate is less than 50%
- The Median Return is negative
- Results are particularly bearish during the 1-month and 2-month periods
The chart below displays the signal dates versus the ticker AMLP (Alerian MLP ETF), and the table below displays some numerical results.
Note that AMLP is an ETF that tracks the performance of the Alerian MLP Infrastructure Index and holds primarily U.S. large and mid-cap energy stocks. This type of ETF is often considered a yield play or "dividend stock" by investors seeking high income. Dividend-related securities tend to be highly sensitive to changes in the financial sector.
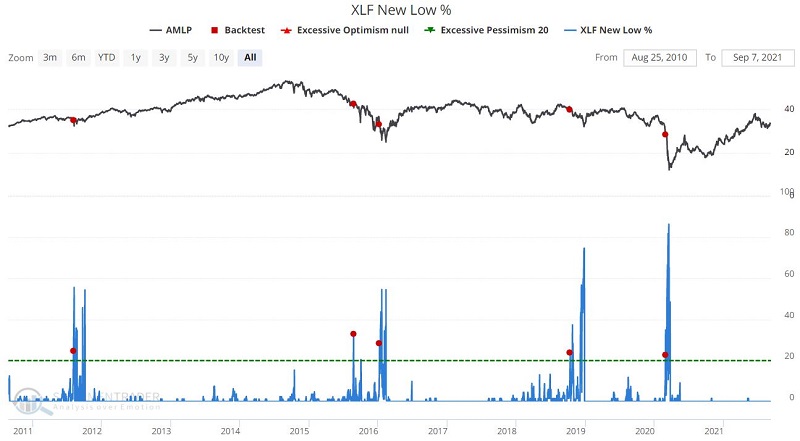
For the year after a signal:
- The Win Rate is less than 50%
- The Median Return is negative
- Results are particularly bearish during the 2-week and 2-month periods
In Part II, we will look at the action of several bond ETFs and commodities to determine if there is a wider ripple effect when the financial sector runs into trouble.