
Absolute & Relative Trend Update

The goal of today's note is to provide you with some insight into what I am seeing with my absolute and relative trend following indicators for domestic and international ETFs.
Data as of 9/3/21 close. All relative comparisons are versus the S&P 500 ETF (SPY). For absolute and relative indicator definitions, please scroll down to the end of the note.
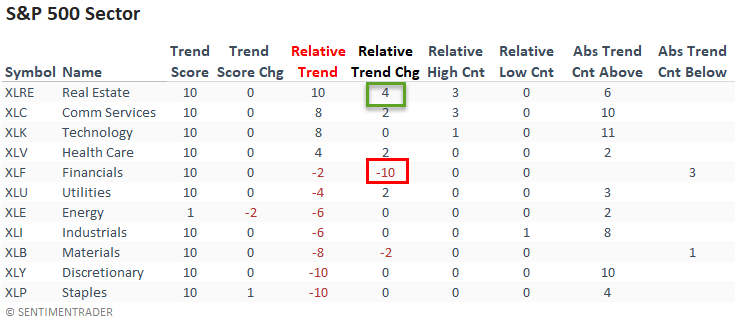
ABSOLUTE & RELATIVE TRENDS - SECTOR ETFS
The w/w volatility in the financials relative trend score is noteworthy. After a six-point increase in the previous week, financials fell out of bed last week with a ten-point decline. The good news is the sector is not registering new relative lows.
Real estate reestablished a perfect trend score combination after a four-point increase in its relative score. I would also add that the sector registered a relative high on 3/5 days.
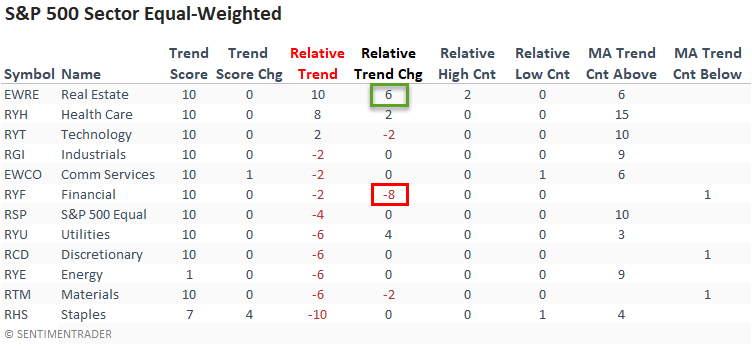
The equal-weighted financial and real estate sectors confirmed the trends in the cap-weighted data with similar relative trend score changes.
Interestingly, the health care sector has quietly established a robust absolute and relative trend score.
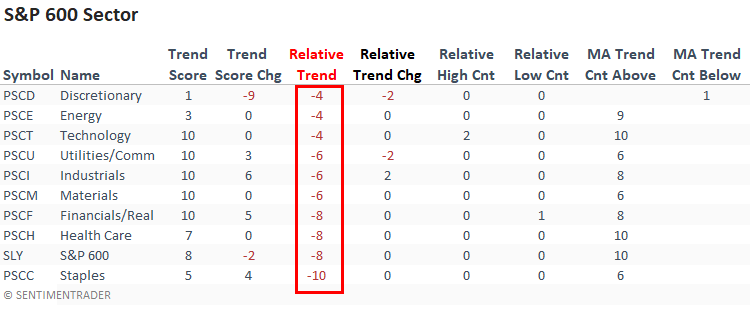
While short-term price momentum is constructive with all but one sector trading above their respective 10-day moving average, small-cap relative trends showed no improvement on a w/w basis. And, I would add that small-caps continue to show zero sectors with a positive relative trend score versus the S&P 500.
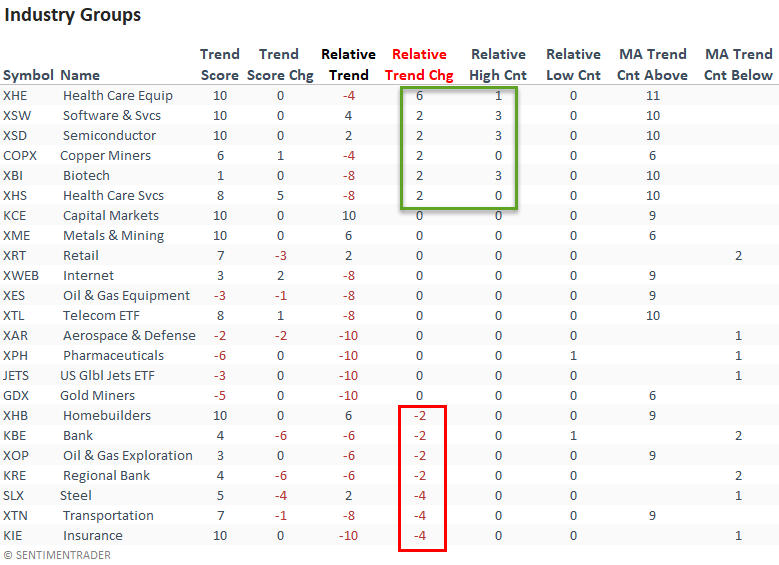
ABSOLUTE & RELATIVE TRENDS - INDUSTRIES
Suppose you sort the industry table according to the relative trend change. In that case, we see an improvement from growth-oriented industries, especially health care, and a deterioration in groups with a more cyclical tilt.
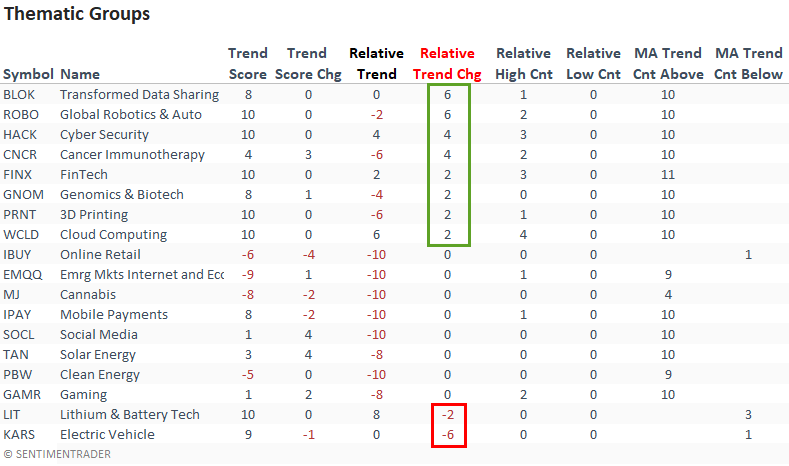
ABSOLUTE & RELATIVE TRENDS - THEMATIC ETFS
Suppose you sort the thematic ETF table according to the relative trend change. In that case, we see more groups with an improvement in relative scores versus a deterioration.
Cloud computing had the best week, with a noticeable jump in its relative trend score. And, the ETF registered a new relative high on 4/5 days.
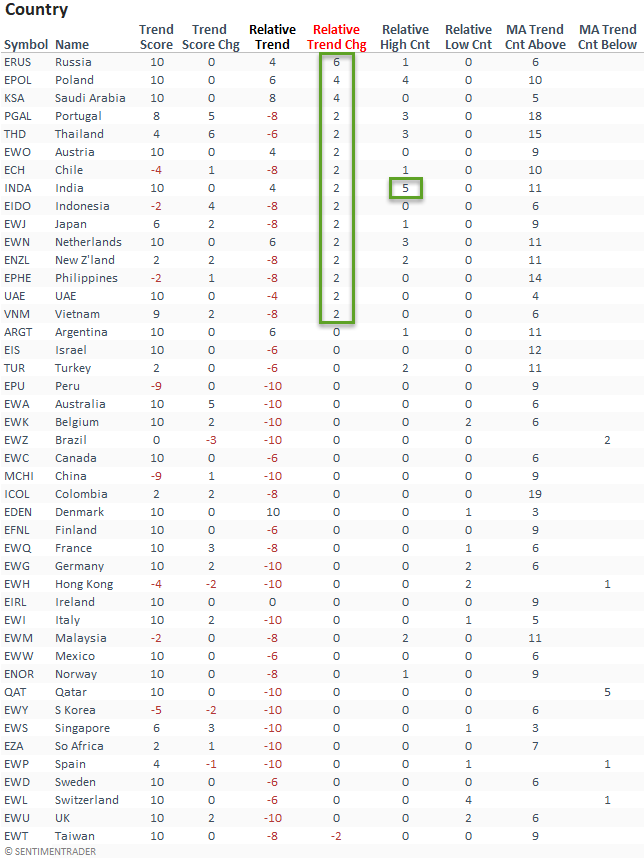
ABSOLUTE & RELATIVE TRENDS - COUNTRIES
Suppose I sort the Country table by the relative trend score column. In that case, it shows several countries with an improvement in relative scores versus a deterioration.
An emerging market country, India recorded a new relative high on each day last week.
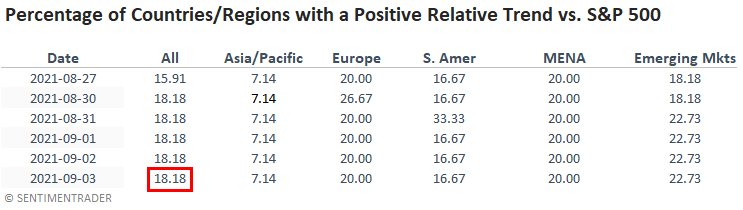
GLOBAL RELATIVE TRENDS
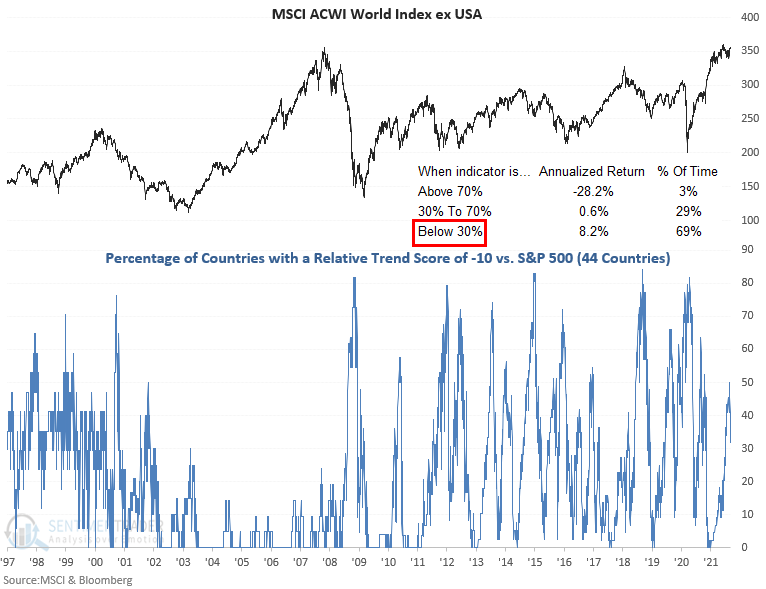
The percentage of countries with a positive relative trend score versus the S&P 500 increased on a w/w basis. The current level, while improving slightly, continues to suggest an unfavorable environment for the MSCI ACWI World Index ex USA.
ALL COUNTRY RELATIVE TREND CHART
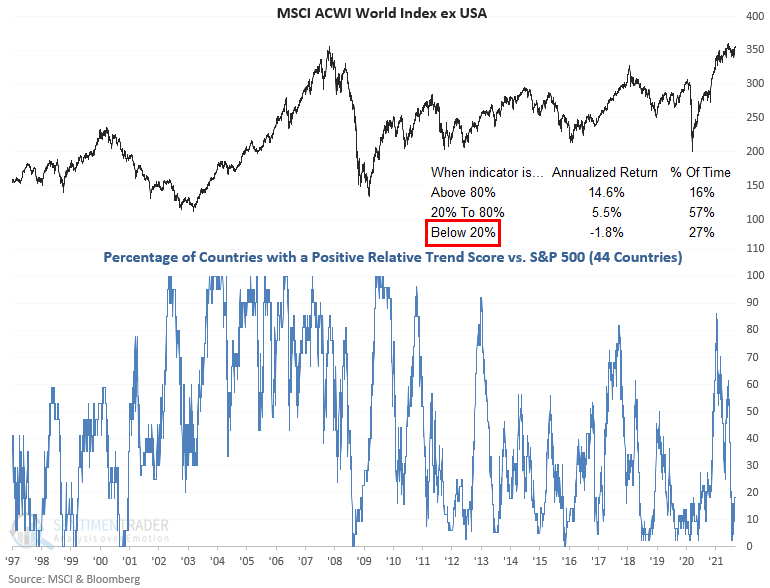
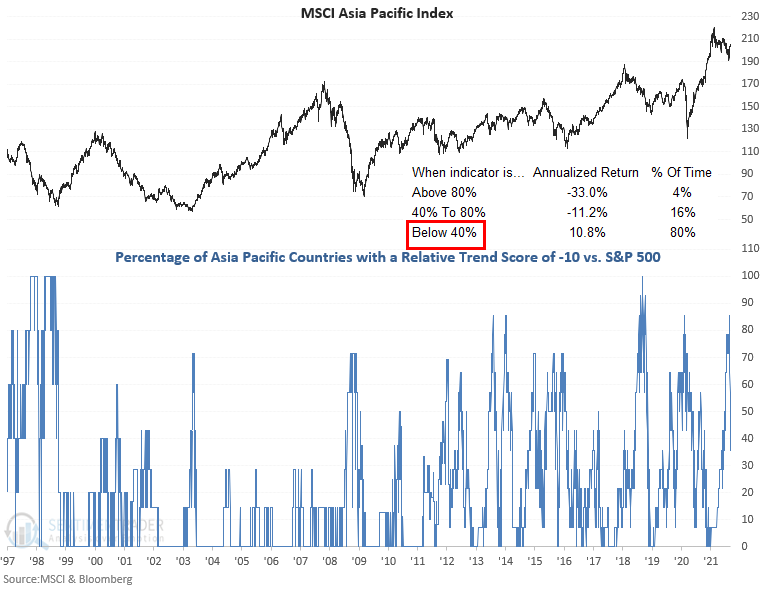
The percentage of countries with a relative trend score of -10 versus the S&P 500 registered a noticeable improvement on a w/w basis, especially in the Asia Pacific region.
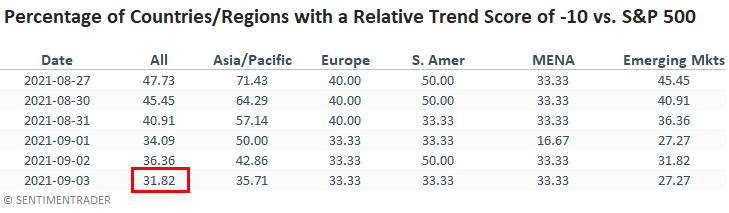
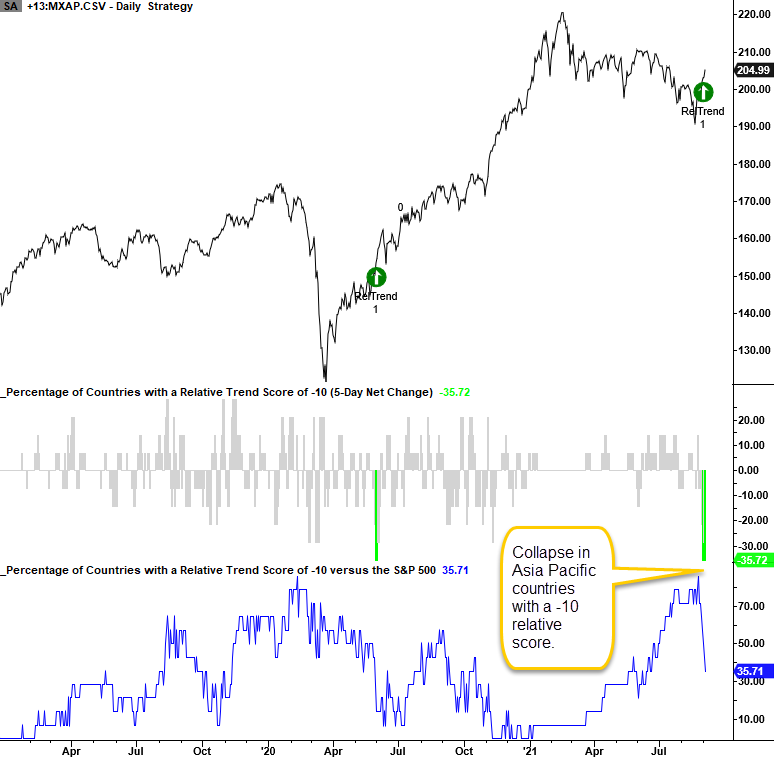
The percentage of countries in the Asia Pacific region with a relative trend score of -10 showed a sharp decline as most countries outperformed the S&P 500 on a w/w basis.
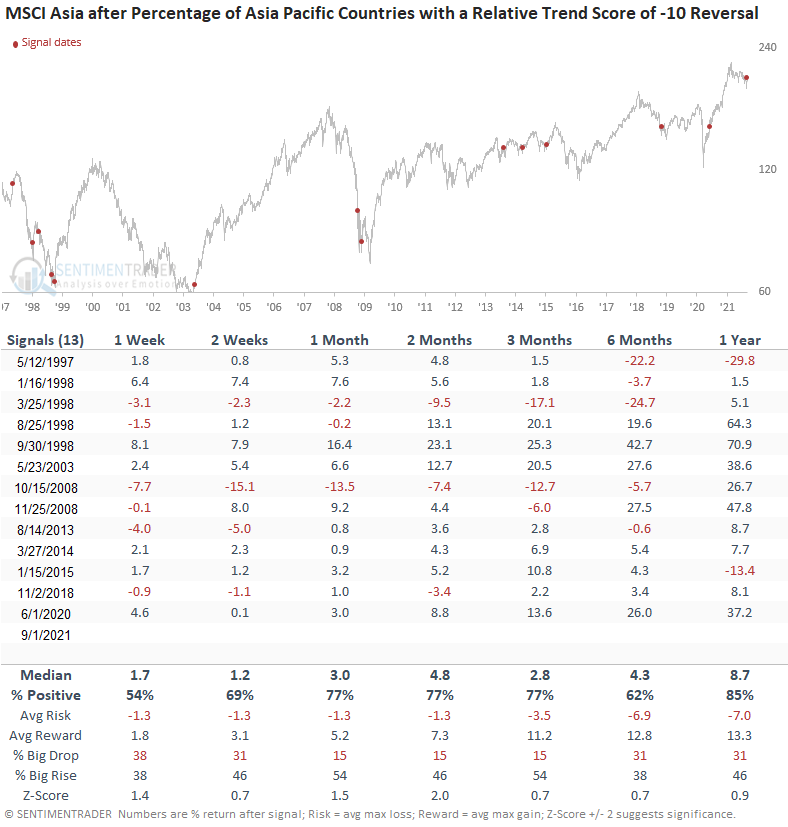
Let's conduct a study to assess the forward return outlook for the MSCI Asia Pacific Index when the 5-day net change for the percentage of countries with a relative trend score of negative ten collapses by 29% or more. I will require the percentage of countries with a relative trend score of negative ten to cross above 70% to isolate similar signals.
CURRENT DAY CHART - MSCI ASIA PACIFIC INDEX
HOW THE SIGNAL PERFORMED
Results look good across almost all timeframes, with the 2-month window showing the most robust outlook.
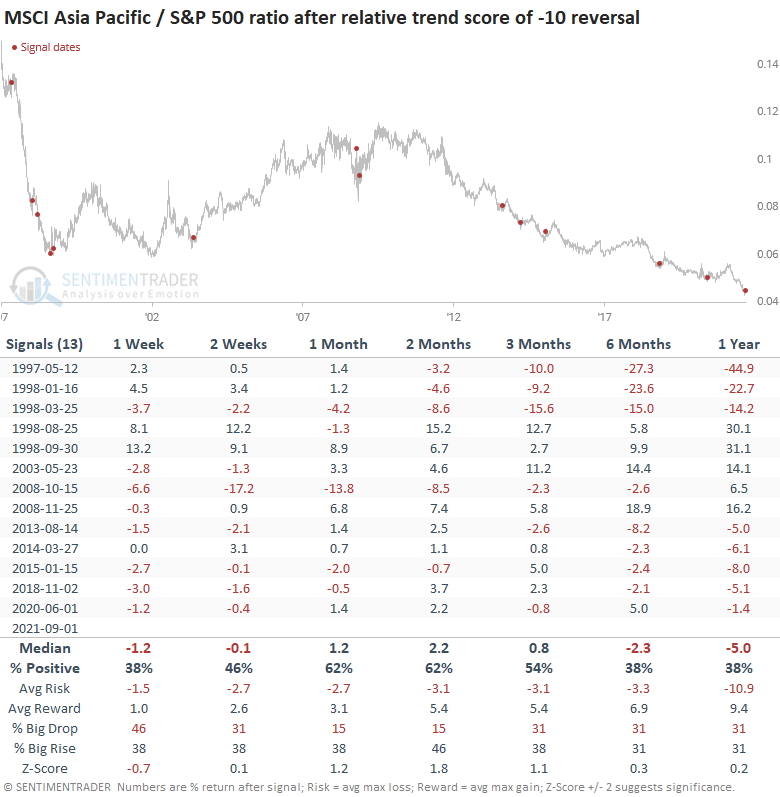
HOW THE SIGNALS PERFORMED - RELATIVE RATIO
When we assess the signal from a relative standpoint, the returns look okay in the 1-2 month period. However, the other timeframes look unfavorable.
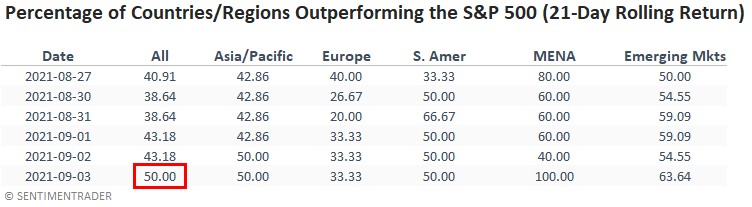
In a note on 7/7/21, I shared a study that assessed the forward return outlook for stocks when the percentage of countries outperforming the S&P 500 on a rolling 21-day basis falls to a low level. Here's a snapshot of the indicator broken down by worldwide regions.
The percentage of country ETFs outperforming the S&P 500 on a rolling 21-day basis has now reached 50%. If you recall, the level had fallen to zero in July.
ABSOLUTE AND RELATIVE TREND COLUMN DEFINITIONS
- Absolute Trend Count Score - The absolute trend model contains ten indicators to assess absolute trends across several durations.
- Absolute Trend 5-Day Change - This indicator measures the 5-day net change in the absolute trend model.
- Relative Trend Count Score - The relative trend model contains ten indicators to assess relative trends vs. the S&P across durations.
- Relative Trend 5-Day Change - This indicator measures the 5-day net change in the relative trend model.
- Relative High Count - This indicator measures the number of 21-day relative highs vs. the S&P 500 in the last 5 days.
- Relative Low Count - This indicator measures the number of 21-day relative lows vs. the S&P 500 in the last 5 days.
- Absolute and Relative Trend Scores range from 10 (Best) to -10 (Worst)
- MA Trend Cnt Above - This indicator counts the number of consecutive days above the 10-day moving average.
- MA Trend Cnt Below - This indicator counts the number of consecutive days below the 10-day moving average.