
A Risk-Off Composite Model member triggered a new warning

Key points:
- A component in the Risk-Off Composite Model issued a warning
- The system employs breadth-based indicators to detect a deterioration in stock market participation
- Similar conditions preceded negative returns for the S&P 500 over the subsequent three months
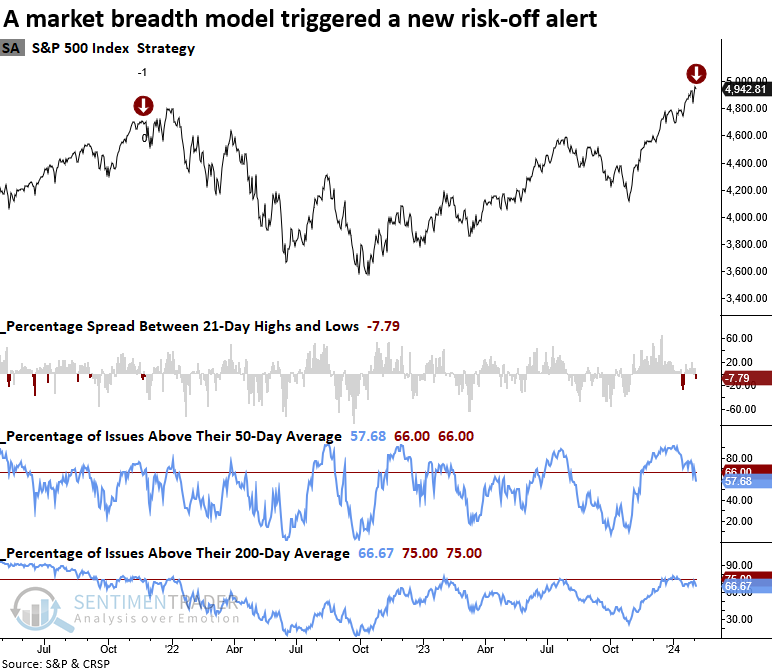
Several breadth indicators suggest participation for S&P 500 stocks is dwindling
In the last few weeks, I've shared several research reports highlighting an expansion in annual highs across a broad spectrum of sectors. These long-term breakouts are indicative of an uptrend. While long-term indicators like annual highs can suggest one thing, indicators with a shorter duration can suggest something else, which we're starting to see now.
On Monday, a new signal from a voting member in the Risk-Off Composite Model issued an alert. The component is called the New High Low Spread with a Weak % Above 50 & 200-day Average model, and it uses breadth-based indicators to identify a dwindling in stock market participation
The model requires the following criteria to issue an alert:
- S&P 500 <= 2 days from a 252-day high
- The spread between S&P 500 21-day highs and lows are < -0.5%
- The percentage of S&P 500 members above their 50-day average < 66%
- The percentage of S&P 500 members above their 200-day average < 75%
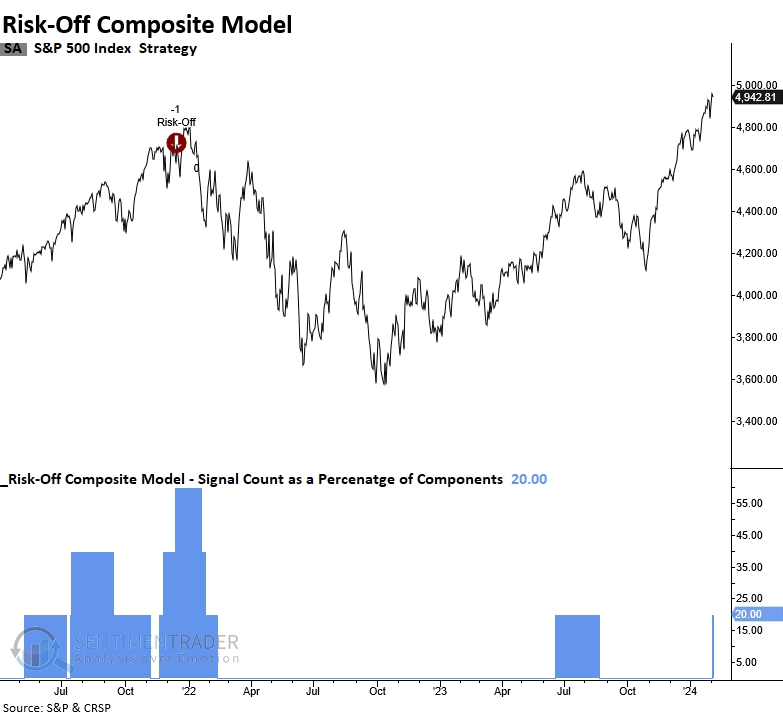
The previous alert from November 2021 was the first component in the Risk-Off Composite Model to trigger a warning. A month later, the overall composite triggered a warning.
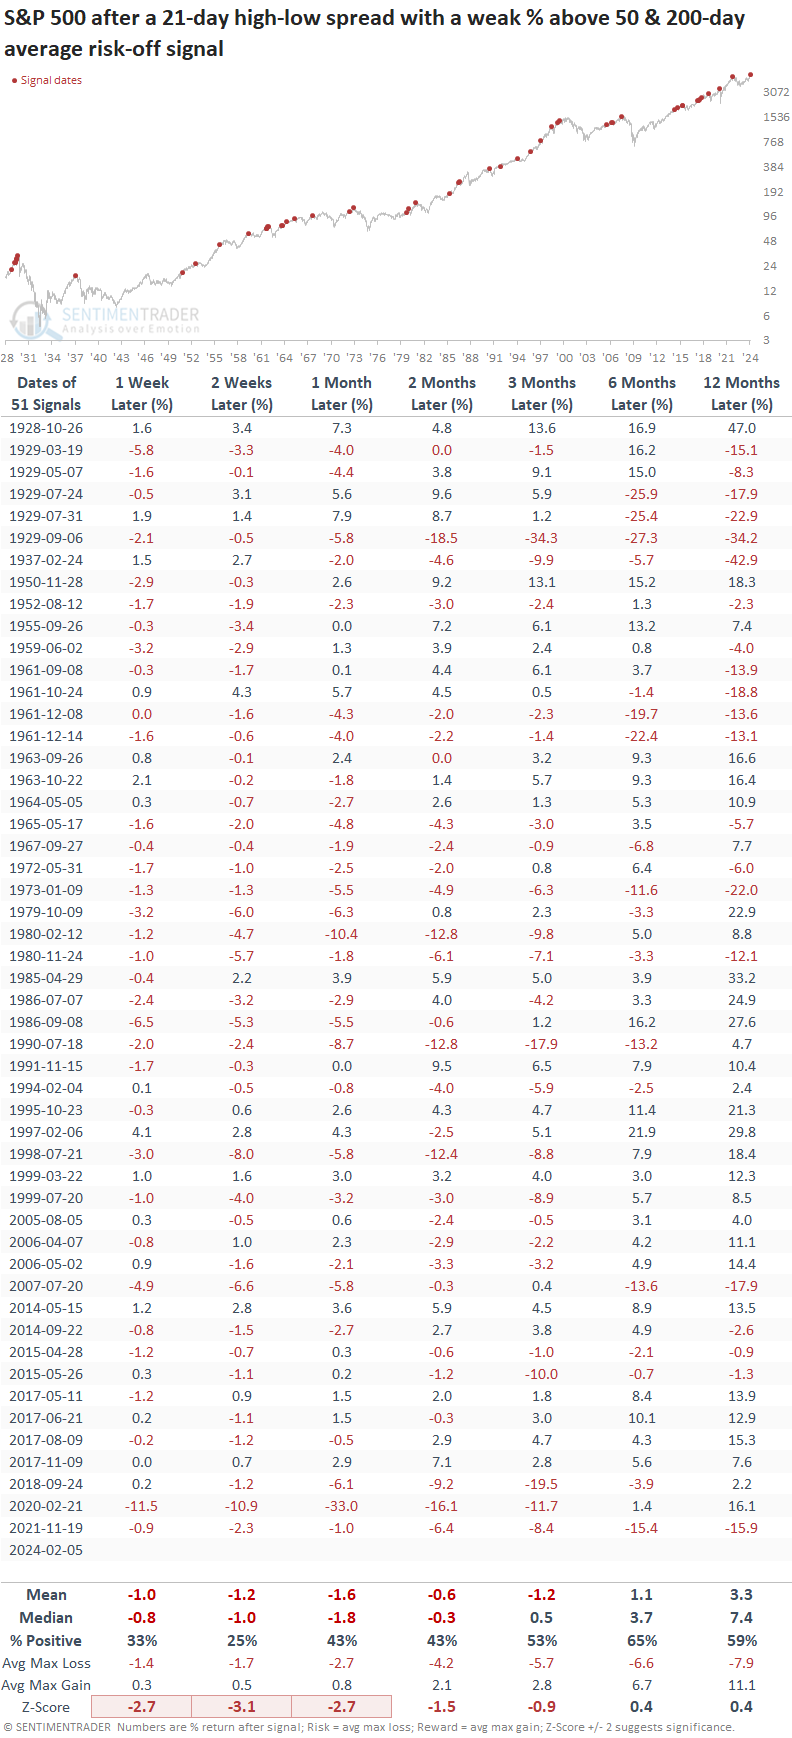
Similar breadth-based signals preceded negative returns over a medium-term horizon
In instances where the breadth-based model triggered an alert when it identified a deterioration in S&P 500 participation, the world's most benchmarked index struggled over the subsequent three months, displaying a loss in 4 out of 5 horizons using the median return.
The outlook was extremely unfavorable over the ensuing two weeks, with the S&P 500 falling 75% of the time.
A single arrow is easily broken, but not ten in a bundle - Japanese proverb
The Risk-Off Composite Model signal count increased to 20% with the new component alert. A broad model alert occurs when more than half the members issue a warning.
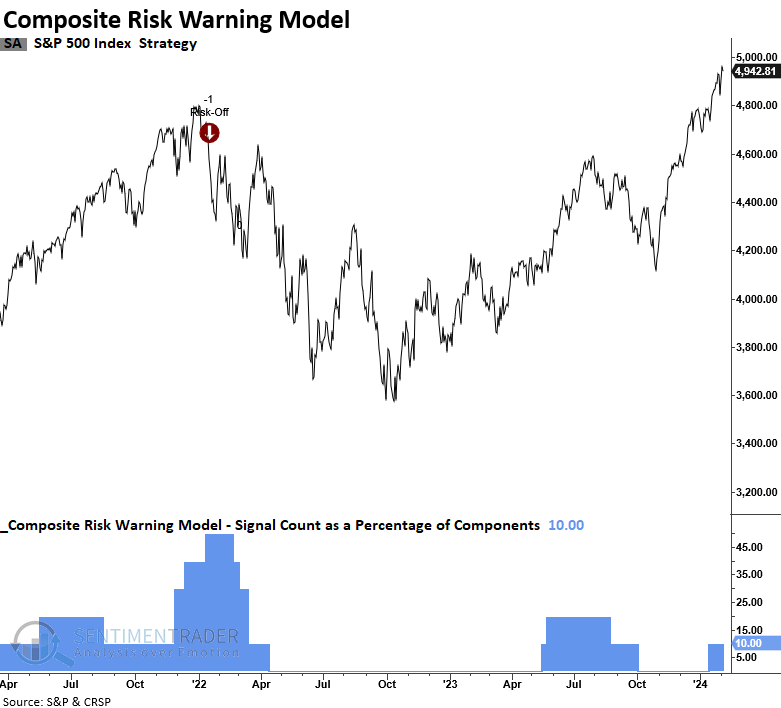
The TCTM Composite Risk Warning Model, designed to identify a potential bullish to bearish trend change for the S&P 500 before traditional trend-following indicators, currently reports a risk level of 10%, comfortably below the trigger point of 50%.
What the research tells us...
One of the more notable miscalculations investors have made since the market bottomed in the fall of 2022 was assuming it was appropriate to follow the traditional playbook following a recession-driven bear market. In actuality, we had a growth scare bear market. Both of these scenarios look similar in the blastoff phase. i.e., you have excellent participation with a significant number of breadth thrusts. However, in the growth scare scenario, former leadership reasserts itself as technology has over the last year, and participation dwindles as macro conditions create winners and losers among sectors and market capitalizations, as evidenced by small stocks.
While big-picture trends remain constructive, short-term breadth-based indicators show dwindling participation, a common feature of an aging business cycle impacted by high-interest rates. A member of the Risk-Off Composite Model issued a new warning. Similar alerts suggest the S&P 500 could struggle. Should additional components trigger a signal, investors would be prudent to reduce equity market exposure.