Data &
Technology
Research
Reports
Report Solutions
Reports Library
Actionable
Strategies
Free
Resources
Simple Backtest Calculator
Simple Seasonality Calculator
The Kelly Criterion Calculator
Sentiment Geo Map
Public Research Reports
Free Webinar
Pricing
Company
About
Meet Our Team
In the News
Testimonials
Client Success Stories
Contact
Log inLoginSign up
< BACK TO ALL REPORTS

A near record month for Value vs Growth

Jason Goepfert
2021-03-09
Value stocks returned more than +5% over the past month, while Growth stocks dropped by more than -5%. This kind of spread in performance has typically ended other prolonged periods of Value under-performance over a long time frame. The signals tended to be negative for the broader market, though.

Even though there is a reversal of the trend today, there has been a momentous shift in momentum over the past month. Former highflyers lost altitude while stocks that had been left behind stormed back.

We saw this in the extreme movements between Technology and Financials, and on Monday, Dean noted the incredible thrust in Energy.

All of these shifts have triggered a massive move in Value stocks relative to Growth. Over a rolling 1-month period, the total return on value is more than 10% greater than the total return on growth, one of the largest spreads in 30 years.

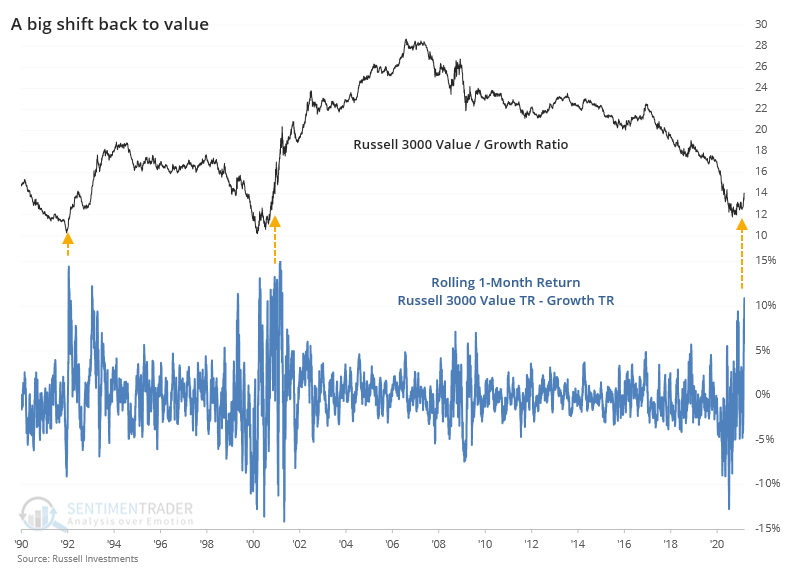
The last two shifts were notable, because they marked the ends of long periods of Value stock under-performance. In the years following those thrusts, Value stocks crushed Growth stocks.

It turns out that's more the rule than the exception.

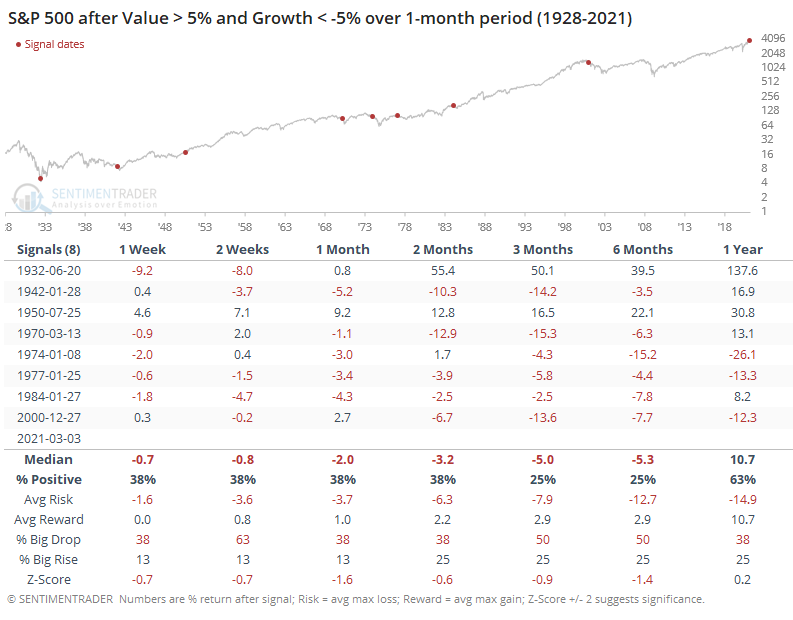
The table below shows every time since 1928 when the total return on Value stocks over a rolling 21-day period was more than +5%, while the total return on Growth stocks was less than -5%.

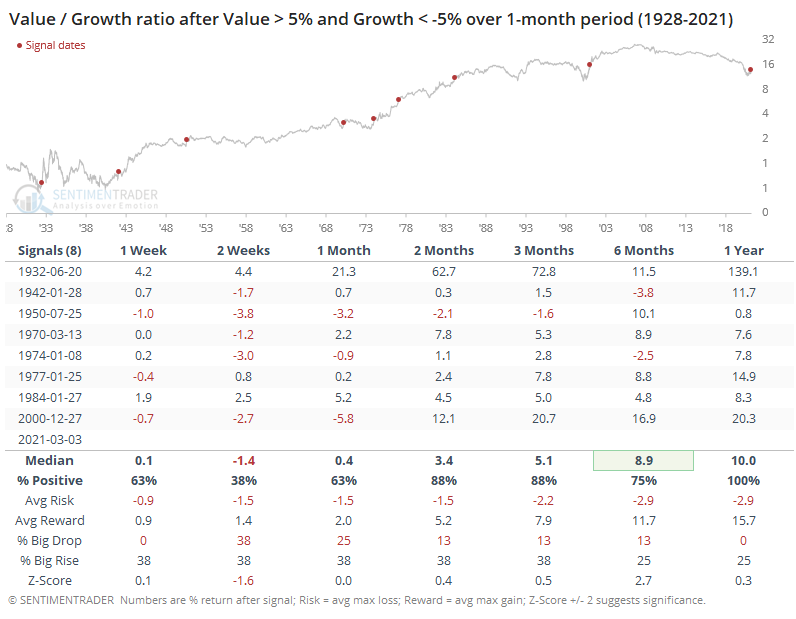
There was some back-and-forth in the shorter-term, and Value under-performed Growth over the next couple of weeks. Other than that, there was a clear and increasing bias toward Value. By a year later, Value had out-performed Growth every time. The returns were especially stark when emerging from multiple years of under-performance like now.

In terms of actual returns, they weren't all that impressive. The total return on Value was negative across most time frames.


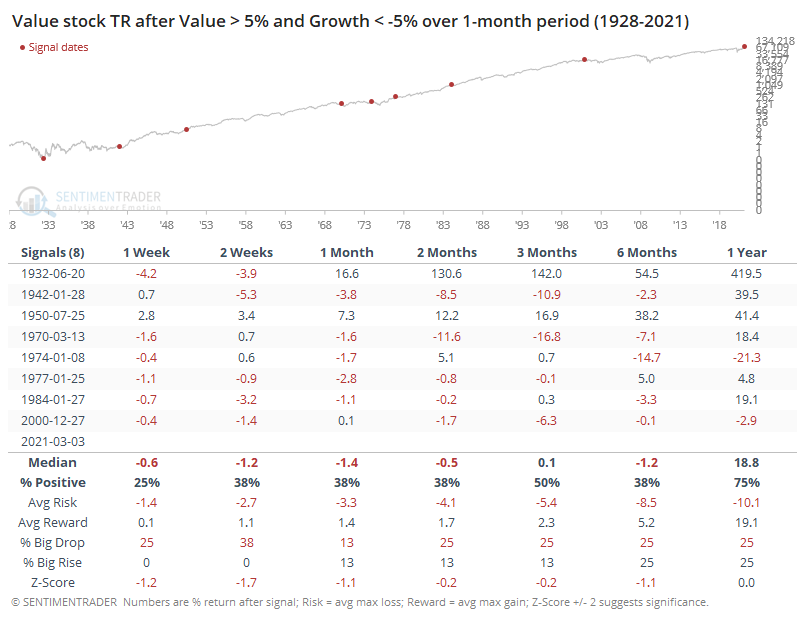
We know that Value tended to out-perform Growth, so this means that returns on Growth stocks must have been even worse. Indeed.

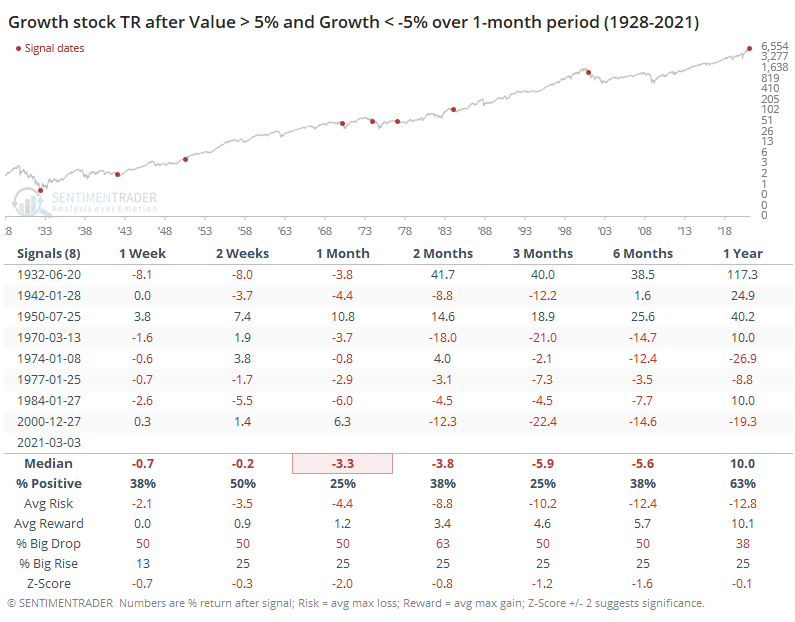
Because of the S&P 500's general bias toward Growth stocks, this means that the most widely benchmarked index in the world tended to perform pretty poorly after these signals.

There have been a lot of false starts for Value in recent years, every time beaten back by a resurgence in momentum stocks. Maybe the next round of stimulus payments, a decent portion of which seems destined for the stock market, will cause that to happen again. Historically, though, the surge in Value relative to Growth has been stark enough that it has ended other prolonged bouts of under-performance. And that's been a warning for the broader market.

Sorry, you don't have access to this report

Upgrade your subscription plan to get access
Go to Dasboard
DATA &
TECHnologies
IndicatorEdge
‍
BackTestEdge
‍
Other Tools
‍
DataEdge API
RESEARCH
reports
Research Solution
‍
Reports Library
‍
actionable
Strategies
Trading Strategies
‍
Smart Stock Scanner
‍
FREE
RESOUrCES
Simple Backtest
Calculator
Simple Seasonality
Calculator
The Kelly Criterion
Calculator
Sentiment Geo Map
‍
Public Research Reports
‍
Free Webinar
COMPANY
‍
About
‍
Meet our Team
‍
In the News
‍
Testimonials
‍
Client Success Stories
Pricing
Bundle pricing
‍
Announcements
‍
FAQ
© 2024 Sundial Capital Research Inc. All rights reserved.
Setsail Marketing
TermsPrivacyAffiliate Program
Risk Disclosure: Futures and forex trading contains substantial risk and is not for every investor. An investor could potentially lose all or more than the initial investment. Risk capital is money that can be lost without jeopardizing ones’ financial security or life style. Only risk capital should be used for trading and only those with sufficient risk capital should consider trading. Past performance is not necessarily indicative of future results.

Hypothetical Performance Disclosure: Hypothetical performance results have many inherent limitations, some of which are described below. No representation is being made that any account will or is likely to achieve profits or losses similar to those shown; in fact, there are frequently sharp differences between hypothetical performance results and the actual results subsequently achieved by any particular trading program. One of the limitations of hypothetical performance results is that they are generally prepared with the benefit of hindsight. In addition, hypothetical trading does not involve financial risk, and no hypothetical trading record can completely account for the impact of financial risk of actual trading. for example, the ability to withstand losses or to adhere to a particular trading program in spite of trading losses are material points which can also adversely affect actual trading results. There are numerous other factors related to the markets in general or to the implementation of any specific trading program which cannot be fully accounted for in the preparation of hypothetical performance results and all which can adversely affect trading results.

Testimonial Disclosure: Testimonials appearing on this website may not be representative of other clients or customers and is not a guarantee of future performance or success.