
A Crude Oil "Pause" Play Example

In this article, Dean highlighted a mechanical sell signal for the energy sector in general. What follows is an example of one way to play this type of signal.
NOTE: Sentimentrader does not offer investment advice. The following example should be considered as educational in nature and NOT as a specific "recommendation."
THE KEY FACTORS
In the screenshot below from Dean's article, we see that historically the signal in question has seen crude oil higher 2 weeks later, just 18% of the time. The median decline was -4.1%.
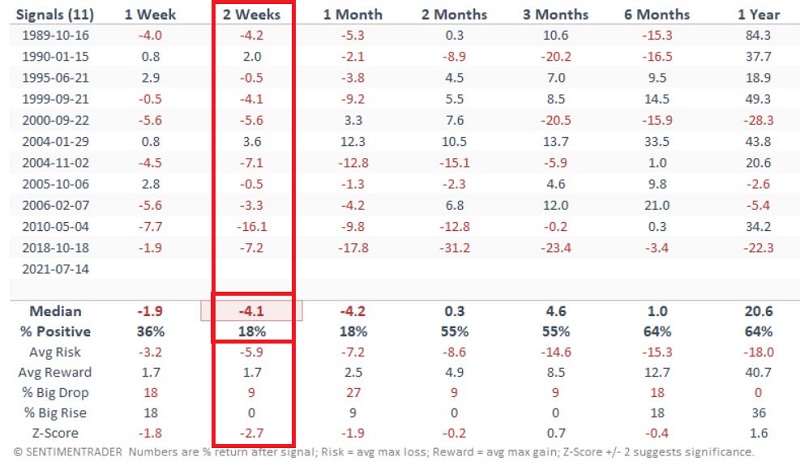
For this example, instead of "playing for a decline" in price, we will instead play for "no significant rally in price."
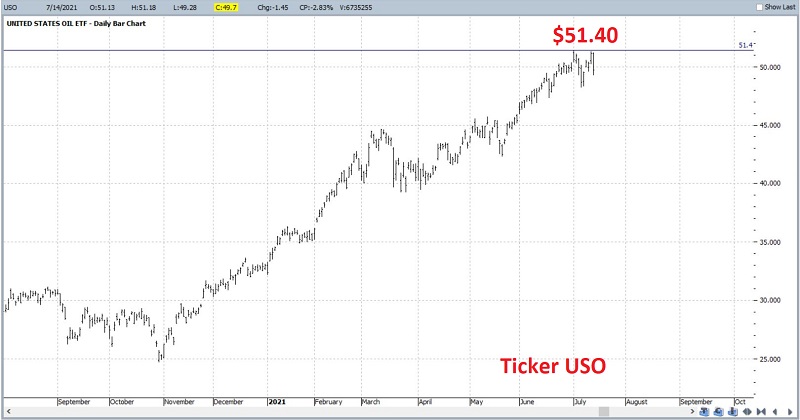
In the chart below (courtesy of ProfitSource), we can see that ticker USO (an ETF that tracks crude oil futures) recently hit a high of $51.40 a share. We will consider a trade that will profit as long as USO remains below this recent high.
EXAMPLE TRADE: BEAR CALL CREDIT SPREAD
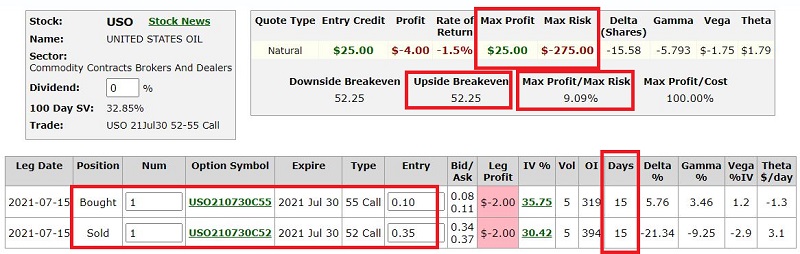
Our example trade involves a strategy referred to as a "Bear Call Credit Spread," or bear call spread for short. The trade involves:
- Selling the USO Jul30 52 call @ $0.35
- Buying the USO Jul30 55 call @ $0.10
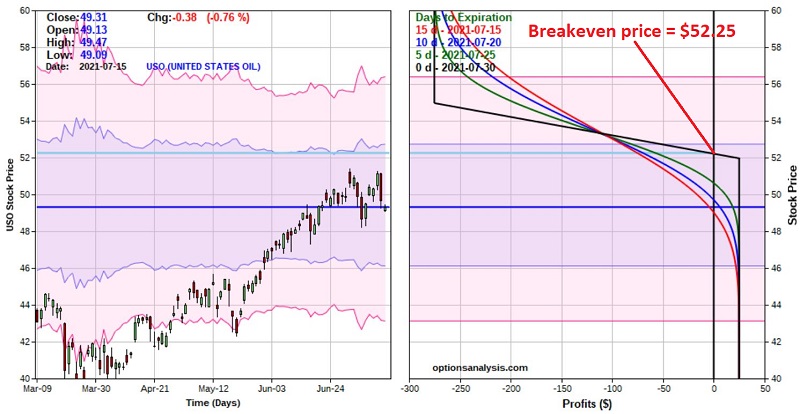
The particulars appear in the screenshot below and the risk curves in the chart below that. All figures below are courtesy of www.Optionsanalysis.com.
Things to note:
- The options expire in 15 days
- The maximum profit potential is 9.1% (if USO is below $52 a share at expiration)
- The breakeven price for this trade is $52.25 at expiration
- The maximum profit on a 1-lot is $25
- The maximum risk on a 1-lot is $275
The bottom line is that you would only consider this trade and/or strategy if you are highly confident that USO will not rally in price in the next 2 weeks. In this example, we use the signal mentioned above as the catalyst to enter the trade in the belief that USO will move sideways to lower over the next two weeks.
ACTUAL TRADING CONSIDERATIONS
This is where theory and reality separate. On the one hand, it sounds all well and good to say:
- I can earn 9.1% in 15 days
- My position will show a profit as long as the underlying security does ANYTHING EXCEPT rally roughly 6% in 2 weeks
- My trade has over a 90% mathematical probability of success
Yes, these types of thoughts are great - right up until the point that things go very wrong.
While making 9% in 2 weeks is good, the primary thing that a trader in this scenario MUST focus on is "What if USO goes up instead of sideways or down?" And the problem is there is no set, correct answer. So, let's focus on this from a risk management perspective.
THE PRIMARY CONSIDERATION: RISK MANAGEMENT
Because our max profit is $25 and our max risk is -$275, the first reality is that we MUST be prepared to act to cut a loss if USO rallies (i.e., sticking our head in the sand and "hoping" that USO does not rally too far is, er, a "poor" risk management technique).
Let's "zoom in" on our risk curves in the chart below.
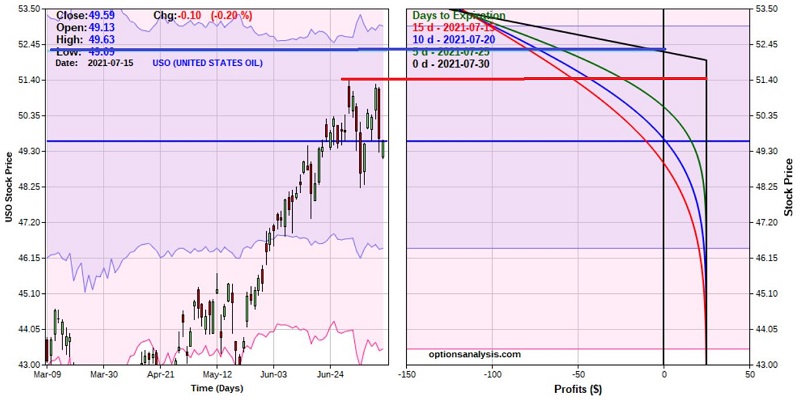
In terms of limiting risk, there are two basic choices:
1) Close the trade if USO breaks above the previous high of $51.40 (the red line in the chart above). Depending on how soon that price is hit, we could experience anything from a loss of -$59 (if that price jump happens immediately) to an actual profit if that price jump doesn't happen until expiration.
The upside to this approach is that we can keep our loss relatively small. The downside is that if we stop ourselves out between $51.40 and $52.25, we eliminate the possibility of still earning a profit if USO does NOT exceed the breakeven price of $52.25.
2) Close the trade if USO breaks above the breakeven price of $52.25 (the upper blue line in the chart above). Depending on how soon that price is hit, we could experience anything from a loss of -$81 (if that price jump happens immediately) to breakeven if that price jump doesn't happen until expiration.
The upside to this approach is that we give USO a lot of room to fluctuate before taking any defensive action. The downside is that our $ risk is greater than our profit potential, AND our dollar risk is greater than if we chose to stop ourselves out if the old high of $51.40 a share is exceeded.
SUMMARY
The realities are this:
- There is no guarantee that crude oil won't rally
- There is no guarantee that the example trade above would make money
- There IS a guarantee that the example trade above WOULD lose money if USO is above $52.25 at expiration AND the dollar amount of risk increases with each uptick in the price of USO above $52.25
- If you are short the 52-strike call at expiration and USO is above $52 a share, you will be assigned and be required to buy 100 shares of USO at 52
That said, a credit spread is a strategy commonly used by traders who are not sure where a security is going but are reasonably confident about where it isn't going.