Reverse Down Signal Concept and New Signal in Energy

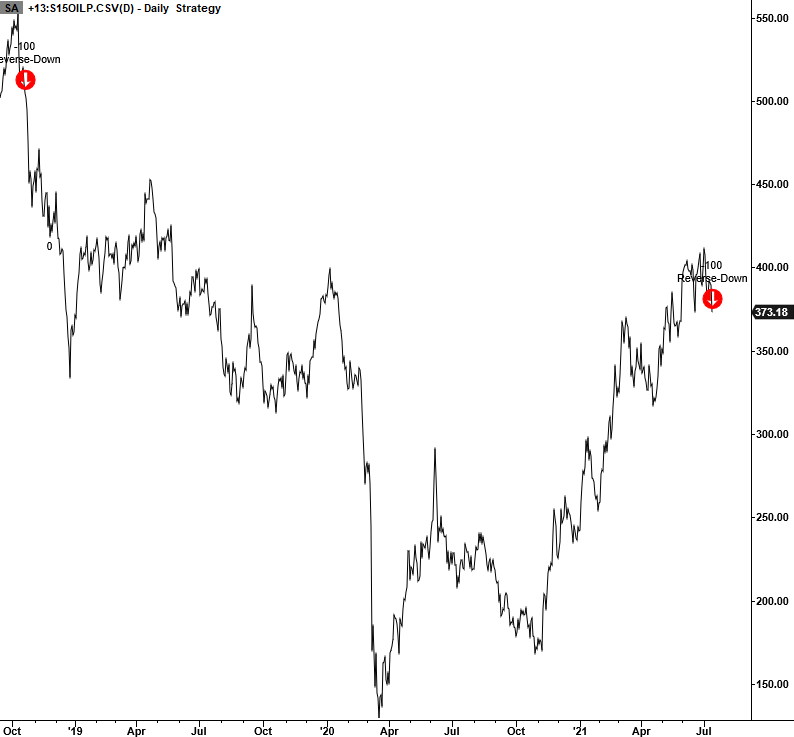
The S&P 1500 Oil & Gas Exploration & Production sub-industry group registered a 252-day high to 21-Day low reverse-down sell signal at the close of trading on 7/14/21.
Let's review the concept and the forward return outlook for the sub-industry group.
THE CONCEPT
The reverse-down signal identifies when a stock, index, or ETF registers a 252-day high and then reverses lower and registers a 21-day low in a user-defined number of days or less. The user-defined number of days is the most critical aspect of the signal. By limiting the number of days to a low level, the model identifies an acceleration in price momentum. The model will issue an alert based upon the following conditions.
SIGNAL CRITERIA
- Security XYZ closes at a 252-day High.
- If condition 1, then count the number of days since the high.
- If the number of days since the low < 10 and security XYZ closes at a 21-day low, sell long position or go short.
In a note on 7/8/21, I introduced the reverse-up signal concept. The only difference between the two algorithms is a modification to one of the parameters. In a bull market, I'm only interested in a reversal off of a 252-day high. If a stock, index, or ETF is in a bear market, I will change the 252-day high parameter to 21 days in an attempt to catch overbought reversals in a downtrend.
Let's take a look at the current chart and historical signal performance.
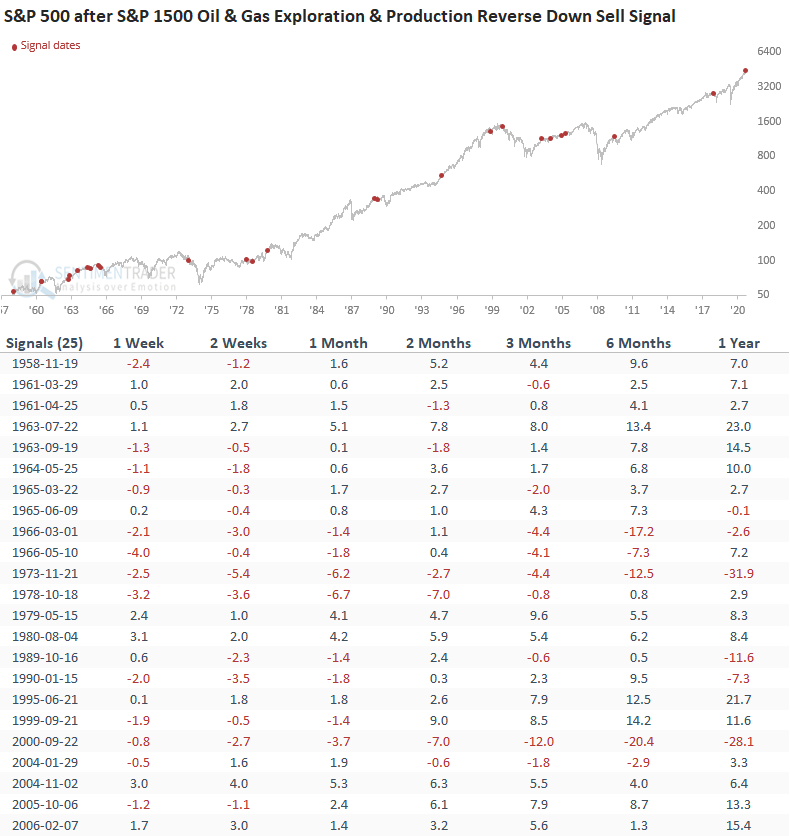
CURRENT CHART - S&P 1500 OIL & GAS EXPLORATION & PRODUCTION
I calculate performance statistics in the table as a short signal, whereas the annualized returns result from buying the sub-industry group. The data is based on an optimal days-in-trade holding period of 11 days.
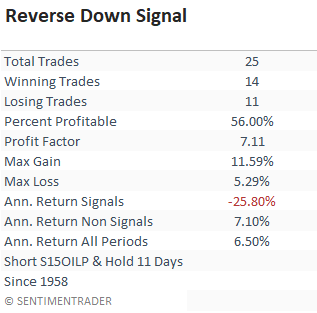
If you look at the short signals since 1989, the percent profitable goes to 73%, and the profit factor increases to 11.6.
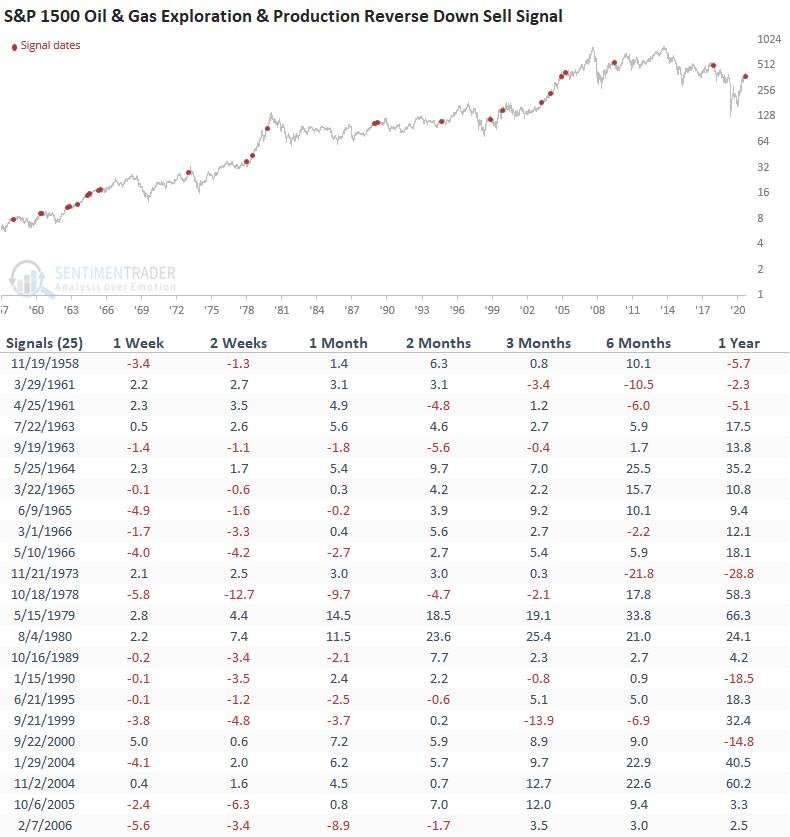
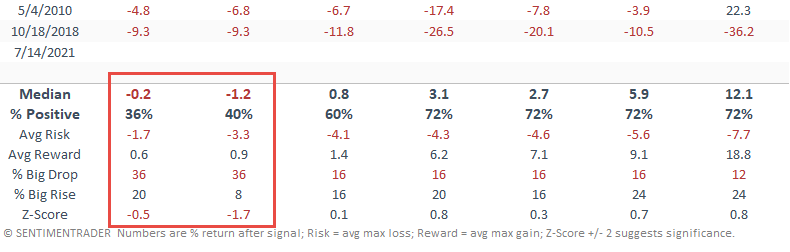
HOW THE SIGNALS PERFORMED - S15OILP
The returns look weak in the short term and suggest that one should be careful with regard to the timing of a long position.
Let's see what happens if we apply the reverse down signals to the S&P 500 Index.
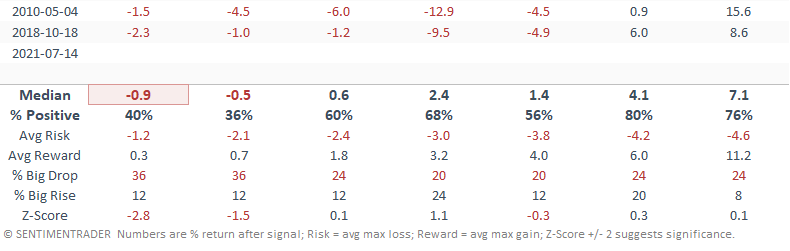
HOW THE SIGNALS PERFORMED - S&P 500
Interestingly, S&P 500 performance looks weak in the 1-2 week timeframe. In more recent times, the oil and gas industry has played a more significant role in the global economy, and for that reason, it's not a surprise to see a short-term impact on the S&P 500.
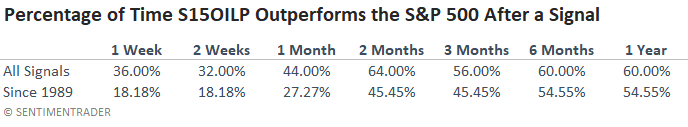
In case you were wondering how the signal performed relative to the S&P 500.
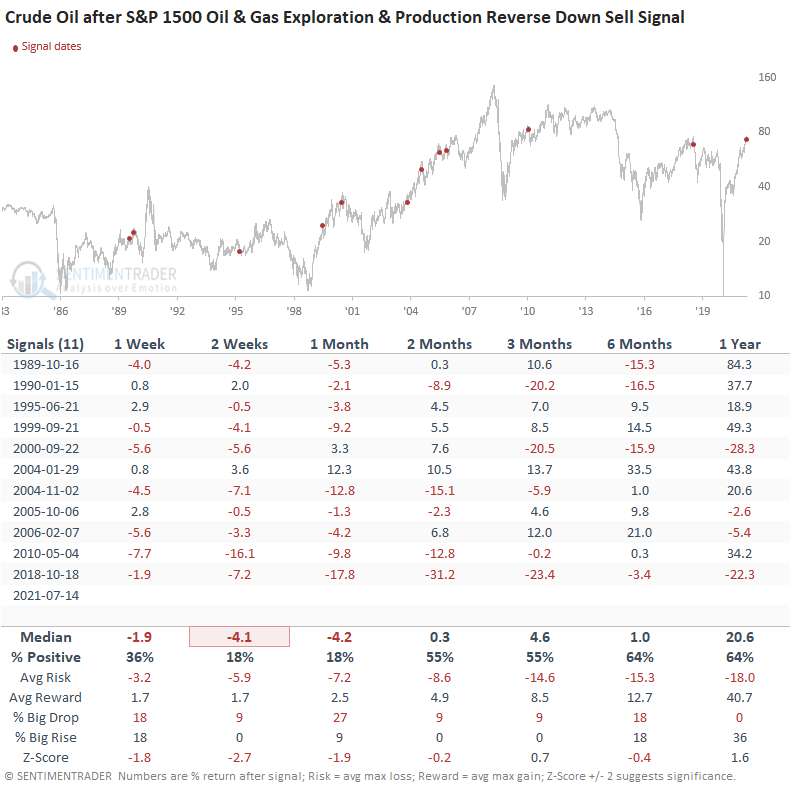
Let's take a look at what happens with crude oil when a reverse-down signal occurs for the oil & gas exploration & production sub-industry.
Our daily crude oil data starts in 1983 and hence why the number of signals is fewer.
HOW THE SIGNALS PERFORMED - CRUDE OIL
Crude oil looks weak in the 1-4 week timeframe.