
A Case for Commodities in the Years Ahead (Part II)

In Part I, I argued the following points:
- Stocks have significantly outperformed commodities on a buy-and-hold basis over the long-term
- However, there are massive swings back and forth and periods of time when commodities vastly outperform stocks
- Stocks presently appear to be overvalued on a long-term basis and may experience much weaker returns in years ahead
- Commodities are historically cheap relative to stocks
TAKING ADVANTAGE OF STOCK AND COMMODITY SWINGS
Given that:
- There are periods of times when the stock market performs poorly, AND
- Commodities often perform extremely well when stocks perform poorly
- We will attempt to build a simple model to tell us whether to favor stocks or commodities at any given point in time
For our test, we will use the following indexes from 10/31/1933 through 4/30/2021 using the monthly closing price for each:
- S&P 500 Index (SPX)
- Bloomberg Commodities Index (BCOM)
The indicator we will use to time switches from stocks to commodities and back uses the following variables and formula:
A = Growth of $1 in Bloomberg Commodities Index
B = Growth of $1 in S&P 500 Index
C = A / B
D = 15-month EMA of C
E = C - D
TRADING RULES
- If C>D then hold commodities during the next month
- If C<D then hold stocks during the next month
In a nutshell:
- We track the ratio of commodity performance divided by stock performance
- We apply a 15-month moving average
- If the current ratio is above the moving average, we will hold commodities
- If the current ratio is below the moving average, we will hold stocks
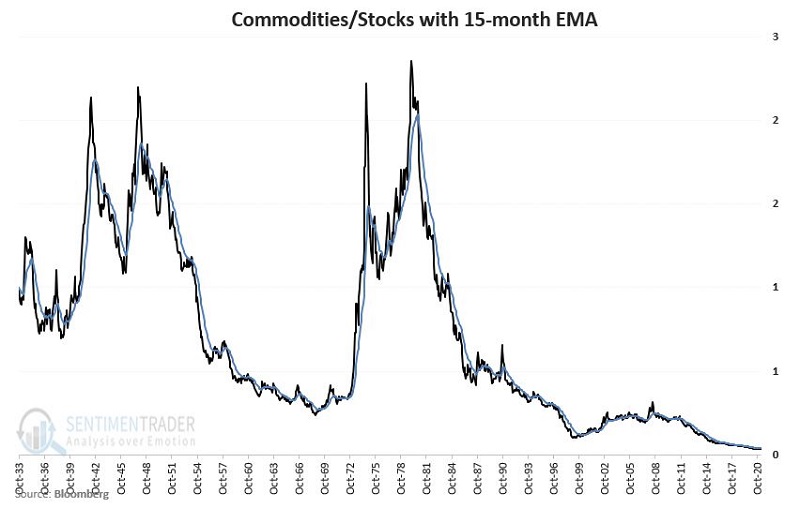
The chart below displays the Commodities/Stocks ratio (Variable C) along with its 15-month EMA (Variable D)
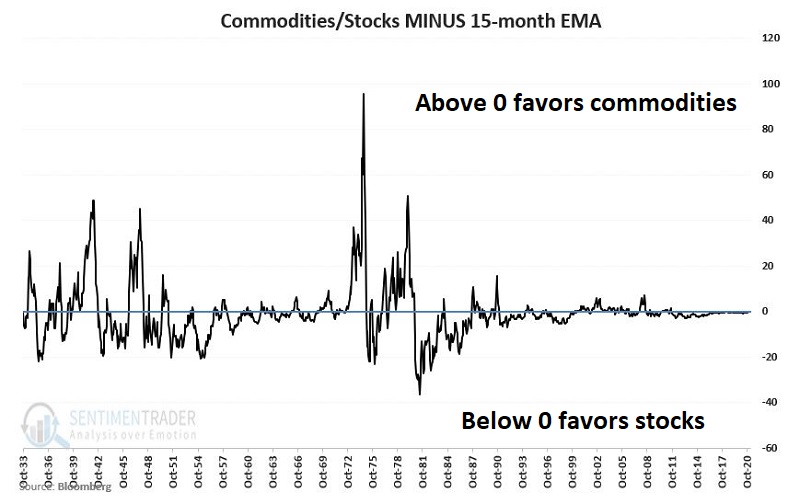
The chart below displays Variable E, the Commodities/Stocks ratio MINUS its 15-month EMA
To get a better sense of recent action, the chart below "zooms in" on the chart above and focuses solely on the last 15 years (May 2006-April 2021).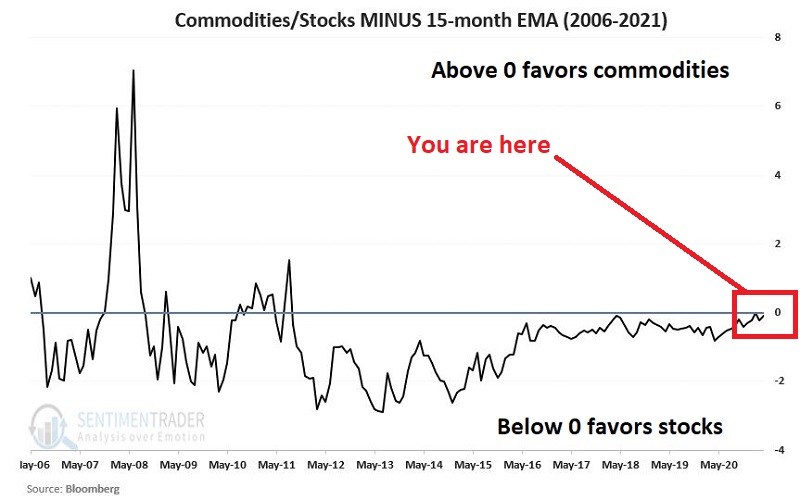
The key things to note:
- The value has been negative (i.e., favoring stocks) for almost 10 full years
- The gap has been narrowing of late and may soon exceed 0 once again (i.e., favor commodities)
The action of the markets in the last 10 years has led to a hardening of the "buy stocks, avoid commodities" mindset. However, the longer-term picture argues against adopting this rigid mindset.
RESULTS
So now let's test our simple strategy of:
- Holding commodities when Variable E is above 0
- Holding stock when Variable # is below 0
Things to note:
- We will compare this approach to splitting money 50/50 between commodities and stocks and rebalancing to a 50/50 split at the beginning of each new calendar year
- All results are hypothetical only and include price-only returns (not total return including dividends)
- The results DO NOT include any deductions for trading costs such as slippage and commissions
As a benchmark, $1,000 invested buy-and-hold:
- In commodities = $17,478
- In stocks = $466,648
- Split 50/50 between commodities and stocks and rebalanced at the start of each year = $177,615
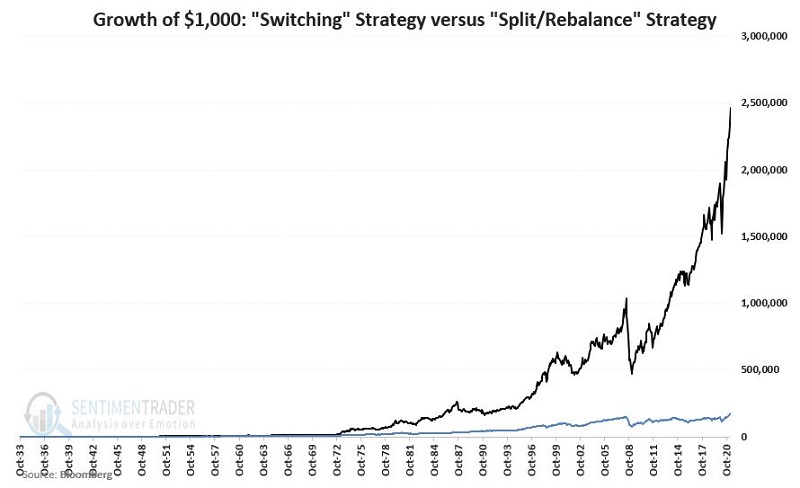
- By contrast, $1,000 invested using the switching system described above grew to a hypothetical value of $2,461,956
The chart below displays the hypothetical growth of the "switching" strategy versus the "50/50 split and rebalance" strategy.
The table below puts some facts and figures to the chart above (based solely on price data, NOT total return).
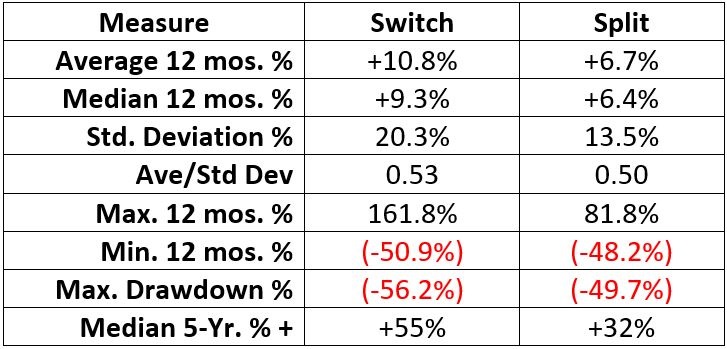
While the "Switch" strategy enjoyed significantly higher hypothetical gains over time, this higher return came with a significant absolute level of risk and volatility and a higher level of risk and volatility than that of the "Split" strategy. Notably:
- The average 12-month Standard Deviation for the "Switch" strategy was 20.3% versus 13.5% for "Split"
- The maximum % drawdown for the "Switch" strategy was a substantial -56.2% versus -49.7% for the "Split" strategy
PLAYING THE STRATEGY
The strategy detailed above is presented for informational purposes only and not as a "recommendation." Given the volatility and significant drawdowns highlighted in the hypothetical backtest, an investor should carefully consider whether this type of strategy fits their own personality.
That said, to complete the example, one simple approach for an investor considering this type of strategy would be to:
- Buy ticker GCC (WisdomTree Continuous Commodity Index Fund ) when the strategy favors commodities
- Buy ticker SPY (SPDR S&P 500 ETF Trust ) when the strategy favors stocks
Ticker GCC is an ETF designed to track The Continuous Commodity Total Return Index, a broad-based commodity index that reflects the price movement of 17 exchange-traded futures contracts and serves as a proxy for commodities as an asset class.
Ticker SPY holds the 500 components that comprise the S&P 500 Index and serves as a proxy for stocks as an asset class.
An investor can gain exposure to either stocks or commodities as an asset class by trading ETFs by buying one broadly diversified portfolio.