
A Case for Commodities in the Years Ahead (Part I)

S&P 500 INDEX VS. BLOOMBERG COMMODITY INDEX
Let's first consider the relative performance of stocks versus commodities. For this, we will use the following data:
- For stocks, we will use the change in the monthly closing price for the S&P 500 Index (SPX)
- For commodities, we will use the Bloomberg Commodity Index (BCOM)
- Our test period will extend from October 31, 1933, through April 30, 2021 (80 and a half years)
Most investors are familiar with the S&P 500 Index, which tracks a basket of 500 large companies on a capitalization-weighted basis. Generally speaking, the S&P 500 Index is the most commonly used benchmark when assessing the performance of stocks as an asset class.
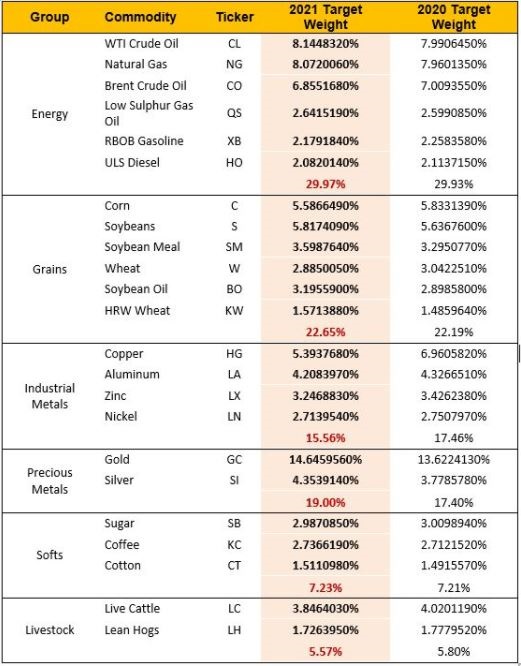
The Bloomberg Commodity Index is designed to track a basket of physical commodities to track the performance of commodities as an asset class. The components and weightings are determined by Bloomberg and can and will change slightly from year to year. The components and target weightings for 2021 appear in the graphic below.
COMPARING STOCK AND COMMODITIES PERFORMANCE
The first thing we will do is consider the cumulative growth of $1 invested in each index listed above. What we find is displayed in the table below.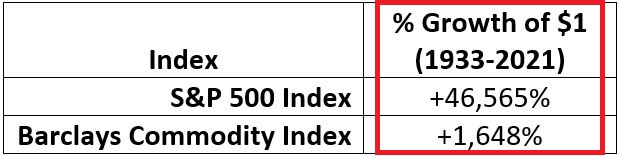
The chart below displays the growth of $1 invested in stocks divided by the growth of $1 invested in commodities on a buy-and-hold basis since 1933. 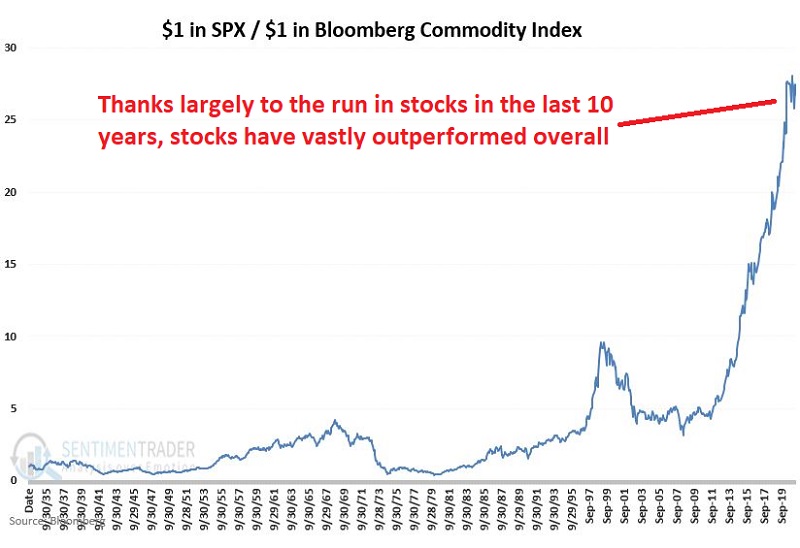
On the face of it, it's no contest - stocks win handily.
The majority of investors will look at the information above and conclude that the proper message is "Buy stocks, avoid commodities"?
But history suggests that this is likely not the proper lesson.
TAKING A CLOSER LOOK AT HISTORY
If we draw the same chart only through 2010, we can more easily pick out some significant back-and-forth swings and some instances where commodities significantly outperformed stocks.
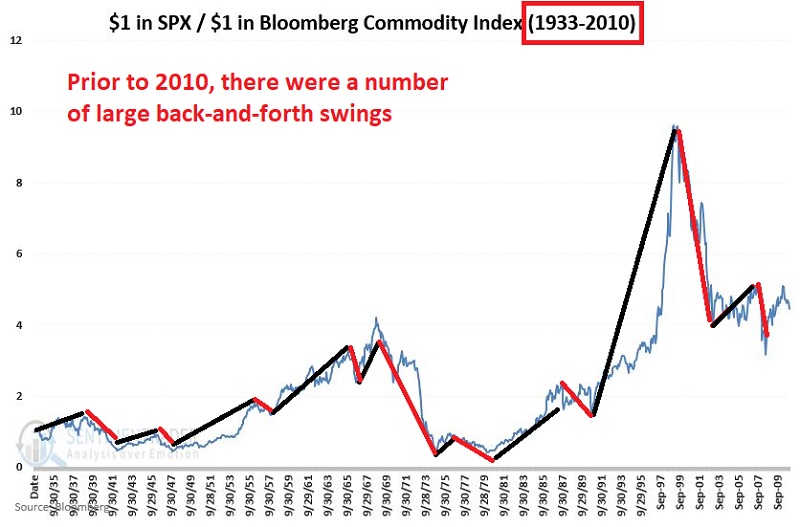
In fact, there is a significant and fairly regular back-and-forth to the swings favoring stocks over commodities and then back the other way that gets masked by the massive landslide favoring stocks since the low for stocks in 2009.
Using the benefit of hindsight, the table below displays the relative performance for stocks and commodities during upswings in the stocks/commodities ratio and during downswings in the stocks/commodities ratio. The differences are stark.
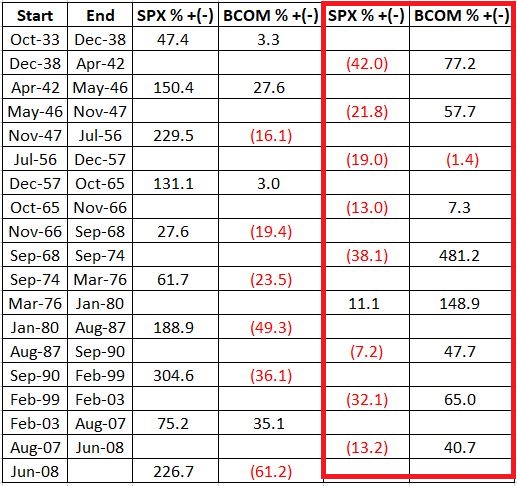
If we focus on the two right-hand columns in the table above, what we find is many instances where:
- Stocks performed very poorly, including some significantly severe multi-year declines
- While at the same time, commodities not only performed far better than stocks but also garnered significant profits
Two things should be clear from the data in the table above:
- There IS a time to be out of stocks
- During those times, commodities appear to offer strong potential for substantial gains
WHERE WE ARE NOW
The chart below is the same as the first chart from above. Note that stocks have vastly outperformed in the past 13 years.

The question is, "will this trend continue or will it reverse?"
Given the back-and-forth results depicted in the table above, it seems that investors would be wise to look for a reversal back in favor of commodities. In fact, it is possible it already has.
First off, note that stocks are historically overvalued, and some would argue that this may constrain stock profitability in the years directly ahead. The chart below displays the Shiller PE ratio. Note that the only two higher readings were:
- 1929 - the Dow declined -89% in 3 years after the peak
- 2000 - the Nasdaq 100 declined -83% in 2 years after the peak
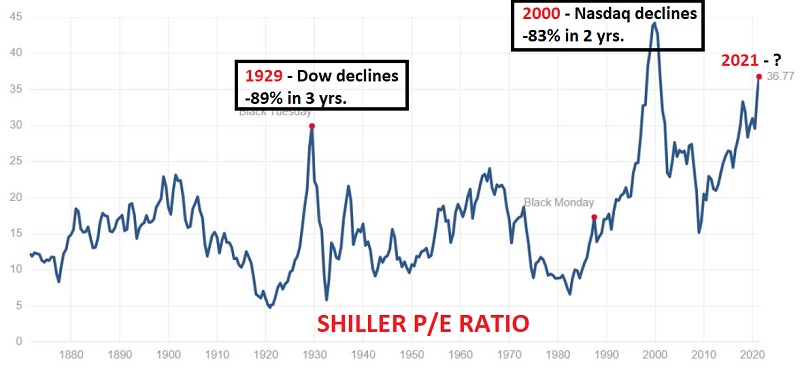
What will follow the ultimate peak in the P/E ratio this time around? It is impossible to say with any certainty. But clearly, history issues a significant warning.
Lastly, to get a sense of how undervalued commodities may be at the moment, let's flip the stock/commodity ratio on its head and divide the growth of $1,000 for commodities by the growth of $1,000 in SPX since 1933. The results appear in the chart below.
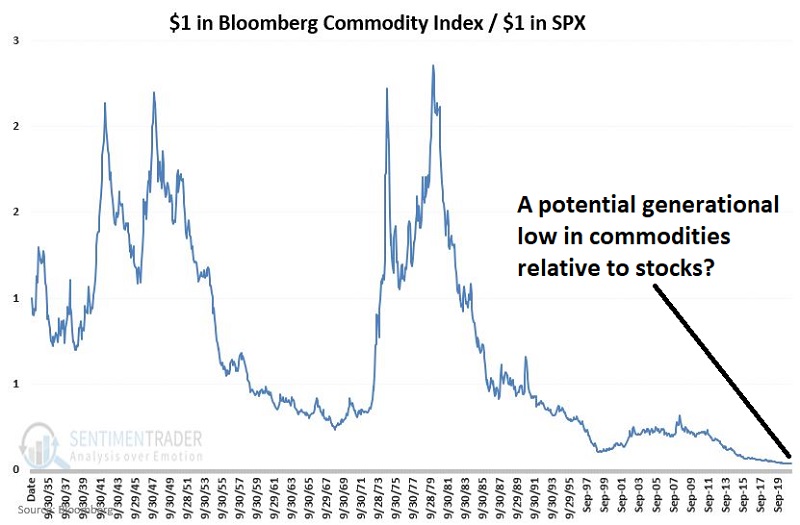
The chart above suggests the possibility of a generational low - and buying opportunity - for commodities as an asset class.
Stay tuned for Part II.