200 Reasons Why The Hindenburg Omen Matters
Warning signs
For the first time since October 2018, there are hints of trouble brewing beneath the market. While major indexes have been at or near all-time highs, under the surface there are more and more stocks losing momentum, and there has been a split with many securities at 52-week highs AND lows.
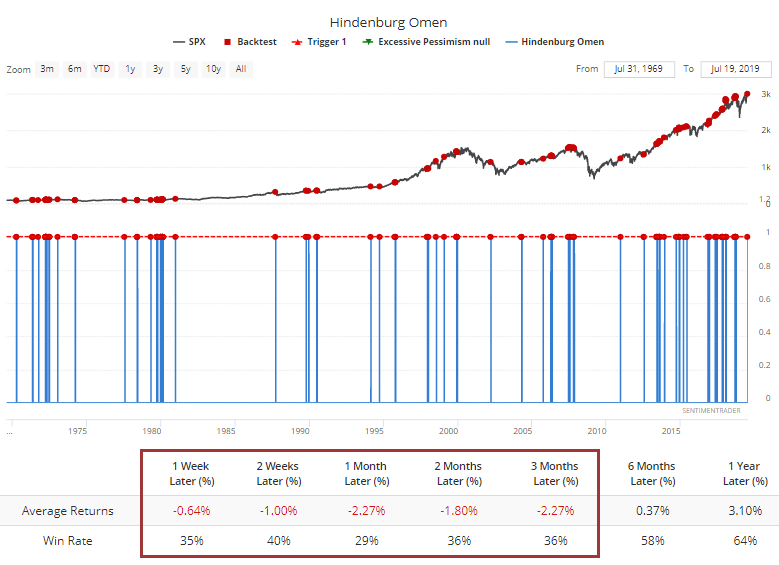
That has triggered the much-derided Hindenburg Omen, at least using the criteria we've always used (others might use slightly different criteria or data sources). According to our Backtest Engine, it has triggered on 200 days since 1965, and forward returns in the S&P 500 after even only a single signal have been terrible.

It also triggered on the Nasdaq exchange. When we see these kinds of conditions, with coincident signals on both exchanges for the first time in months, it has been exceptionally hard for the indexes to keep rising.
The Hindenburg Omen was a proposed technical analysis pattern, named after the Hindenburg disaster of May 6, 1937. It was promoted by Jim Miekka, who gave up on the theory that it portended a stock market crash in 2010.
The Omen compares the percentage of new 52-week highs and lows to a predetermined reference percentage to predict the increasing likelihood of a market crash, as well as deteriorating momentum in underlying breadth while major indexes continue to rally. The silly name is nothing but a marketing ploy and it causes “serious” investors to ignore it. This is the Horn Effect bias, and it's good for the rest of us, because most of the time they are effective.
It was most certainly *not* a help in 2017, which caused those who marginally followed the indicator to abandon it. Everything fails from time to time.
Then in 2018, according to CNBC, “the signal may be wrong this time because it’s getting skewed by international stocks, which are more prevalent today.” Skeptics have always brought up small cap stocks, bond funds, and international stocks as reasons to ignore the latest signal, yet these have always been apart of the Hindenburg Omen.
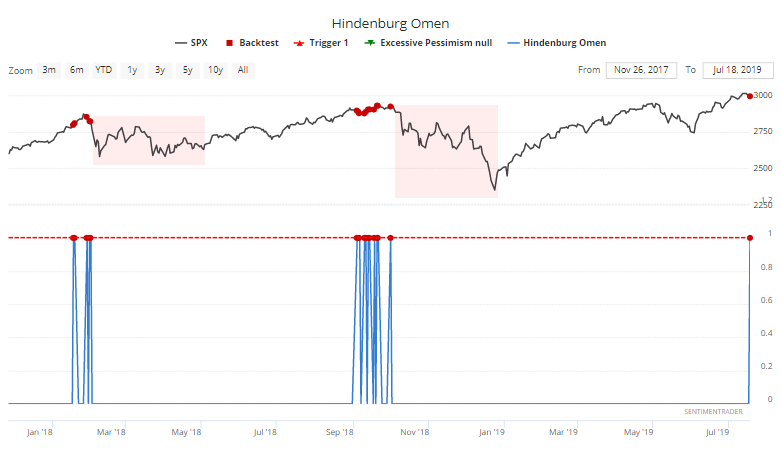
Right on cue, the last two clusters of signals were tremendously helpful.

Jim Miekka has provided a significant indicator of market danger. An indicator developed from a logical point of view - and has been tested in real-time for decades - is usually one that will serve you well. This one does just that.
For more on this indicator, clear here to read our Ultimate Guide for the Hindenburg Omen - everything you need to know.
Gold’s good month
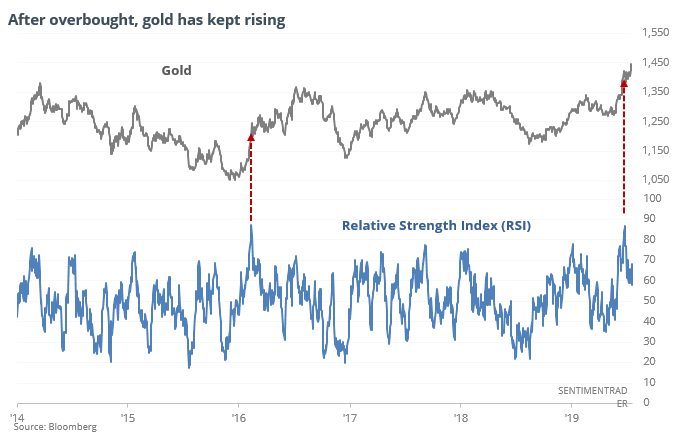
There have been some negative signs for gold over the past month, yet it has continued to power higher. Since its Relative Strength Index first hit a severe overbought level 30 days ago, it has tacked on another 8%.

Other times when buyers persisted in the face of overbought readings led to medium-term declines, but decent returns long-term.
The latest Commitments of Traders report was released, covering positions through Tuesday
The 3-Year Min/Max Screen shows that “smart money” hedgers established another multi-year extreme in long exposure to cotton, and also Russell 2000 futures, though the latter has been a very inconsistent indicator. The Backtest Engine shows when they held more than 30,000 contracts net long in cotton, it rallied over the next month 76% of the time, averaging 5.2%.
This post was an abridged version of our previous day's Daily Report. For full access, sign up for a 30-day free trial now.

