

Key points:
"We believe this combination of severe price compression, completely exhausted market breadth, and extreme pessimism is not a cause for panic, but rather a classic contrarian trading opportunity."
- SentimenTrader‘s research, as cited by Barron's (March 25, 2026)
In its March 25, 2026 coverage of the gold market selloff, Barron's drew on SentimenTrader research to argue that what looked like a crisis may in fact be a setup for a contrarian rebound.
Gold had fallen 13% in a single month, its worst performance since October 2008. The SPDR Gold Shares ETF (GLD) dropped 14.6% month-to-date, and the VanEck Gold Miners ETF (GDX) shed 25%. The selloff was driven by escalating geopolitical events and concerns that prolonged conflict would push inflation and interest rates higher, creating headwinds for non-yielding assets like gold.
But SentimenTrader's quantitative research told a different story.
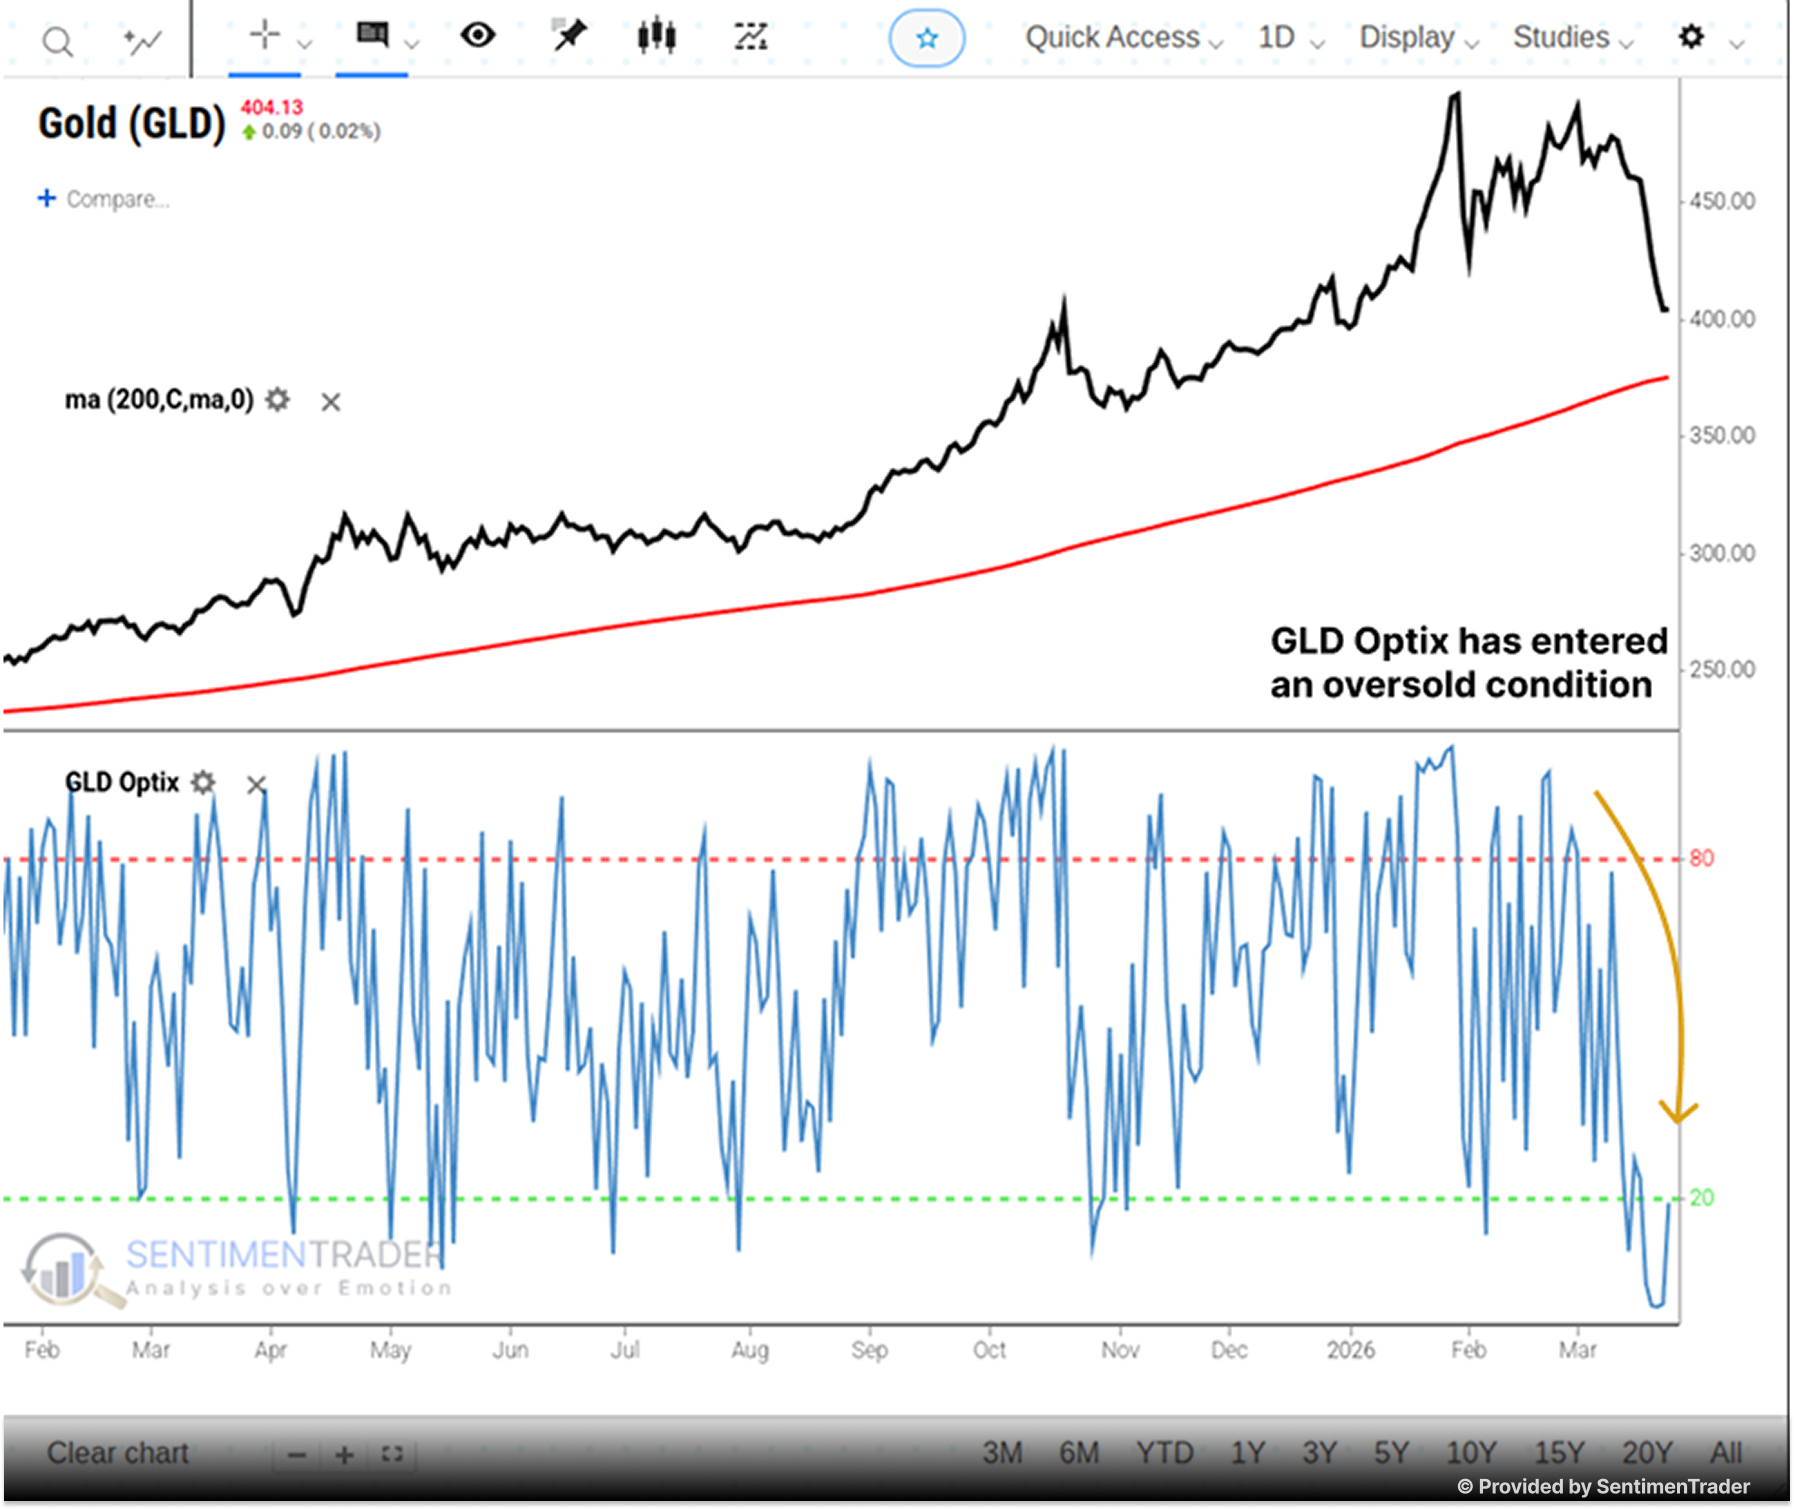
What the GLD Optix Showed
SentimenTrader's GLD Optix is a proprietary composite sentiment indicator that incorporates four data points: trading activity in put versus call options, future volatility expectations, the average discount of the fund to its NAV, and price behavior. Each measure is ranked against historical norms to determine whether current conditions are at an extreme, with the Optix ranging from 0 (maximum pessimism) to 100 (maximum optimism).
At the time of Barron's coverage, the GLD Optix had dropped to 19.11, well into oversold territory. Applying a 10-day moving average to smooth out daily fluctuations, SentimenTrader identified a signal when the average fell below 20, indicating that 80% of traders had been persistently bearish for a two-week period. The most recent signal triggered on March 24, 2026.
Across all prior instances of this signal since 2006, GLD posted positive returns 89% of the time over the following 12 months, with a median return of 10.1% and average maximum gains of 18.7%. The average maximum drawdown during those same windows was just 6.3%, giving the setup a roughly four-to-one reward-to-risk ratio.
The Case for Gold Miners
SentimenTrader also tracked the internal breadth of the gold mining sector using its GDX % In Bear Market indicator. Just one month before Barron's coverage, fewer than 10% of GDX constituents were in bear market territory. By the time the article was published, that figure had surged to 95%.
Historically, when GDX breadth spikes from under 10% to 95% or more in a matter of weeks, it has acted as a clearing event rather than a continuation signal. Prior instances showed 100% positive returns over the subsequent two to six months, with mean gains ranging from 25% to 35%.
With GLD's 200-day moving average remaining intact throughout the selloff, SentimenTrader concluded that the long-term uptrend was still in place and that weak-handed investors had been shaken out, creating an asymmetric entry point for investors with a 3 to 12 month time horizon.
Explore the Data
→Explore the Gold Optix Indicator on SentimenTrader → Read the full Barron's article