Data &
Technology
Research
Reports
Report Solutions
Reports Library
Actionable
Strategies
Free
Resources
Simple Backtest Calculator
Simple Seasonality Calculator
The Kelly Criterion Calculator
Sentiment Geo Map
Public Research Reports
Free Webinar
Pricing
Company
About
Meet Our Team
In the News
Testimonials
Client Success Stories
Contact
Log inLoginSign up
< BACK TO ALL REPORTS

Yet Another Gap As Opening Fervor Continues

Jason Goepfert
2016-02-18
null

Stocks are on track for yet another gap up opening today, marking the fourth consecutive positive open.

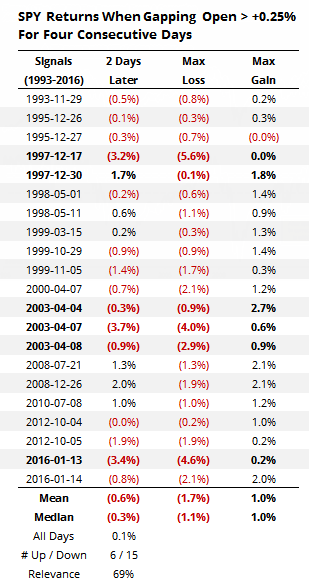
Since the inception of index futures in 1982, the S&P has never gapped up at least +1% for three consecutive sessions then gapped up at least 0.25% on the fourth. It happened after three gaps of at least +0.5% six times and at least +0.25% twenty-one times, shown below. The gaps that were at least +0.5% for the first three days are shown in bold.

20160218_gap

The most consistent performance in the S&P was over the next two days, when weakness prevailed (returns are from the open of the 4th day to the close two days later). The risk-to-reward ratio was about even, suggesting that the downside edge was not great, but in terms of new buys - traders rushing in to chase the short-term gains - it was a poor bet way more often than not.

Of the six times that the gaps were at least +0.5% during the first three days, the next two sessions lost ground all but one time, though it's harder to draw a conclusion there because of the small sample and clustered dates.

This is just more confirmation of what we looked at yesterday, that short-term blasts like this give back some of the gains over the next several sessions an overwhelming amount of the time.

The exceptions are typically times when we're emerging from medium-term pessimism and about to embark on multi-week to multi-month rallies. As always, we'll be considering that here as well, meaning that we're looking for short-term weakness and if we don't get it then it adds to the probability that we'll see even higher prices in the coming weeks.

DISCLOSURE

With my personal portfolio that I show on the site for transparency purposes, my typical time frame is medium- to long-term so I tend to avoid very short-term adjustments. While reducing exposure to stocks here seems a little "cute", the fact is that we're seeing excessive (short-term) optimism in a downtrending market, so I prefer to reduce exposure in those cases. The risk, and it's substantial, is that this is one of the exceptions, buyers continue to plow in, and I'm left with less exposure than desired longer-term, leaving me to chase prices higher. So no major adjustments here, I'll just be looking to reduce exposure from ~46% to ~40%.

Sorry, you don't have access to this report

Upgrade your subscription plan to get access
Go to Dasboard
DATA &
TECHnologies
IndicatorEdge
‍
BackTestEdge
‍
Other Tools
‍
DataEdge API
RESEARCH
reports
Research Solution
‍
Reports Library
‍
actionable
Strategies
Trading Strategies
‍
Smart Stock Scanner
‍
FREE
RESOUrCES
Simple Backtest
Calculator
Simple Seasonality
Calculator
The Kelly Criterion
Calculator
Sentiment Geo Map
‍
Public Research Reports
‍
Free Webinar
COMPANY
‍
About
‍
Meet our Team
‍
In the News
‍
Testimonials
‍
Client Success Stories
Pricing
Bundle pricing
‍
Announcements
‍
FAQ
© 2024 Sundial Capital Research Inc. All rights reserved.
Setsail Marketing
TermsPrivacyAffiliate Program
Risk Disclosure: Futures and forex trading contains substantial risk and is not for every investor. An investor could potentially lose all or more than the initial investment. Risk capital is money that can be lost without jeopardizing ones’ financial security or life style. Only risk capital should be used for trading and only those with sufficient risk capital should consider trading. Past performance is not necessarily indicative of future results.

Hypothetical Performance Disclosure: Hypothetical performance results have many inherent limitations, some of which are described below. No representation is being made that any account will or is likely to achieve profits or losses similar to those shown; in fact, there are frequently sharp differences between hypothetical performance results and the actual results subsequently achieved by any particular trading program. One of the limitations of hypothetical performance results is that they are generally prepared with the benefit of hindsight. In addition, hypothetical trading does not involve financial risk, and no hypothetical trading record can completely account for the impact of financial risk of actual trading. for example, the ability to withstand losses or to adhere to a particular trading program in spite of trading losses are material points which can also adversely affect actual trading results. There are numerous other factors related to the markets in general or to the implementation of any specific trading program which cannot be fully accounted for in the preparation of hypothetical performance results and all which can adversely affect trading results.

Testimonial Disclosure: Testimonials appearing on this website may not be representative of other clients or customers and is not a guarantee of future performance or success.