Data &
Technology
Research
Reports
Report Solutions
Reports Library
Actionable
Strategies
Free
Resources
Simple Backtest Calculator
Simple Seasonality Calculator
The Kelly Criterion Calculator
Sentiment Geo Map
Public Research Reports
Free Webinar
Pricing
Company
About
Meet Our Team
In the News
Testimonials
Client Success Stories
Contact
Log inLoginSign up
< BACK TO ALL REPORTS

Yet Another Breadth Thrust to Frustrate Shorts

Jason Goepfert
2021-08-26
For the first time in 30 years, stocks saw a multi-day breadth thrust with indexes already sitting at new highs.

Just leave it to this market. Unbelievable.

Seemingly whenever something negative triggers, buyers show up immediately. We saw on Monday that the S&P 500's approach to its former high was accompanied by a negative McClellan Summation Index and more 52-week lows than highs on the NYSE.

No matter, stocks continued to rise, and breadth turned around. The switch was dramatic enough that more than 75% of volume on the NYSE flowed into advancing securities. It happened on Monday, too. And Friday.

NYSE up volume

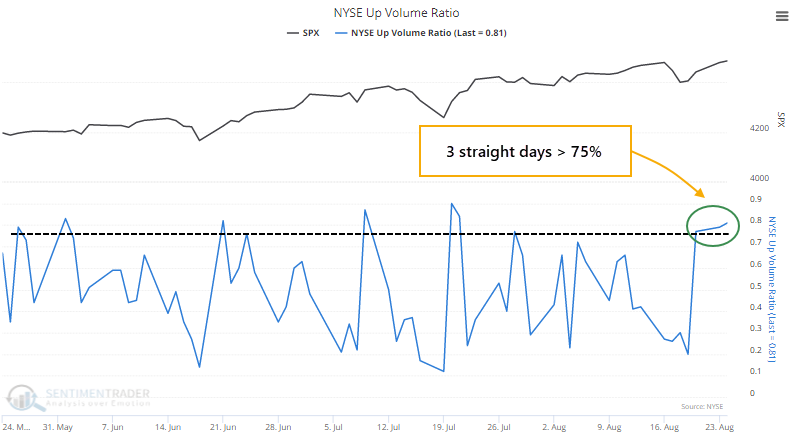
Over the past three years, this is only the 3rd distinct time that the 3-day average of NYSE Up Volume has neared 80% (lumping together the handful of post-pandemic thrusts as one).

Since 1928, there have been 86 non-overlapping periods with 3 consecutive days of 75% or greater Up Volume. Like we've seen so often, the primary highlight of thrusts like this is a remarkably positive risk versus reward ratio over the medium- to long-term.

Across all time frames, the S&P 500's average return was well above random, the average drawdown (risk) was a small fraction of drawup (reward), and there was a much higher probability of a big rise than a big drop.


What else we're looking at

  • Full details of forward returns after a 3-day breadth thrust, including when at new highs
  • What it means when microcap stocks show relative weakness
  • Gold hasn't made a new high in over a year - what that means for gold and miners

Stat box

The 4-week rate of change in corporate insiders buying shares of their own stocks in the Basic Materials sector has reached 161%, the highest velocity in more than 5 years.

Etcetera

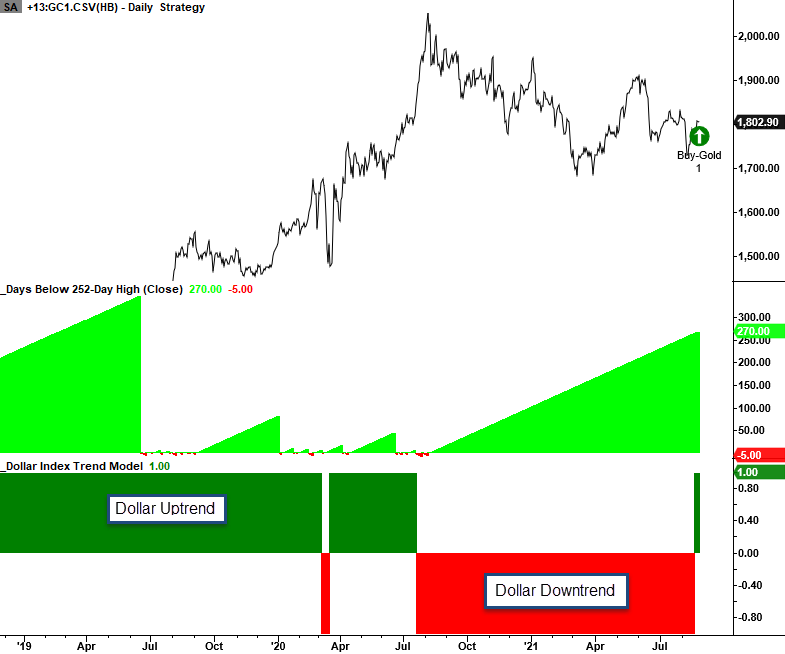
A year of frustration. Gold hasn't made a new high in over a year. This can be especially troubling when the dollar has broken out to the upside after a long consolidation. 

gold no new high

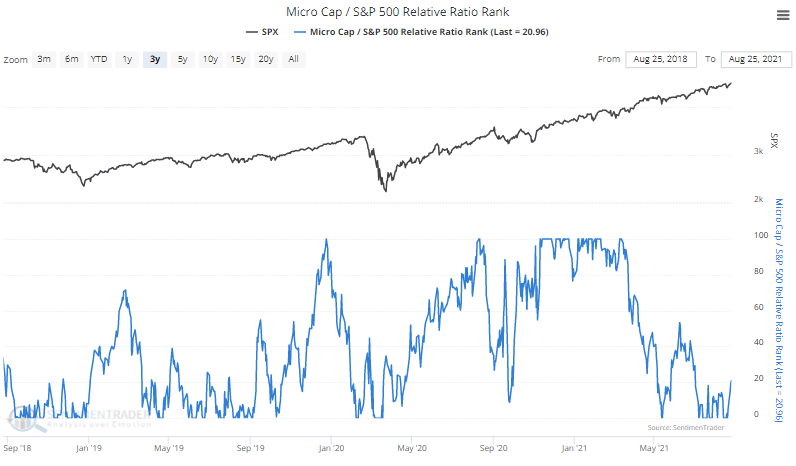
Micro underperformance. The relative performance of micro-cap stocks, some of the smallest in the public markets, is trying to perk up after a couple months. This is a sign of returning risk appetite among investors.

micro cap stock relative performance

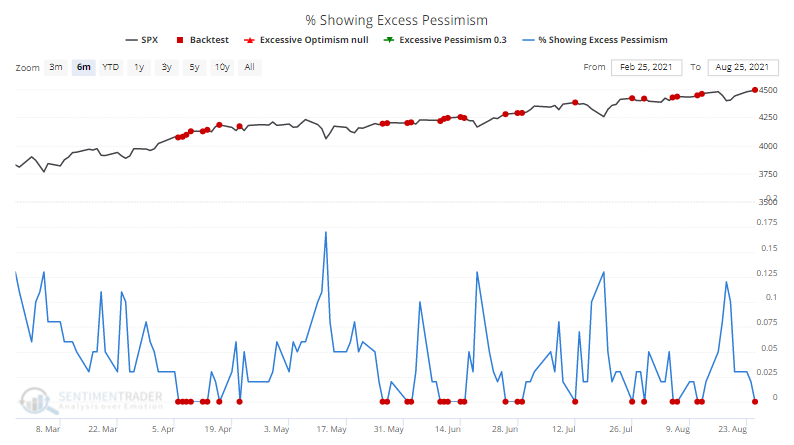
No pessimism. For the 29th time this year, not a single one of our core indicators is showing excessive pessimism.

sentiment indicators showing pessimism

DATA &
TECHnologies
IndicatorEdge
‍
BackTestEdge
‍
Other Tools
‍
DataEdge API
RESEARCH
reports
Research Solution
‍
Reports Library
‍
actionable
Strategies
Trading Strategies
‍
Smart Stock Scanner
‍
FREE
RESOUrCES
Simple Backtest
Calculator
Simple Seasonality
Calculator
The Kelly Criterion
Calculator
Sentiment Geo Map
‍
Public Research Reports
‍
Free Webinar
COMPANY
‍
About
‍
Meet our Team
‍
In the News
‍
Testimonials
‍
Client Success Stories
Pricing
Bundle pricing
‍
Announcements
‍
FAQ
© 2024 Sundial Capital Research Inc. All rights reserved.
Setsail Marketing
TermsPrivacyAffiliate Program
Risk Disclosure: Futures and forex trading contains substantial risk and is not for every investor. An investor could potentially lose all or more than the initial investment. Risk capital is money that can be lost without jeopardizing ones’ financial security or life style. Only risk capital should be used for trading and only those with sufficient risk capital should consider trading. Past performance is not necessarily indicative of future results.

Hypothetical Performance Disclosure: Hypothetical performance results have many inherent limitations, some of which are described below. No representation is being made that any account will or is likely to achieve profits or losses similar to those shown; in fact, there are frequently sharp differences between hypothetical performance results and the actual results subsequently achieved by any particular trading program. One of the limitations of hypothetical performance results is that they are generally prepared with the benefit of hindsight. In addition, hypothetical trading does not involve financial risk, and no hypothetical trading record can completely account for the impact of financial risk of actual trading. for example, the ability to withstand losses or to adhere to a particular trading program in spite of trading losses are material points which can also adversely affect actual trading results. There are numerous other factors related to the markets in general or to the implementation of any specific trading program which cannot be fully accounted for in the preparation of hypothetical performance results and all which can adversely affect trading results.

Testimonial Disclosure: Testimonials appearing on this website may not be representative of other clients or customers and is not a guarantee of future performance or success.