
Yen Again

In this piece, I wrote about a potentially favorable setup for the Japanese Yen. Since then, the yen - and ticker FXY (Invesco CurrencyShares Japanese Yen Trust), the ETF that tracks yen futures - have done almost nothing. In this piece, we will refocus once again on the yen and highlight some example trades for a trader who believes that the yen will work higher in the months ahead.
PRICE
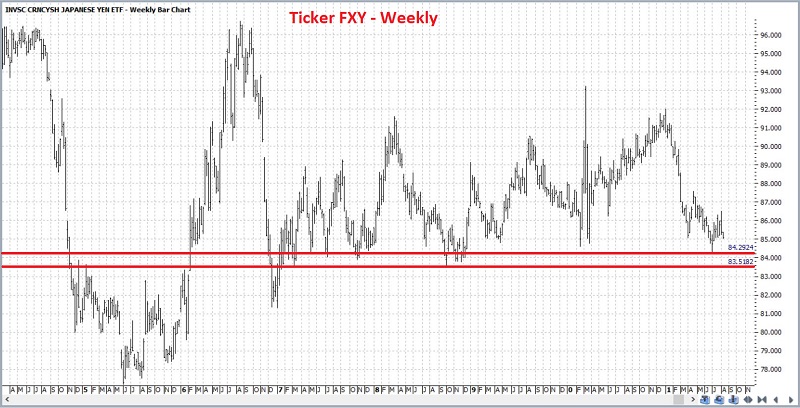
Let's start with the weekly chart for ticker FXY. The chart below (courtesy of Profitsource) shows two potential support levels for ticker FXY.
The daily chart below shows the same two support levels plus a 5-wave down completed Elliott Wave count (calculated - for better or worse - by the algorithm built into Profitsource). This suggests that the recent downtrend may have run its course.
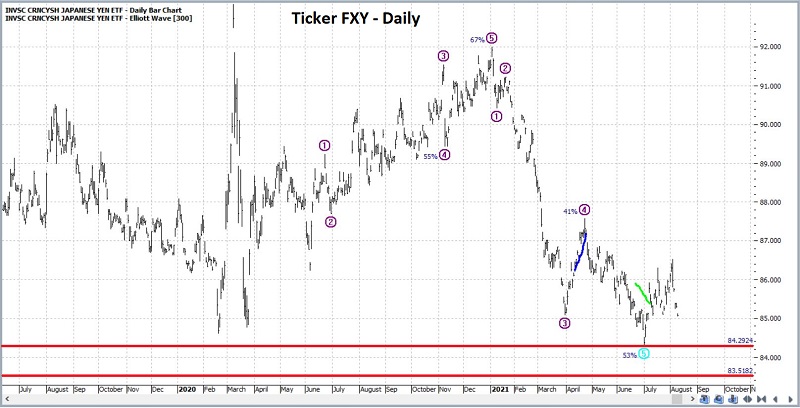
The items highlighted in the chart above do not necessarily constitute a "buy" signal (at least not in any objective, quantifiable sense). However, at the very least, these items may give a trader a reasonable point to say "I'm wrong" and that it is time to get out of a long trade.
SEASONALITY
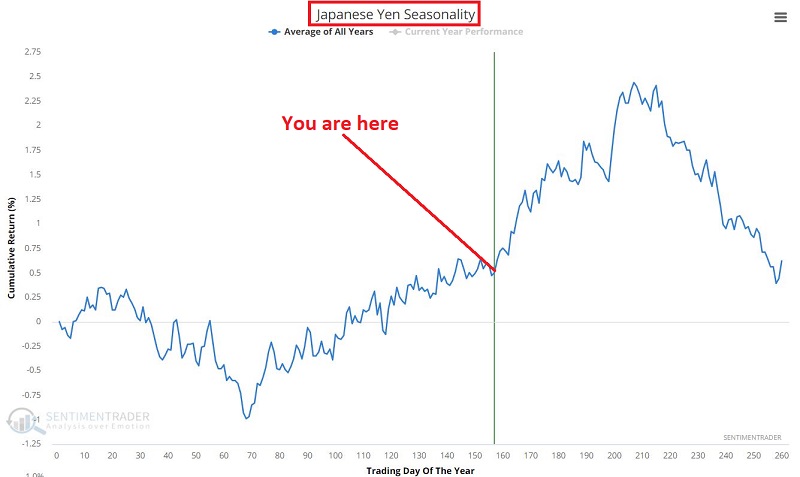
In the chart below, we see that the yen is still very much in the midst of a seasonally favorable period. As usual, this is typically not enough to go on all by itself - and in any given year, the market may behave completely differently than suggested by its seasonal pattern. But it may give a trader another reason to contemplate speculating on the long side of the yen.
SENTIMENT
The chart below displays all trading days:
- When the Japanese Yen Optix 50-day moving average was below 39%
- During the past 5 years
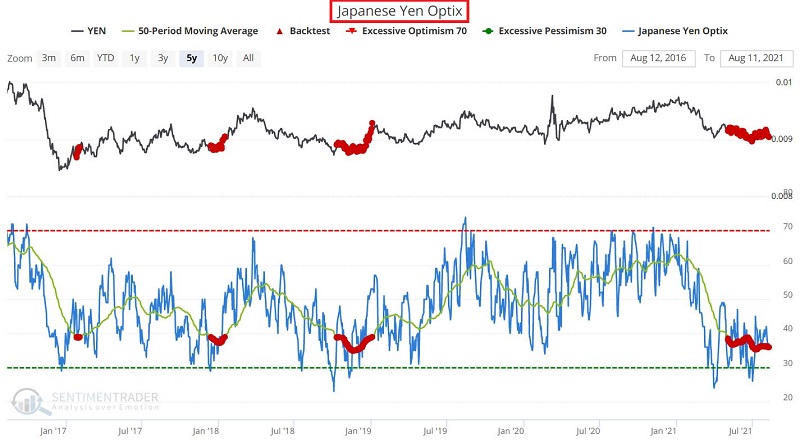
The results appear in the table below. Most notable is the favorable Win Rate 3 and 6 months after recent signals.
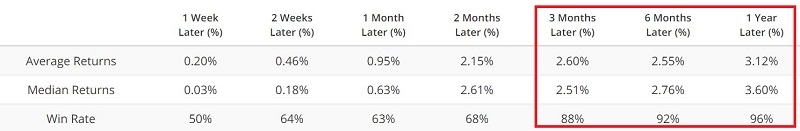
It should be noted that results before the past 5 years were not as consistent as the yen experienced a series of multi-year bear markets. But given more recent results, a trader might interpret the current reading as a potentially favorable contrarian sign for the yen in the months ahead.
ASSESSING THE SETUP
Does the above suggest taking a long trade in the yen? That's for each trader to decide for themselves. In review:
- Price Action: The yen is NOT presently in an uptrend per se. It is more like "it appears to have stopped going down."
- Seasonality: Clearly "favorable", but with the caveat that some years seasonal trends work well and some years they don't
- Sentiment: Currently a slightly positive favorable contrarian setup. But has only been useful in the past 5 years
Does all of the above constitute a "Bullish" setup worth risking money on? Again, that is for each individual trader to decide, and no prediction is being made. We have merely presented some "weight of the evidence" for you to ponder.
For sake of example, we will assume that a trader decides they want to play the long side of the yen in the months ahead. What follows are some examples of ways to trade the long side of the yen - with an analysis of the potential risks involved. The example trades below are for educational purposes only and should not be considered as a "recommendation."
EXAMPLE FUTURES TRADE
The most straightforward approach to playing the long side of the yen market would be to buy a futures contract. It must be noted that futures trading entails a great deal of risk, both in terms of the potential for adverse price movement and the effect of leverage. Futures trading is not suitable for everyone, and the example below is for illustrative and educational purposes only. No recommendation is being made that you trade futures contracts.
For the Japanese Yen futures contract traded at the Chicago Mercantile Exchange:
- The value of 1-tick is $12.50
- A one full point movement in price is worth $125,000
- To enter a position, a trader must put up the minimum margin of $4,860
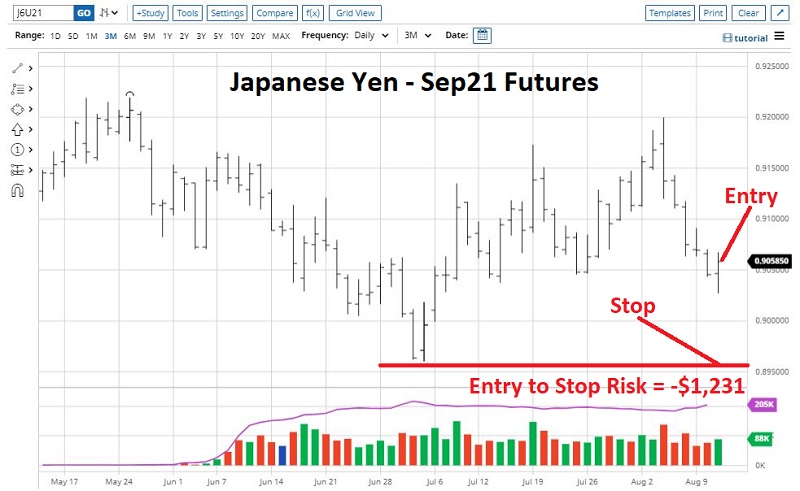
In the chart below, we find the September Japanese Yen futures contract:
- Trading at 0.90585
- With a recent low of 0.89605
This implies that:
- The value of the contract is presently $113,231.25 (0.90585 x $125,000)
- The leverage is equal to 23.3-to-1 (contract value of $113,231 divided by margin of $4,860)
That should give you an idea of the massive amount of leverage involved in futures trading.
Consider a trader who wants to play the long side of the yen, understands the risks of trading futures contracts, and is financially able to assume those risks. They might:
- Put up the $4,860 initial margin
- Buy one September Japanese yen futures contract at 0.90585
- Place a stop-loss order to sell one September Japanese yen contract at 0.89600 (i.e., 5 ticks below the recent low)
From there:
- If the futures contract rises in price, the trader will make $12.50 for each tick of price advance
- If the futures contract price rises from 0.90585 to the recent high of .92000, the open profit would be +$1,768.75
- If the stop-loss order is hit and our trader sells at the stop price of 0.89600, they will experience a dollar loss of -$1,231.25 per contract (0.89600 - 0.90585 times $125,000)
EXAMPLE OPTION TRADE ON ETF TICKER FXY
Another possibility for a trader not willing or able to deal with the leverage involved with futures trading would be to buy shares of ticker FXY as a proxy for the yen. With FXY trading at $85.19 a share, a trader would put up $8,519 in a stock brokerage account to buy 100 shares. For each $1.00 FXY goes up or down, the trader would make or lose $100.
One other alternative would be to take a position in FXY options. A few caveats:
- FXY options are often thinly traded, and bid/ask spreads can be an issue (limit orders are suggested when entering a trade)
- The example FXY option trade that follows is for illustrative purposes only
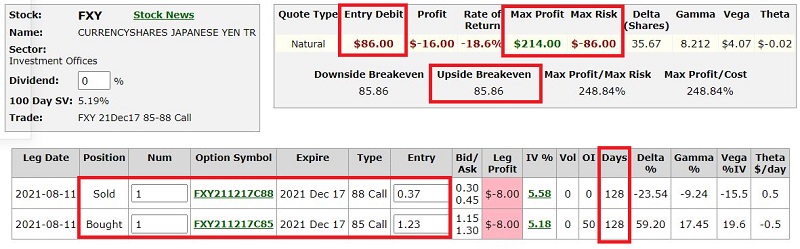
The example trade involves:
- Buying FXY December 2021 85 calls @ $1.23
- Selling FXY December 2021 88 calls at $0.37
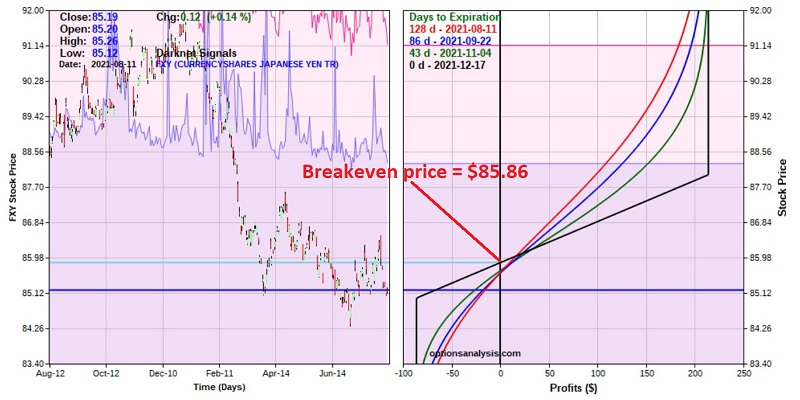
The particulars for this position appear in the screenshot below and the risk curves in the chart below that (both courtesy of Optionsanalysis).
Things to note:
- Assuming a trader can get filled at the midpoint of the bid/ask range (not a sure thing given the illiquidity of the options used) using a limit order, the cost to enter the trade - and the maximum risk - is $86 for a 1-lot
- With FXY trading at $85.19, the breakeven price is $85.86
- If FXY rallies back up to the April 2021 high of $87.58, the profit would be $80 to $172, depending on whether that price is hit sooner or later
- If FXY rallies back up to the January 2021 high of $92.01, the profit would be $194 to $212, depending on whether that price is hit sooner or later
- If FXY falls below the July low of $84.31, the loss would be -$44 to -$86, again depending on whether that price is hit sooner or later
SUMMARY
As always, the purpose of this piece is not to convince you to take a particular trade. The primary purpose is to help you develop your own ability to "think like a trader" and to:
Spot Opportunity: By piecing together enough elements (price action, seasonality, sentiment) to justify a bullish (or bearish) position, as the case may be
Exploit Opportunity: By deciding the proper vehicle (be it futures, stock, or ETF shares, or options) to use to achieve the desired tradeoff between reward and risk.