
XME and EEM enter summer doldrums

Key Points
- The S&P Metals and Mining Index and the MSCI Emerging Markets Index are entering unfavorable seasonal periods
- The message is not so much that these sectors are likely to decline
- The message is that investors can likely find better opportunities elsewhere
Metals and Mining (XME)
Ticker XME (SPDR Metals & Mining ETF) is an ETF that tracks the S&P 500 Metals and Mining Index. The chart below displays the annual seasonal trend for ticker XME. 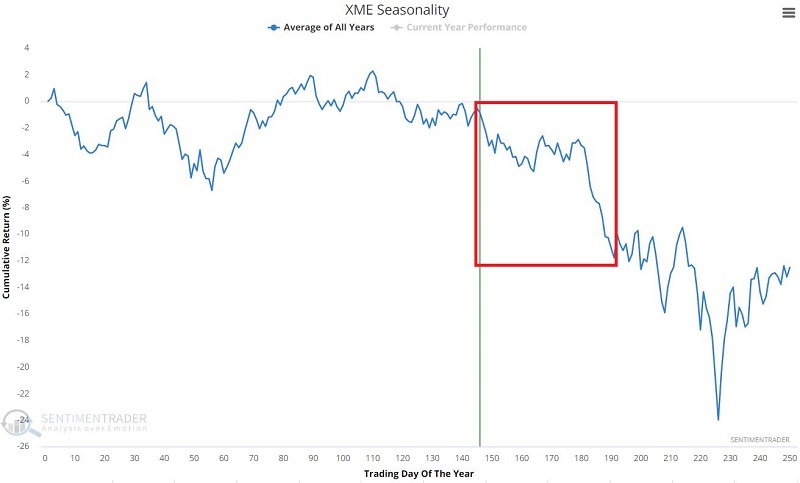 Note the seasonally unfavorable period between Trading Day of Year (TDY) #145 and TDY #191. For 2022, this period extends from the close on 8/1/2022 through the closing on 10/5/2022.
The chart below displays the cumulative % + (-) for the Metals & Mining Index only during this seasonally unfavorable period since 1980.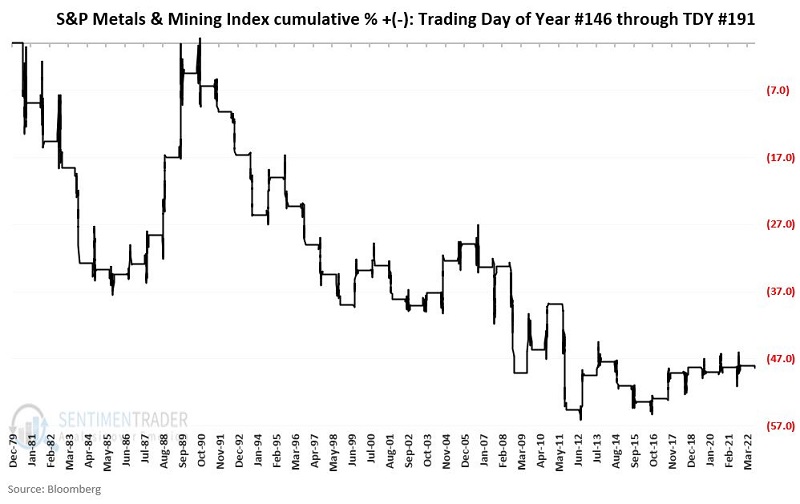
The table below displays the summary of the results.
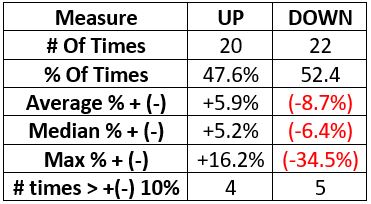
Note that the statistical differences between up years and down years are minor. Still, the net effect is pretty evident in the chart above. Most importantly, this study does not necessarily suggest that XME is doomed to decline between now and early October. This study suggests that investors may be wise to look elsewhere for a bullish opportunity.
Emerging Markets (EEM)
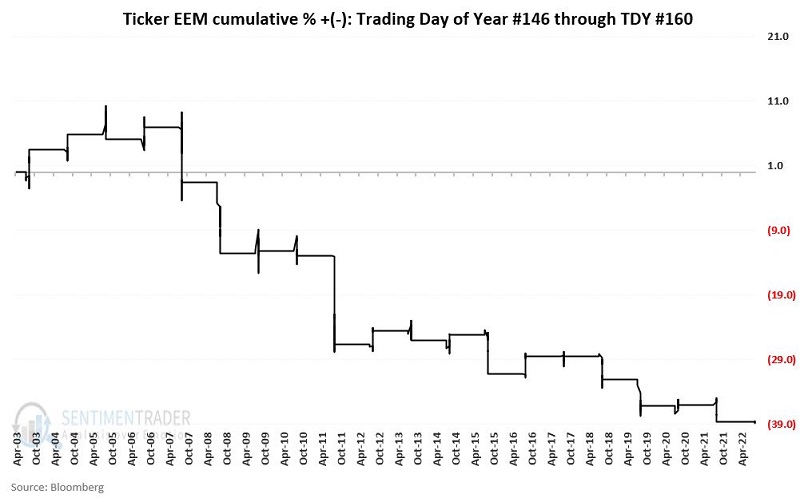
Ticker EEM (iShares MSCI Emerging Markets ETF) is an ETF that tracks the MSCI Emerging Markets Index. The chart below displays the annual seasonal trend for ticker EEM. 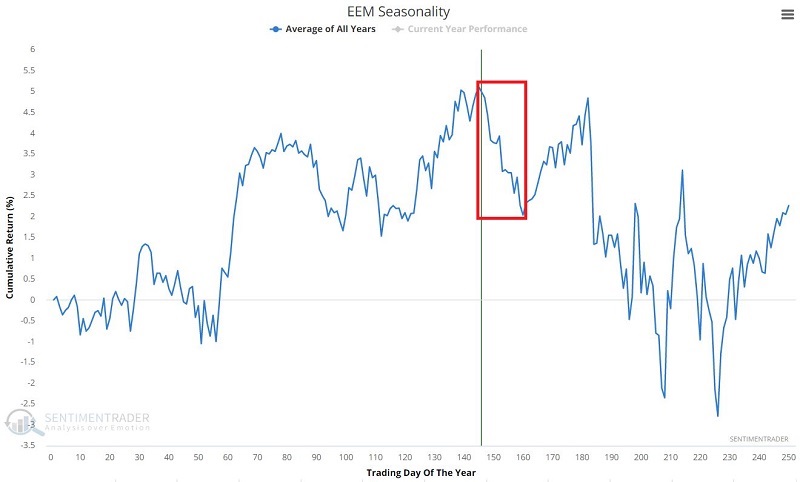
Note the seasonally unfavorable period between Trading Day of Year (TDY) #145 and TDY #160. For 2022, this period extends from the close on 8/1/2022 through the closing on 8/22/2022.
The chart below displays the cumulative % + (-) for EEM only during this seasonally unfavorable period.
 The table below displays the summary of the results.
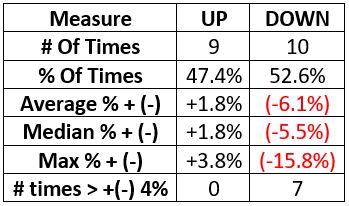
As with XME, from year to year, it is a coin flip as to whether EEM will show a gain or a loss during this period. What does stand out is that the average and median down year is roughly three times as large as the average and median up year. This study does not necessarily suggest that EEM is doomed to decline in the next several weeks. It means that you need to have a good reason to want to commit your capital to the long side of EEM at the moment.
What the research tells us…
Investors and traders spend a lot of time looking for indicators and signals to tell them what to trade and when. Far less appreciated - but almost as important - is figuring out what not to trade. XME and EEM could easily stage price advances in the days and weeks ahead. Nevertheless, history suggests we look elsewhere for opportunities with a higher probability of success.