Data &
Technology
Research
Reports
Report Solutions
Reports Library
Actionable
Strategies
Free
Resources
Simple Backtest Calculator
Simple Seasonality Calculator
The Kelly Criterion Calculator
Sentiment Geo Map
Public Research Reports
Free Webinar
Pricing
Company
About
Meet Our Team
In the News
Testimonials
Client Success Stories
Contact
Log inLoginSign up
< BACK TO ALL REPORTS

Worst economic data since....

Troy Bombardia
2020-04-16
"Recently released economic data is the worst in".....

Recently released economic data in the U.S. and other countries is bad. Just how bad depends on what indicator you look at: Retail Sales, Industrial Production, employment figures, etc.

The problem with using economic data to make historical comparisons in a bear market/recession (trying to find the bottom of a recession/bear market) is that:

  1. There are only so few major bear markets and recessions in history.
  2. No 2 recessions are really that similar. 

This is why I can find Indicator XYZ that tells you "the S&P and economy today is just like March 2008" (i.e. market can fall much more), and at the same time I can find another Indicator ABC that tells you "the S&P and economy today is just like March 2009" (i.e. bottom is in). Here's an example.

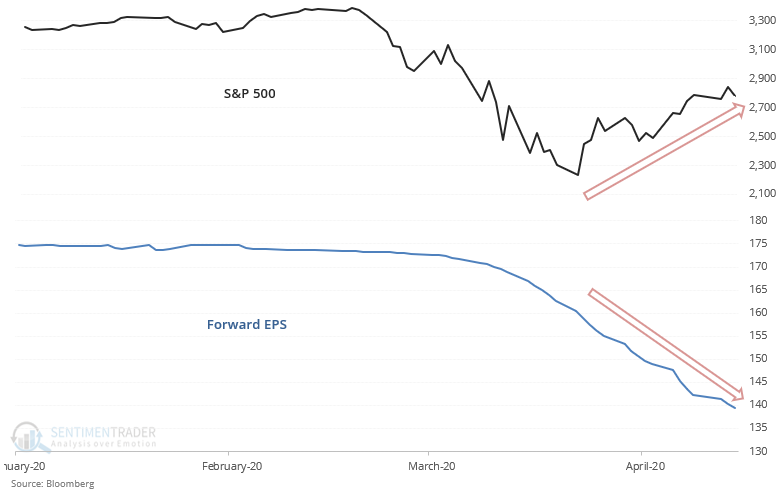
The S&P's significant rally from its March bottom has been accompanied by falling forward earnings:

The only other time the S&P rallied significantly while forward earnings continued to fall was in March 2009, just as the bear market ended:

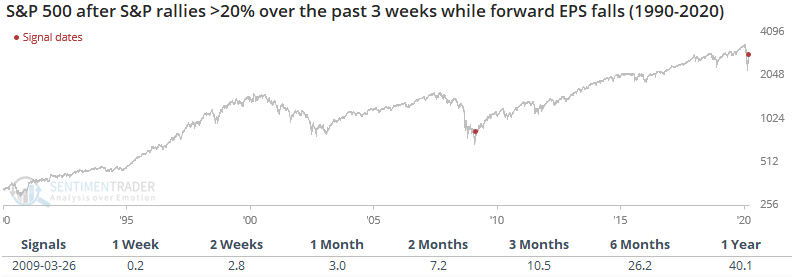
As you can see, such a surface level analysis would say "it's completely normal for earnings to fall while stocks spike! The last time this happened was at the bottom of the last bear market, as analysts were forced to adjust their expectations upwards! Prepare for an imminent and massive reversal!"

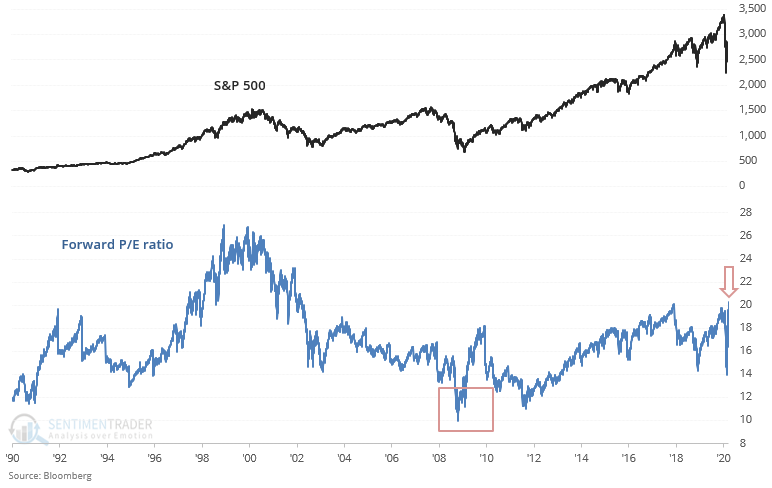
Here's the most important difference between today and March 2009. Valuations in March 2009 were SIGNIFICANTLY LOWER than they are today. While valuations do not matter on a 1 year forward basis, they certainly matter on a 5-10 year forward basis since valuations determine long term risk/reward. Much lower valuations back in March 2009 enabled stocks to climb significantly over the coming years. The S&P 500's forward P/E ratio is currently at 20, a level reached in January 2018 and late-2019. This implies that long term future returns will be low. Buyers beware: there is no sense for long term investors to chase stocks now. There are much better opportunities in private markets right now (e.g. real estate).

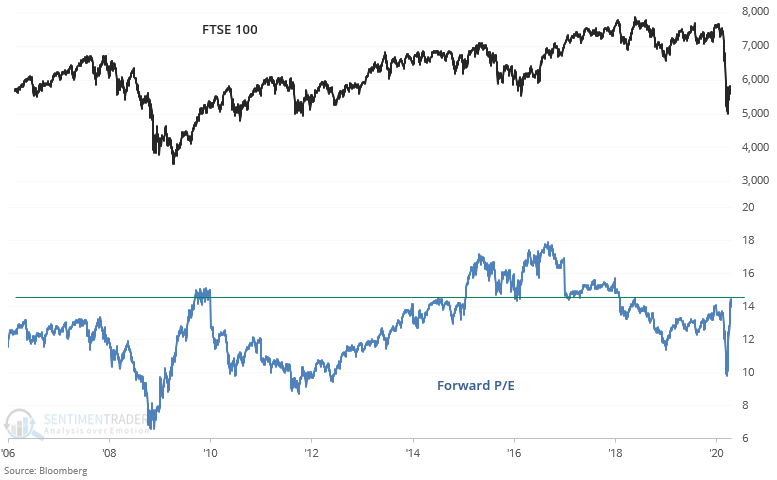
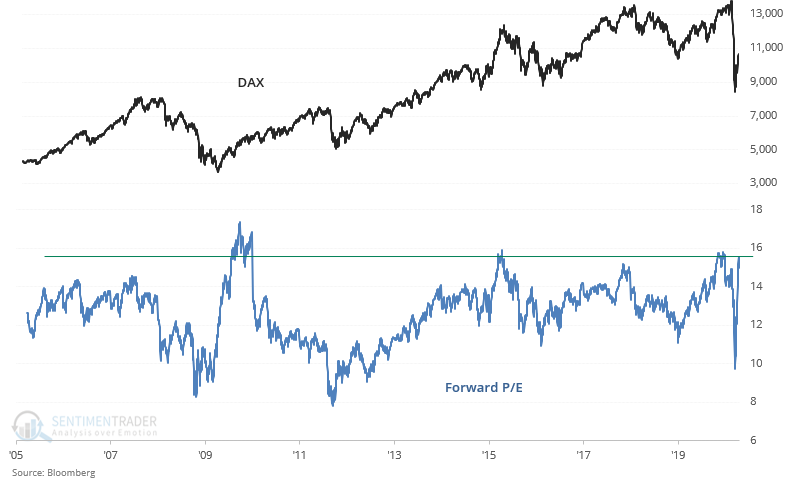
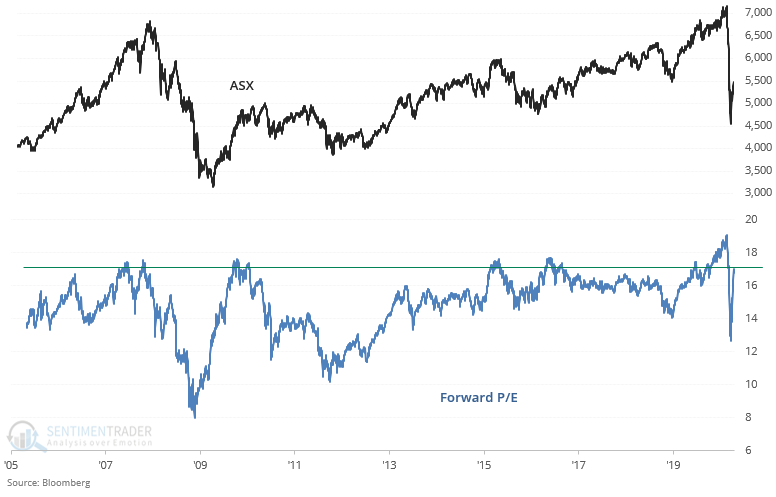
Although valuations outside the U.S. are more attractive than U.S. valuations, they have still increased significantly.

Here's Germany:

Here's Australia:

Here's the UK:

Sorry, you don't have access to this report

Upgrade your subscription plan to get access
Go to Dasboard
DATA &
TECHnologies
IndicatorEdge
‍
BackTestEdge
‍
Other Tools
‍
DataEdge API
RESEARCH
reports
Research Solution
‍
Reports Library
‍
actionable
Strategies
Trading Strategies
‍
Smart Stock Scanner
‍
FREE
RESOUrCES
Simple Backtest
Calculator
Simple Seasonality
Calculator
The Kelly Criterion
Calculator
Sentiment Geo Map
‍
Public Research Reports
‍
Free Webinar
COMPANY
‍
About
‍
Meet our Team
‍
In the News
‍
Testimonials
‍
Client Success Stories
Pricing
Bundle pricing
‍
Announcements
‍
FAQ
© 2024 Sundial Capital Research Inc. All rights reserved.
Setsail Marketing
TermsPrivacyAffiliate Program
Risk Disclosure: Futures and forex trading contains substantial risk and is not for every investor. An investor could potentially lose all or more than the initial investment. Risk capital is money that can be lost without jeopardizing ones’ financial security or life style. Only risk capital should be used for trading and only those with sufficient risk capital should consider trading. Past performance is not necessarily indicative of future results.

Hypothetical Performance Disclosure: Hypothetical performance results have many inherent limitations, some of which are described below. No representation is being made that any account will or is likely to achieve profits or losses similar to those shown; in fact, there are frequently sharp differences between hypothetical performance results and the actual results subsequently achieved by any particular trading program. One of the limitations of hypothetical performance results is that they are generally prepared with the benefit of hindsight. In addition, hypothetical trading does not involve financial risk, and no hypothetical trading record can completely account for the impact of financial risk of actual trading. for example, the ability to withstand losses or to adhere to a particular trading program in spite of trading losses are material points which can also adversely affect actual trading results. There are numerous other factors related to the markets in general or to the implementation of any specific trading program which cannot be fully accounted for in the preparation of hypothetical performance results and all which can adversely affect trading results.

Testimonial Disclosure: Testimonials appearing on this website may not be representative of other clients or customers and is not a guarantee of future performance or success.