Data &
Technology
Research
Reports
Report Solutions
Reports Library
Actionable
Strategies
Free
Resources
Simple Backtest Calculator
Simple Seasonality Calculator
The Kelly Criterion Calculator
Sentiment Geo Map
Public Research Reports
Free Webinar
Pricing
Company
About
Meet Our Team
In the News
Testimonials
Client Success Stories
Contact
Log inLoginSign up
< BACK TO ALL REPORTS

Worldwide stock markets ease out of corrections

Jason Goepfert
2021-01-22
For the first time in more than 200 days, fewer than 20% of major world stock markets are in corrections, down more than 10% from their highs.

Investor behavior is like we see near the end, but markets are showing the signs we typically see during the beginning stages of a long-term recovery with thrusts in breadth and the percentage of securities hitting 52-week highs. It's very strange.

Among the signs of recovery, not just in the U.S. but worldwide, is that for the first time in more than 200 days, fewer than 20% of major world equity indexes are in corrections. 

Percentage of world markets in correction

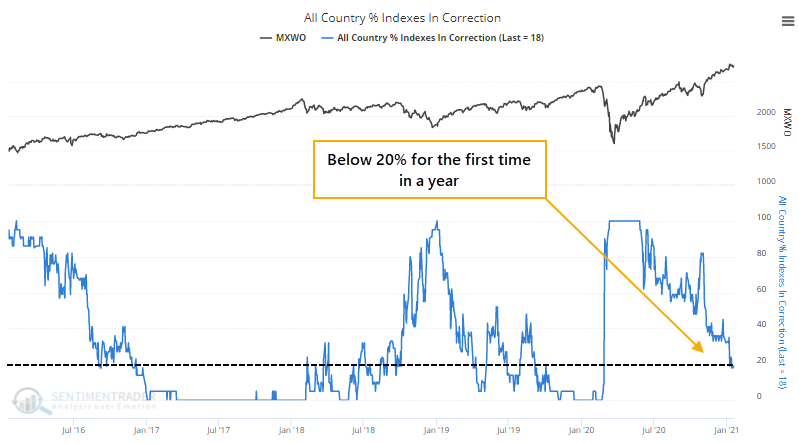
This ends one of the longer streaks since 1971 when more than 20% of countries had been in a correction at the same time. 

Days since countries in correction

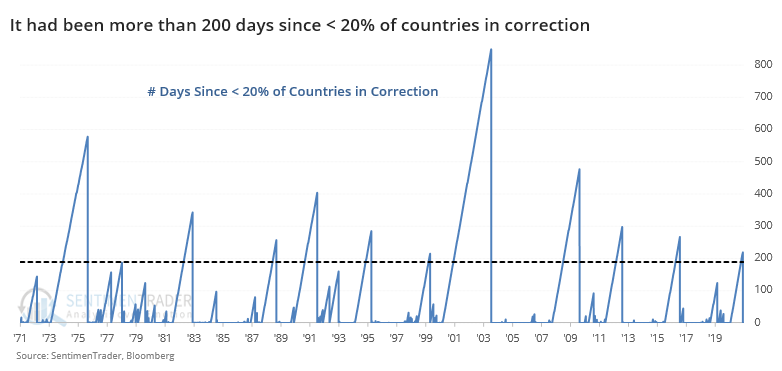
After other streaks ended, it was a good longer-term sign for world stocks. The MSCI World Index showed a positive return over the next 6 months every time, and over the next 9-12 months all but once. Losses were minimal, and the risk/reward was excellent.


What else we're looking at

  • A look at where we are in a typical Sentiment Cycle
  • What that means vs. the market environment
  • What happens to world markets, the S&P 500, small-caps and value stocks when there is a worldwide recovery
  • Forward returns since 1928 when more than 80% of NYSE securities are trading above their 200-day moving average
  • The benefits of a stock replacement strategy using options
  • What happens when XLF sees big ETF inflows
  • Active managers in the NAAIM survey are extremely confident but it doesn't mean what you think
  • Breadth has been pristine, but some recent worrying signs

Stat Box

On Thursday, the Nasdaq Composite rose more than 0.5% to a record high, yet fewer than 45% of securities on the Nasdaq exchange advanced. That's only happened 9 other times in the past 35 years.


Sentiment from other perspectives

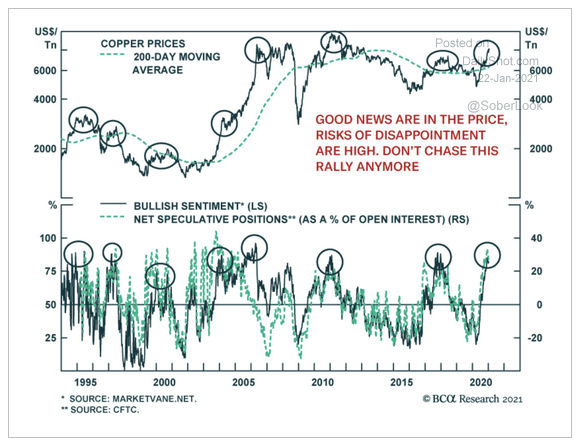
Confidence abounds across markets, not just in stocks. Commodities and industrial metals have seen outsized optimism as well. Bets on copper are now among the highest in 25 years. Source: BCA Research via Daily Shot

copper net speculative positions

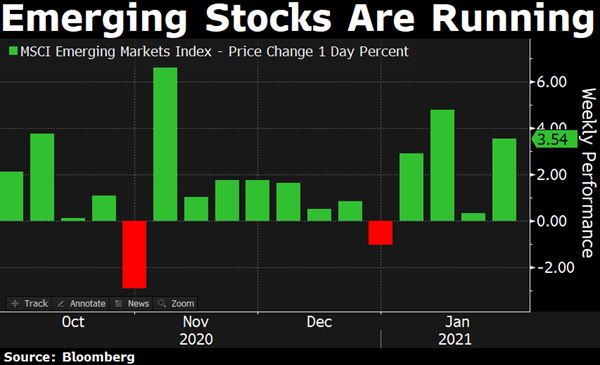
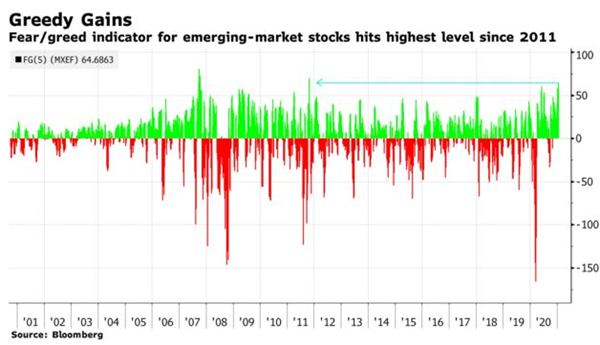
There is a high positive correlation between commodity markets and emerging market stocks, and the rally in the former has coincided with one in the latter. Bloomberg's proprietary Fear/Greed indicator is now in the danger zone for emerging stocks. Source: Bloomberg

bloomberg fear greed emerging markets

Optimism does tend to percolate when a market has suffered only 2 losing weeks in 4 months. Source: Bloomberg TV

emerging markets weekly gain

DATA &
TECHnologies
IndicatorEdge
‍
BackTestEdge
‍
Other Tools
‍
DataEdge API
RESEARCH
reports
Research Solution
‍
Reports Library
‍
actionable
Strategies
Trading Strategies
‍
Smart Stock Scanner
‍
FREE
RESOUrCES
Simple Backtest
Calculator
Simple Seasonality
Calculator
The Kelly Criterion
Calculator
Sentiment Geo Map
‍
Public Research Reports
‍
Free Webinar
COMPANY
‍
About
‍
Meet our Team
‍
In the News
‍
Testimonials
‍
Client Success Stories
Pricing
Bundle pricing
‍
Announcements
‍
FAQ
© 2024 Sundial Capital Research Inc. All rights reserved.
Setsail Marketing
TermsPrivacyAffiliate Program
Risk Disclosure: Futures and forex trading contains substantial risk and is not for every investor. An investor could potentially lose all or more than the initial investment. Risk capital is money that can be lost without jeopardizing ones’ financial security or life style. Only risk capital should be used for trading and only those with sufficient risk capital should consider trading. Past performance is not necessarily indicative of future results.

Hypothetical Performance Disclosure: Hypothetical performance results have many inherent limitations, some of which are described below. No representation is being made that any account will or is likely to achieve profits or losses similar to those shown; in fact, there are frequently sharp differences between hypothetical performance results and the actual results subsequently achieved by any particular trading program. One of the limitations of hypothetical performance results is that they are generally prepared with the benefit of hindsight. In addition, hypothetical trading does not involve financial risk, and no hypothetical trading record can completely account for the impact of financial risk of actual trading. for example, the ability to withstand losses or to adhere to a particular trading program in spite of trading losses are material points which can also adversely affect actual trading results. There are numerous other factors related to the markets in general or to the implementation of any specific trading program which cannot be fully accounted for in the preparation of hypothetical performance results and all which can adversely affect trading results.

Testimonial Disclosure: Testimonials appearing on this website may not be representative of other clients or customers and is not a guarantee of future performance or success.