Data &
Technology
Research
Reports
Report Solutions
Reports Library
Actionable
Strategies
Free
Resources
Simple Backtest Calculator
Simple Seasonality Calculator
The Kelly Criterion Calculator
Sentiment Geo Map
Public Research Reports
Free Webinar
Pricing
Company
About
Meet Our Team
In the News
Testimonials
Client Success Stories
Contact
Log inLoginSign up
< BACK TO ALL REPORTS

Within 1% of a High...And Investors Are Already Fearful?

Jason Goepfert
2021-07-21
The Fear & Greed model has been falling even while stocks have been holding near highs...that's not the positive it's made out to be.

Investors are already fearful, and that has to be a good sign for stocks.

That's the theory being bandied about regarding the CNN Fear & Greed model. The news organization's sentiment measure has been sliding lower for weeks and is nearing a level considered to show fear.

We used their publicly revealed inputs to recreate the model, though to generate more history and hopefully more accuracy, we use different inputs for high-yield bonds and put/call ratios. There is about a 95% correlation between the two versions.

Unlike at market bottoms, sentiment often peaks well ahead of prices. Investors become euphoric, push prices higher, then gradually lose interest. Bull markets need steadily rising optimism to continue rising, so this is an issue.

Fear & Greed model low while stocks high

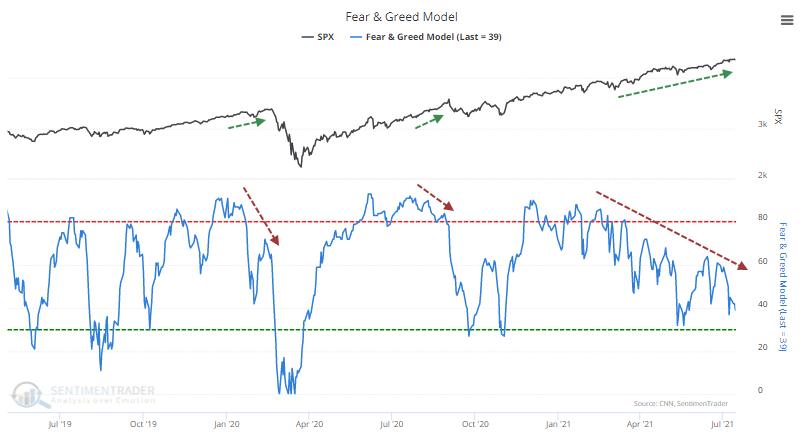
When we look at the numbers, we can see why declining Greed is not necessarily a good thing. We looked at every time since 1998 when the S&P 500 had been at a 52-week high within the past week, and Fear & Greed fell below 40. 

Short-term returns were weak but not terrible. How about when the model fell below 40 but the S&P was still within 1% of its high at the time? Here, not so good. Over the next three months, the S&P 500 rallied only 25% of the time.


What else we're looking at

  • Full returns in the S&P following low readings in the Fear & Greed Model
  • What happens after Dumb Money Confidence finally crosses below Smart Money Confidence
  • An indication that energy is oversold
  • A mean reversion signal for airline stocks
  • What a persistently high Gamma Exposure has meant for stocks

Stat box

On Monday, crude oil futures suffered more than a 7% loss, the worst in more than 6 months. Of the 25 other times they suffered such a loss, the contract rebounded over the next week only 25% of the time, with a median return of -2.4%. The weakness tended to only be short-term, however.

Etcetera

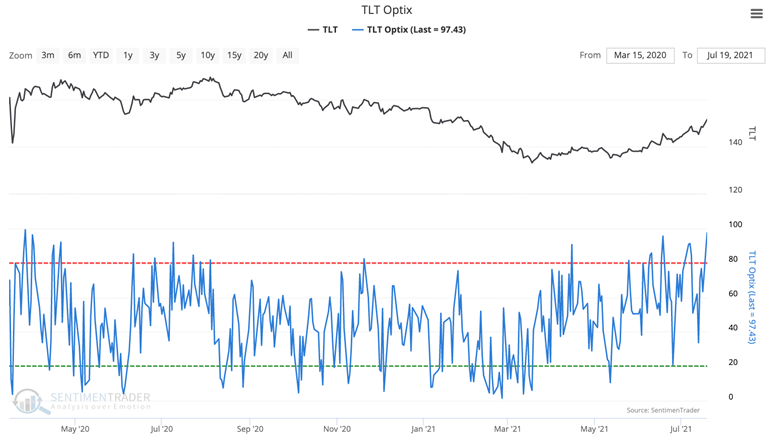
Treasur[y] chest. The TLT Optimism Index soared to its highest point since March 2020 earlier this week.

tlt optimism index sentiment

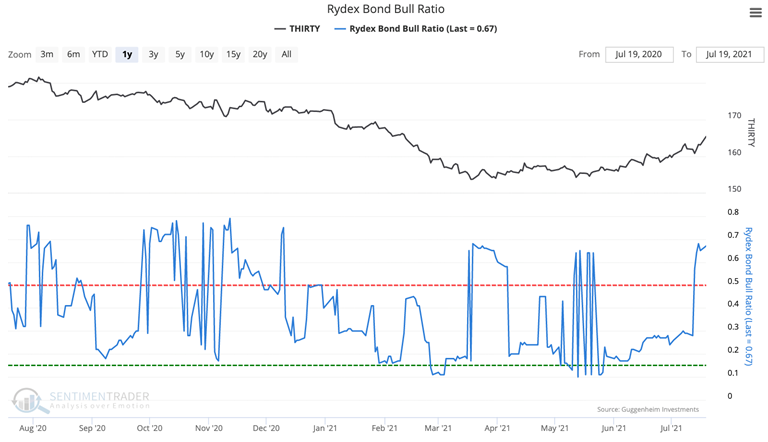
Bull rush. The market timers using the Rydex family of mutual funds once again have a large portion of their funds in the bullish versus inverse bond fund.

rydex bond bull ratio

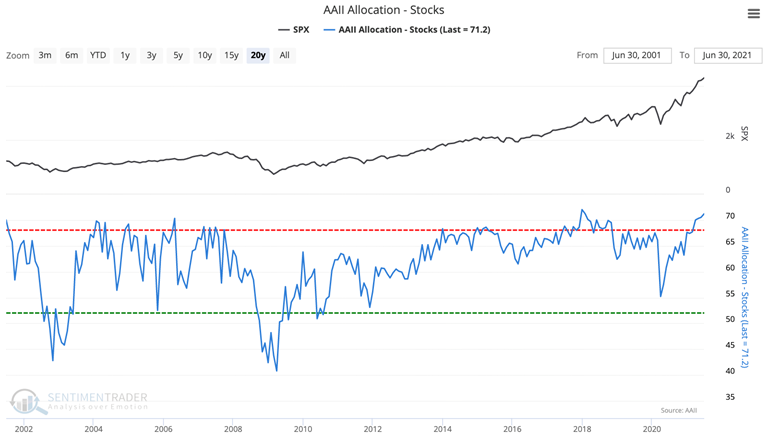
Catching up. Individual investors in the AAII survey have 72% of their assets invested in the stock market, moving to one of the highest levels since 1987.

aaii asset allocation

DATA &
TECHnologies
IndicatorEdge
‍
BackTestEdge
‍
Other Tools
‍
DataEdge API
RESEARCH
reports
Research Solution
‍
Reports Library
‍
actionable
Strategies
Trading Strategies
‍
Smart Stock Scanner
‍
FREE
RESOUrCES
Simple Backtest
Calculator
Simple Seasonality
Calculator
The Kelly Criterion
Calculator
Sentiment Geo Map
‍
Public Research Reports
‍
Free Webinar
COMPANY
‍
About
‍
Meet our Team
‍
In the News
‍
Testimonials
‍
Client Success Stories
Pricing
Bundle pricing
‍
Announcements
‍
FAQ
© 2024 Sundial Capital Research Inc. All rights reserved.
Setsail Marketing
TermsPrivacyAffiliate Program
Risk Disclosure: Futures and forex trading contains substantial risk and is not for every investor. An investor could potentially lose all or more than the initial investment. Risk capital is money that can be lost without jeopardizing ones’ financial security or life style. Only risk capital should be used for trading and only those with sufficient risk capital should consider trading. Past performance is not necessarily indicative of future results.

Hypothetical Performance Disclosure: Hypothetical performance results have many inherent limitations, some of which are described below. No representation is being made that any account will or is likely to achieve profits or losses similar to those shown; in fact, there are frequently sharp differences between hypothetical performance results and the actual results subsequently achieved by any particular trading program. One of the limitations of hypothetical performance results is that they are generally prepared with the benefit of hindsight. In addition, hypothetical trading does not involve financial risk, and no hypothetical trading record can completely account for the impact of financial risk of actual trading. for example, the ability to withstand losses or to adhere to a particular trading program in spite of trading losses are material points which can also adversely affect actual trading results. There are numerous other factors related to the markets in general or to the implementation of any specific trading program which cannot be fully accounted for in the preparation of hypothetical performance results and all which can adversely affect trading results.

Testimonial Disclosure: Testimonials appearing on this website may not be representative of other clients or customers and is not a guarantee of future performance or success.