
Winter weakness in these four markets

Key Points
- Many commodities exhibit strong seasonal tendencies
- Four that tend to experience late winter weakness are silver, platinum, sugar, and the British pound
- No seasonal trend is perfect, but being aware of tendencies can offer a trader a critical "edge" in deciding how to play certain situations
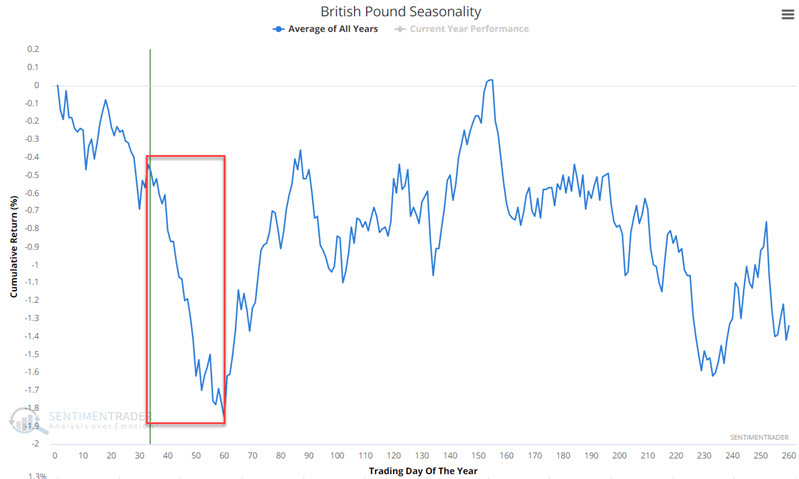
British Pound
The chart below displays the annual seasonal trend for British pound futures. Note the period highlighted in red.
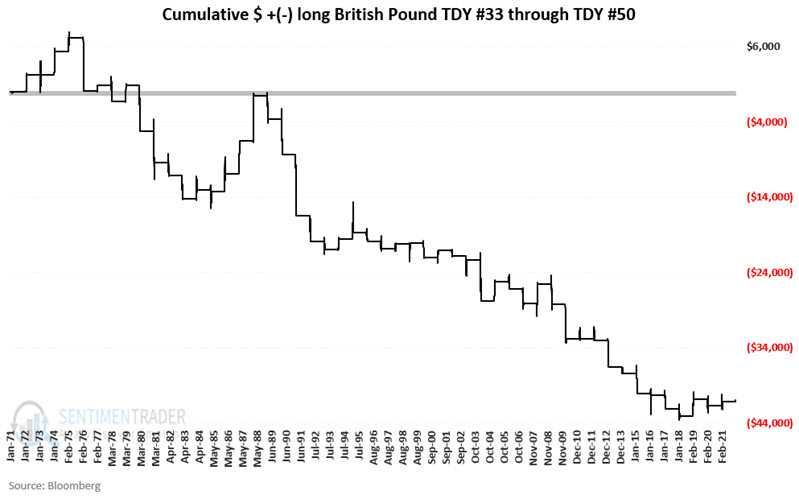
The chart below displays the cumulative $ gain/loss for British pound futures held long only from Trading Day of Year (TDY) #33 through TDY #50. For 2022 this period began at the close on 2/16 and extends through the close on 3/14.
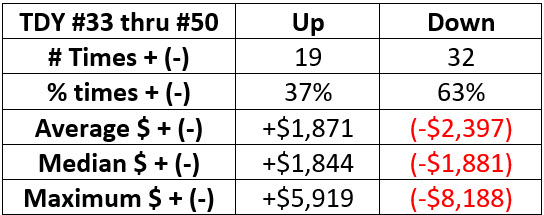
The table below displays a summary of the results.
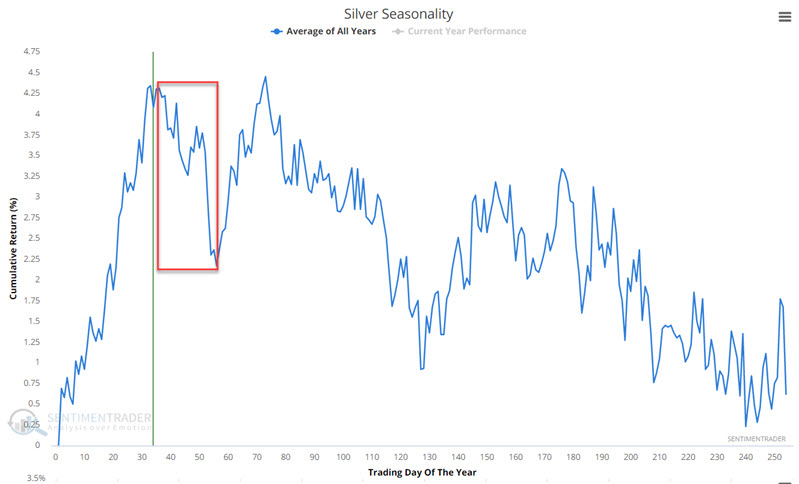
Silver
The chart below displays the annual seasonal trend for silver futures. Note the period highlighted in red.
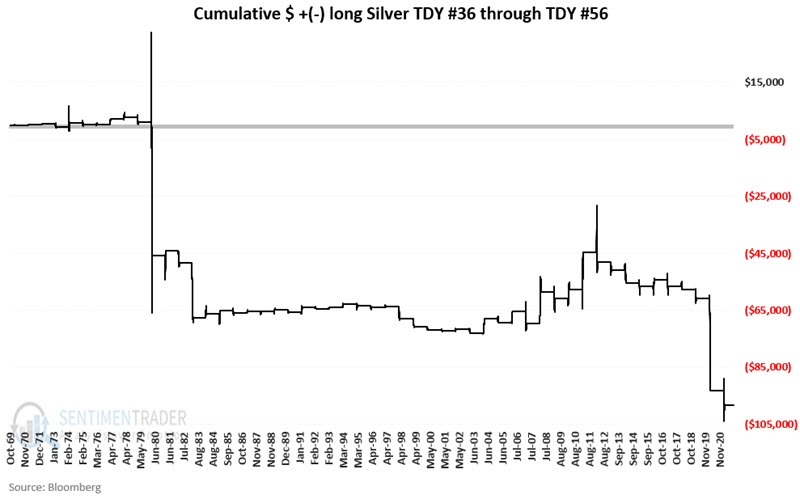
The chart below displays the cumulative $ gain/loss for silver futures if held long only from Trading Day of Year (TDY) #36 through TDY #56. For 2022 this period began at the close on 2/22 and extends through the close on 3/22.
The table below displays a summary of the results.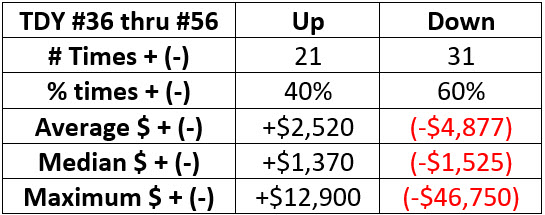
Note that when silver is bad during this period, it can be very bad - with losses over -$19,000 in 1983, -$32,000 in 2020, and -$46,000 in 1980.
Platinum
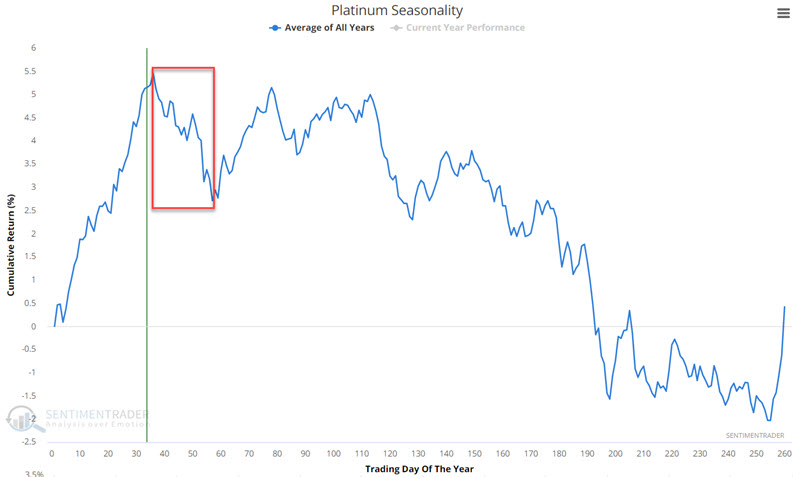
Platinum is about to wrap up what I refer to as "the most platinum time of the year." The chart below displays the annual seasonal trend for platinum futures. Note the period highlighted in red.
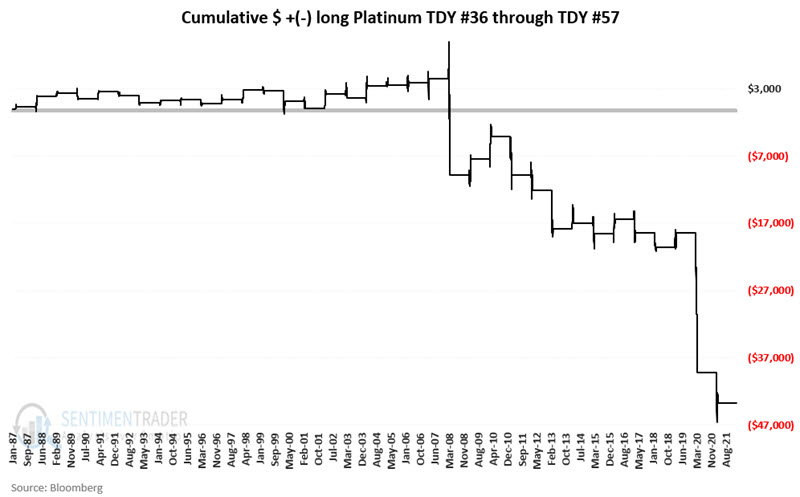
The chart below displays the cumulative $ gain/loss for platinum futures if held long only from Trading Day of Year (TDY) #36 through TDY #57. For 2022 this period began at the close on 2/22 and extends through the close on 3/23.
The table below displays a summary of the results.
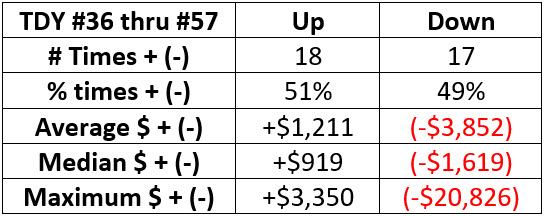
Note that winners and losers are roughly 50/50. The key thing to note is that - like silver - when platinum is bad during this period, it is very bad - registering losses over -$5,000 in 2011 and 213, -$14,000 in 2008 and -$20,000 in 2020.
Sugar
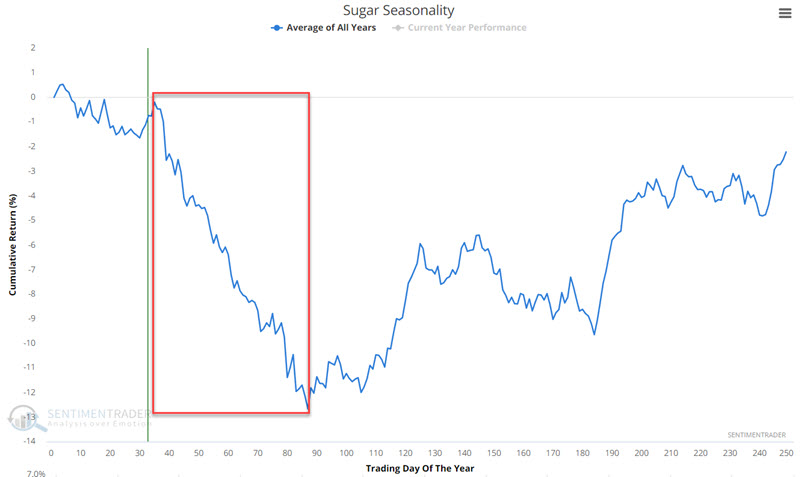
The chart below displays the annual seasonal trend for sugar futures. Note the period highlighted in red.
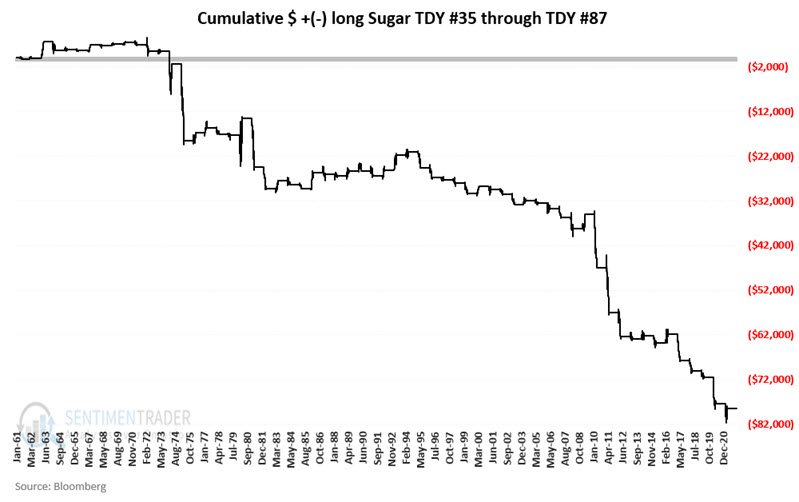
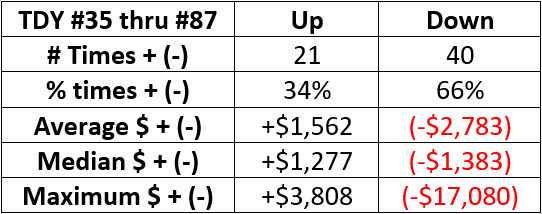
The chart below displays the cumulative $ gain/loss for sugar futures if held long only from Trading Day of Year (TDY) #35 through TDY #87. For 2022 this period began at the close on 2/22 and extends through the close on 5/6.
The table below displays a summary of the results.
ETF Alternatives
For traders not comfortable trading futures, there are ETF alternatives. That said, please note that shorting commodity ETF shares entails a high degree of risk, and a trader should carefully consider these risks before trading.
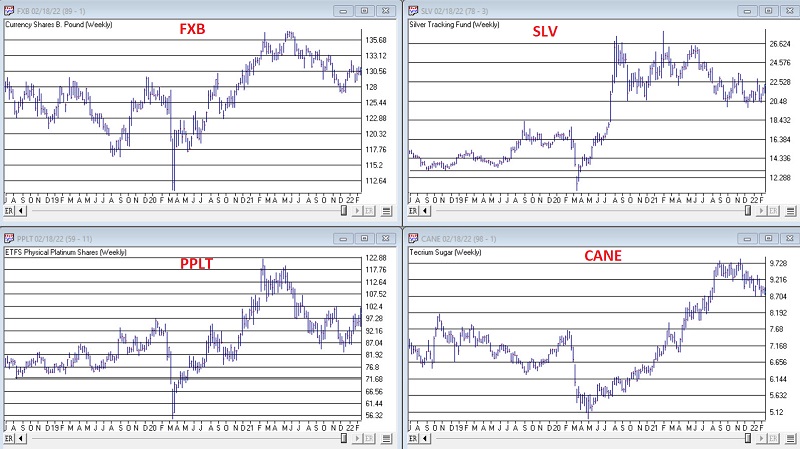
The ETF alternatives are:
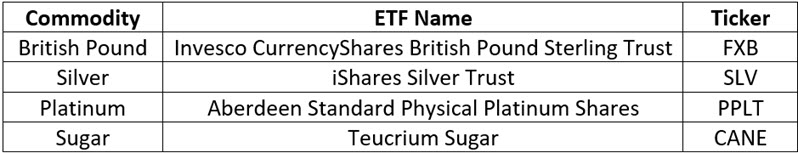
The charts below of the tickers above are courtesy of AIQ TradingExpert.
What the research tells us…
Seasonal trends can be used on a standalone basis for trading. However, they are typically best used as part of a "weight of the evidence" approach to trading. Each of the markets discussed above have demonstrated a tendency to exhibit weakness in the late winter period. On a year-by-year basis, however, there is no guarantee that that tendency will hold true. The bottom line is that traders should be looking for opportunities to play the short side of these markets - especially if there is confirmation in price action.