Will Wheat Wilt?

In a piece last week, I noted that February, March, and April are historically a seasonally favorable period for soybeans. For wheat, it is a different story. Because wheat has an entirely different planting cycle than soybeans and corn, it tends to have its own unique seasonal tendencies.
- A "seasonally unfavorable" period for wheat that we will highlight begins at the close on the second trading day of February and extends for 27 trading days (i.e., we are counting only days during which the exchange is open and wheat is trading, not just calendar days).
Wheat futures trade at the CBOT at a contract size of 5,000. So, if you enter a long position in a wheat futures contract, each $1 rise in the price of wheat will result in a gain of $5,000 and vice versa. The data we are using a continuous futures contract from Bloomberg that attempts to emulate the profit or loss that a trader would experience if holding the front-month contract for Wheat. All results should be considered hypothetical. The purpose here is to highlight the trend and not any specific dollar results.
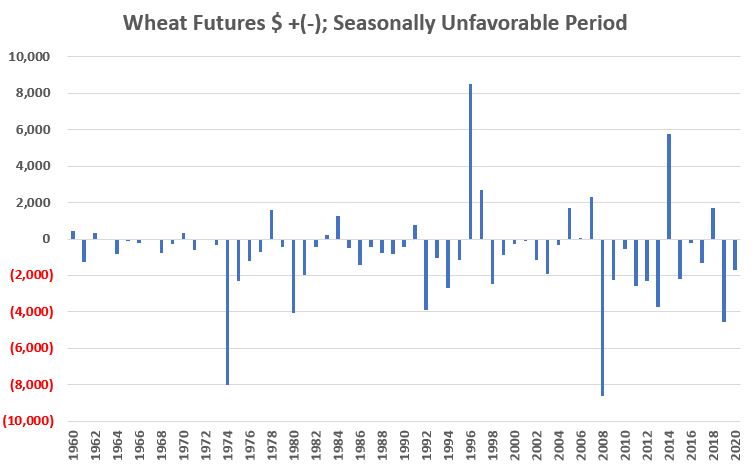
The chart below displays the hypothetical gain or loss achieved by holding long a 1-lot position in a wheat futures contract ONLY during the 27 trading days after the close of the 2nd day of trading in February on a year-by-year basis. It should be noted that there are some years where wheat performs exceptionally well during the supposedly unfavorable period. But even a cursory glance reveals a lot more losing period than winning periods.

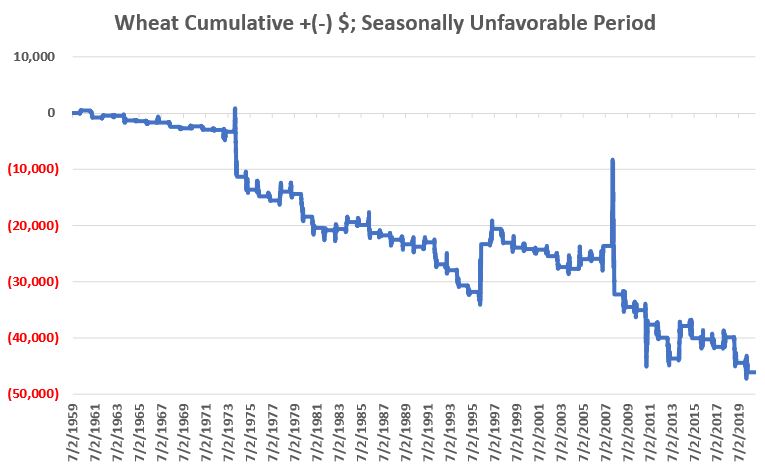
The following chart shows the accumulated profit or loss generated over the years. Again, we can see a couple of rip-roaring counter (seasonal) trend rallies. But the long-term trend is unmistakable.

The table below puts some numbers to the information above.

- The key thing to note from a "trading edge point-of-view" is that wheat declined in price 77% of the time during this period.
- The key thing to note from a "real-world trading" point-of-view is that wheat still advanced almost 1-of-every-four years (23% of the time) AND it once rallied $8,500.
So there should be no illusions of "easy money." Still, for the properly capitalized trader, there are a variety of ways for a trader to use this information.
- Sell short a wheat futures contract and place a stop-loss order as far away as one can stomach
- Simply avoid the long side of the wheat market during this period
- Sell short shares of ticker WEAT, an ETF designed to track wheat futures that started trading in 2011.
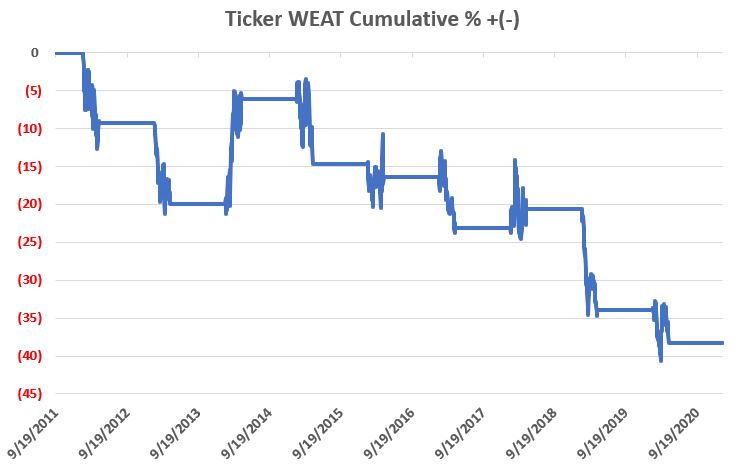
Trading commodity futures has many inherent risks which one should familiarize themselves with before jumping. Likewise, selling short shares of a relatively thinly traded ETF like WEAT exposes a trader to unlimited risk (albeit risk that a stop-loss order to buy might mitigate). The chart below displays the cumulative percent price return achieved by holding shares of WEAT only during the unfavorable seasonal period each year.

So, is wheat destined to decline in price between the 2nd day of February and March 12th (27 trading days later)? Not at all. While this period has witnessed a decline in price 77% of the time in the last 60+ years, it is important to note that there is a big difference between 77% and 100%. Also, given that wheat once gained over +$8,000 during this period is it essential for any trader to understand the importance of:
- Proper capitalization
- Considering a stop-loss order

