
Will correlation be causation for S&P 500 and Nasdaq 100?

Key points:
- Spikes in our S&P 500 Component Correlation indicator tend to occur as bottoms are forming in stocks
- A significant threshold was pierced to the upside in mid-July
- Prior signals preceded two months of chop (ending now), then significant upside
Correlation among S&P 500 stocks spiked during the panic
When stocks were dropping earlier this summer, investors started to panic.
During times of high uncertainty, investors tend to buy or sell "everything" together, no matter their individual merits, so correlation rises. The higher it goes, the more we see groupthink, which tends to happen at times of extreme pessimism, and is thus usually a positive for stocks in the future.
The chart below shows when S&P 500 Component Correlation crossed above 0.66 for the first time in six months. The table displays the performance of the S&P 500 index following those signals.
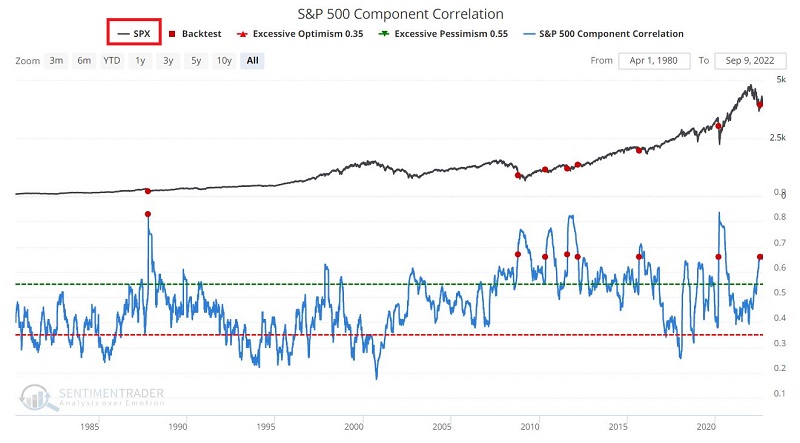
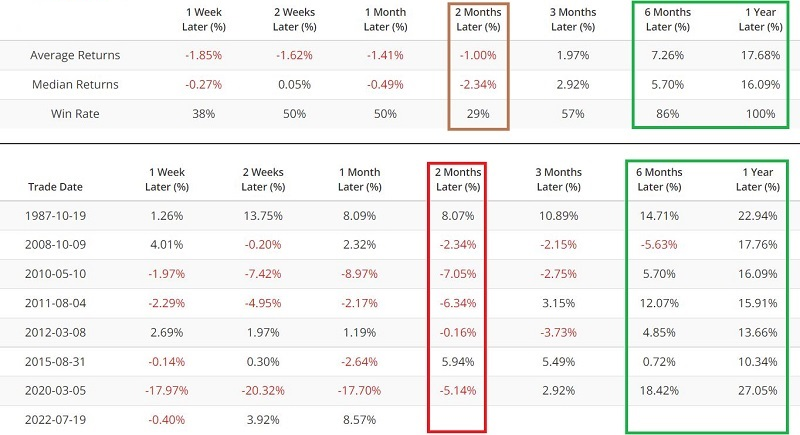
There are two key things to note:
- Performance during the first two months after a signal has been subpar. This signal often occurred as the market attempted to form a significant bottom, involving much volatility and further short, sharp price declines.
- The substantial improvement in the Win Rate for six- and twelve-month returns. An investor would have improved overall results with much less volatility by waiting two months to act on a signal.
The latest signal occurred on July 19. That means that if history proves to be a guide this time, the period between 2022-09-19 and 2023-07-19 could see favorable market activity.
Big tech stocks showed even better returns
Even though we're looking at correlation among S&P 500 stocks, we can use the same signal for other indexes to see how they performed.
If we use the same signals but apply them to the Nasdaq 100 Index (NDX), average returns jump signficiantly.
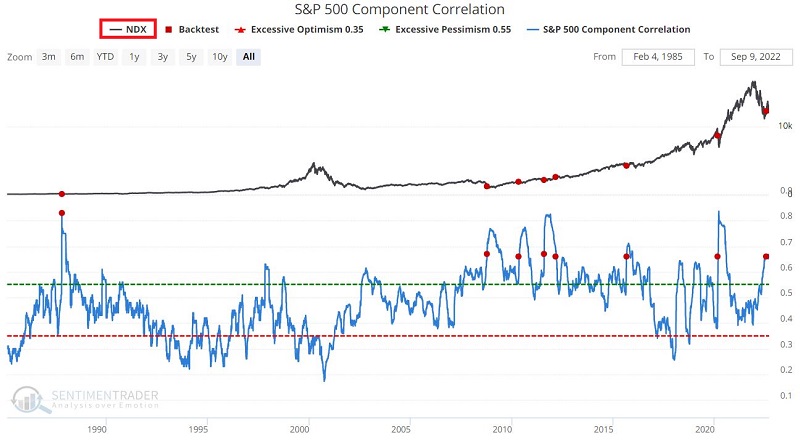
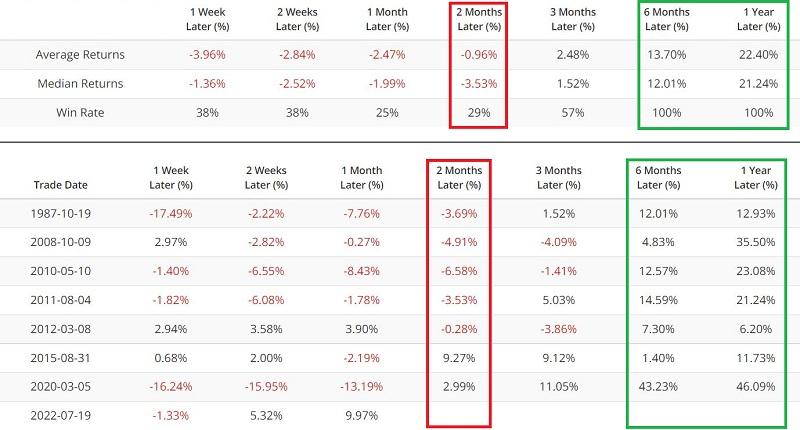
Once again, we see that two months after an initial signal has typically offered a significant buying opportunity with the Nasdaq 100 Index. It tended to lose ground 1-2 months later (though it hasn't this time) and then rally longer-term.
What the research tells us…
Market bottoms tend to be volatile and often messy affairs. Trying to pick the exact bottom has been a fool's errand since the markets began. But recognizing that a bottom may be forming - and giving the market time to complete the process - can allow an investor to get back into the market in a timely manner. The S&P 500 Component Correlation suggests that that time may be near.