Data &
Technology
Research
Reports
Report Solutions
Reports Library
Actionable
Strategies
Free
Resources
Simple Backtest Calculator
Simple Seasonality Calculator
The Kelly Criterion Calculator
Sentiment Geo Map
Public Research Reports
Free Webinar
Pricing
Company
About
Meet Our Team
In the News
Testimonials
Client Success Stories
Contact
Log inLoginSign up
< BACK TO ALL REPORTS

Why this year is putting a nail in technical analysis

Jason Goepfert
2021-04-28
This year has shaped up to be one of the worst ever for technical trading strategies as defined by Bloomberg.

There has never been a worse time to be a technician.

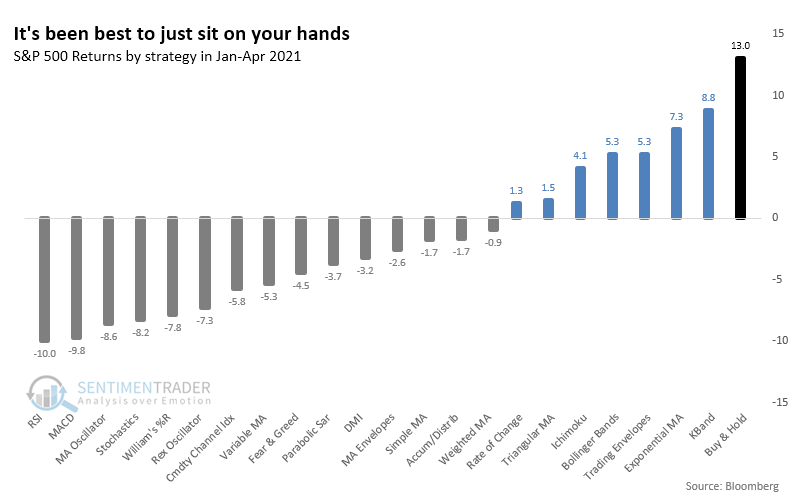
Out of 22 technical trading strategies followed by Bloomberg, only 7 have shown a profit in 2021. That's among the fewest in 25 years.

As Bloomberg notes:

"It's testament to the straight-up trajectory of stocks that virtually all signals that told investors to do anything but buy have done them a disservice this year. In fact, when applied to the S&P 500, 15 of 22 chart-based indicators tracked by Bloomberg have actually lost money..."

Granted, there is no wiggle room for interpretation here. Backtests require rules, and the rules use default settings. That doesn't allow for optimization or experience.

Backtests might show that using the Relative Strength Index (RSI) was a money-loser this year - indeed, it was the worst indicator - but in the hands of an experienced technician, it could have been wonderfully useful. And adjusting the length of some moving average strategies could have had a trader invested all year as momentum ruled, instead of being whipsawed on shorter-term moves.

The list of strategies shows how few have shown a positive return, with none beating buy-and-hold.

Bloomberg technical analysis signals

Going back as far as we can using daily backtesting data, this year is among the worst for using technical trading strategies through April. 

Out of the 7 years since 1997 that saw the fewest number of successful technical trading signals, 4 of them showed a negative return either 2 or 3 months later, and 2 of the others sported only meager or temporary gains.

Stat Box

Never short a dull market? Stocks have gone nowhere for 2 days, on exceedingly low volume, while hitting new highs in the process. Of the 20 non-holiday times this setup has triggered in the S&P 500 fund, SPY, it was higher a month later 80% of the time.


What else we're looking at

  • More details on years with few (and many) successful technical trading strategies
  • What happens when technical strategies underperform by 10% or more
  • What the copper / gold ratio is telling us about the future of bond prices
  • A look at global leading economic indicators and what their makeup says about stocks
DATA &
TECHnologies
IndicatorEdge
‍
BackTestEdge
‍
Other Tools
‍
DataEdge API
RESEARCH
reports
Research Solution
‍
Reports Library
‍
actionable
Strategies
Trading Strategies
‍
Smart Stock Scanner
‍
FREE
RESOUrCES
Simple Backtest
Calculator
Simple Seasonality
Calculator
The Kelly Criterion
Calculator
Sentiment Geo Map
‍
Public Research Reports
‍
Free Webinar
COMPANY
‍
About
‍
Meet our Team
‍
In the News
‍
Testimonials
‍
Client Success Stories
Pricing
Bundle pricing
‍
Announcements
‍
FAQ
© 2024 Sundial Capital Research Inc. All rights reserved.
Setsail Marketing
TermsPrivacyAffiliate Program
Risk Disclosure: Futures and forex trading contains substantial risk and is not for every investor. An investor could potentially lose all or more than the initial investment. Risk capital is money that can be lost without jeopardizing ones’ financial security or life style. Only risk capital should be used for trading and only those with sufficient risk capital should consider trading. Past performance is not necessarily indicative of future results.

Hypothetical Performance Disclosure: Hypothetical performance results have many inherent limitations, some of which are described below. No representation is being made that any account will or is likely to achieve profits or losses similar to those shown; in fact, there are frequently sharp differences between hypothetical performance results and the actual results subsequently achieved by any particular trading program. One of the limitations of hypothetical performance results is that they are generally prepared with the benefit of hindsight. In addition, hypothetical trading does not involve financial risk, and no hypothetical trading record can completely account for the impact of financial risk of actual trading. for example, the ability to withstand losses or to adhere to a particular trading program in spite of trading losses are material points which can also adversely affect actual trading results. There are numerous other factors related to the markets in general or to the implementation of any specific trading program which cannot be fully accounted for in the preparation of hypothetical performance results and all which can adversely affect trading results.

Testimonial Disclosure: Testimonials appearing on this website may not be representative of other clients or customers and is not a guarantee of future performance or success.