
Why the VIX may soon trough

Key points:
- The seasonal pattern for the VIX "fear gauge" has often shown troughs about now
- Years similar to 2023 for the VIX have also troughed around now, with higher volatility into the fall
- Other six-month periods that look similar to the past six months have also tended to see rising volatility
Patterns similar to this year for the VIX have preceded spikes in volatility
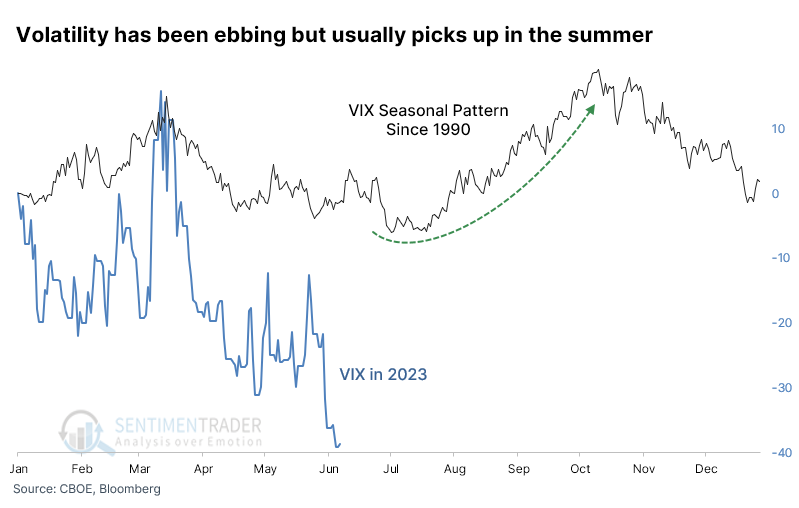
Those counting on a volatile 2023 have been disappointed as traders have continually priced in lower and lower expected volatility in the S&P 500 this year. If it follows anything like its usual seasonal pattern, though, volatility may be about to pick up.
According to Bloomberg calculations, the annual seasonal pattern in the VIX "fear gauge" since 1990 has been pretty close to what we've witnessed this year, though this year has been more exaggerated. The VIX has typically troughed between now and early July, rising into October.
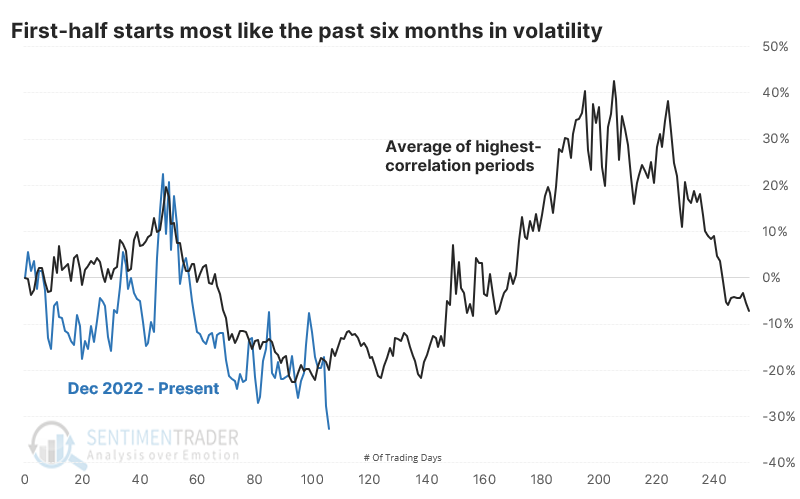
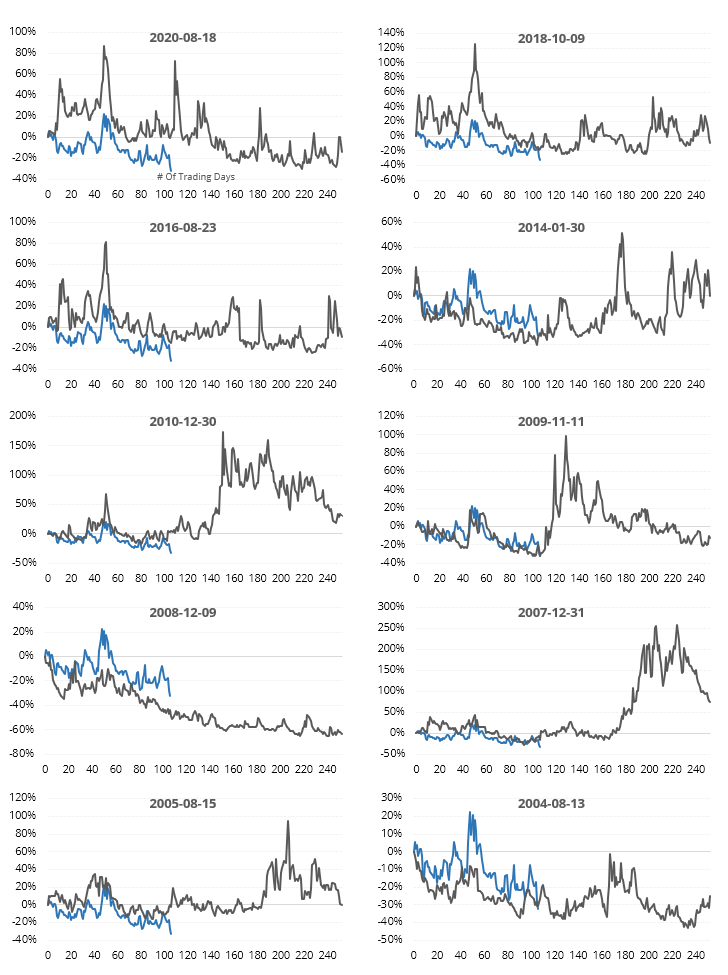
The six months to start this year have mainly shown a trend toward lower implied volatility, and there aren't too many years that have followed a similar pattern closely. The chart below shows an average of those half-dozen years, all with a correlation above +0.50 (on a scale of -1.0 to +1.0) to what the VIX has done in 2023. On average, volatility formed a yearly low sometime around now.
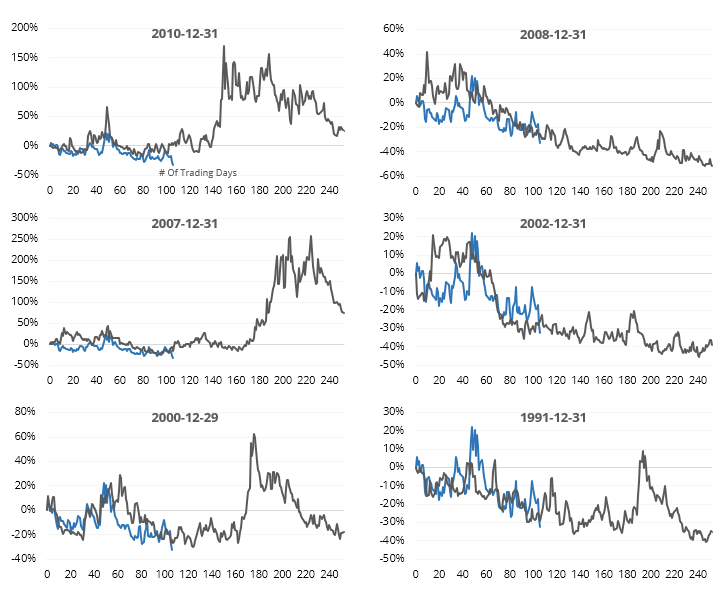
The thumbnails below show the individual years.
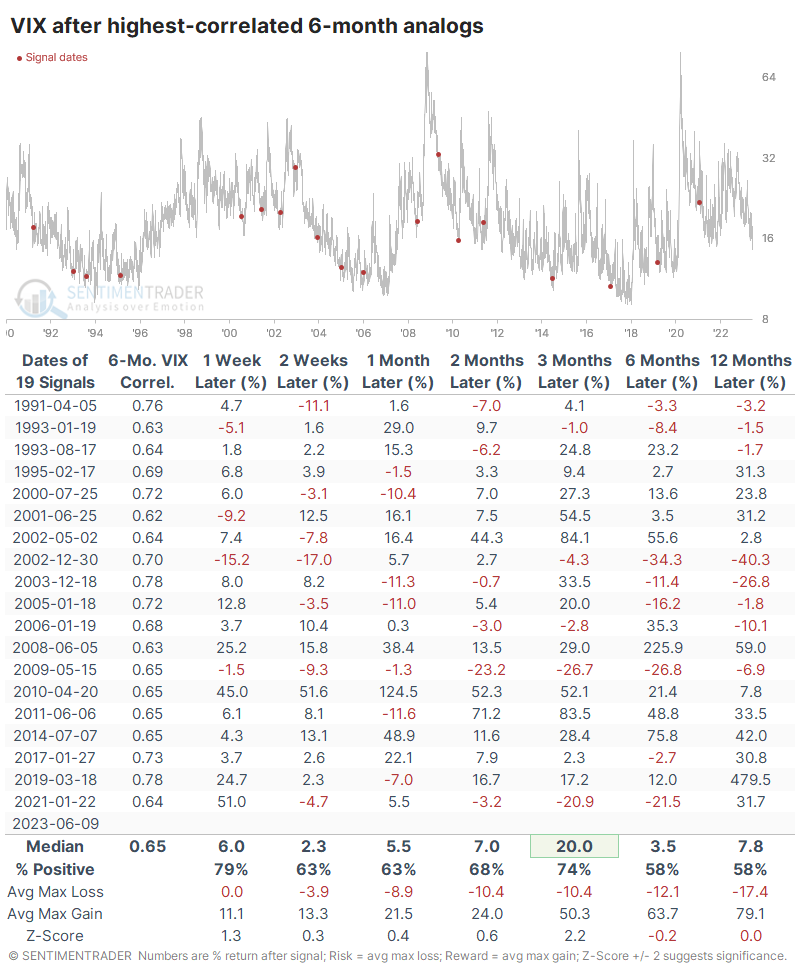
To generate a broader sample size, let's remove the seasonal aspect. Then we get 20 precedents since 1990 when the VIX performed as it has over the past six months. All of these 6-month periods showed a correlation greater than +0.60. Once again, volatility tended to trough right about now.
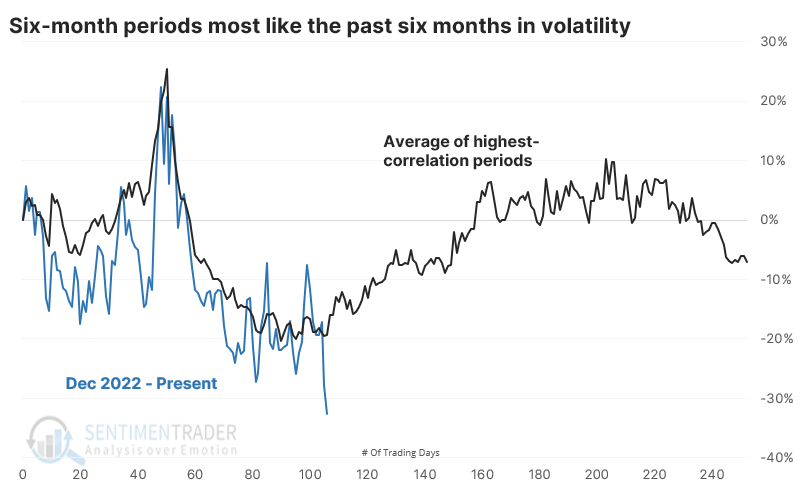
The most recent ten precedents are shown in the thumbnails below.
Looking at returns in the VIX following these analogs, the most consistent time frame to see a VIX spike was over the next three months. On average, the VIX jumped by more than half at some point.
Stocks have struggled a bit, except for defensive ones
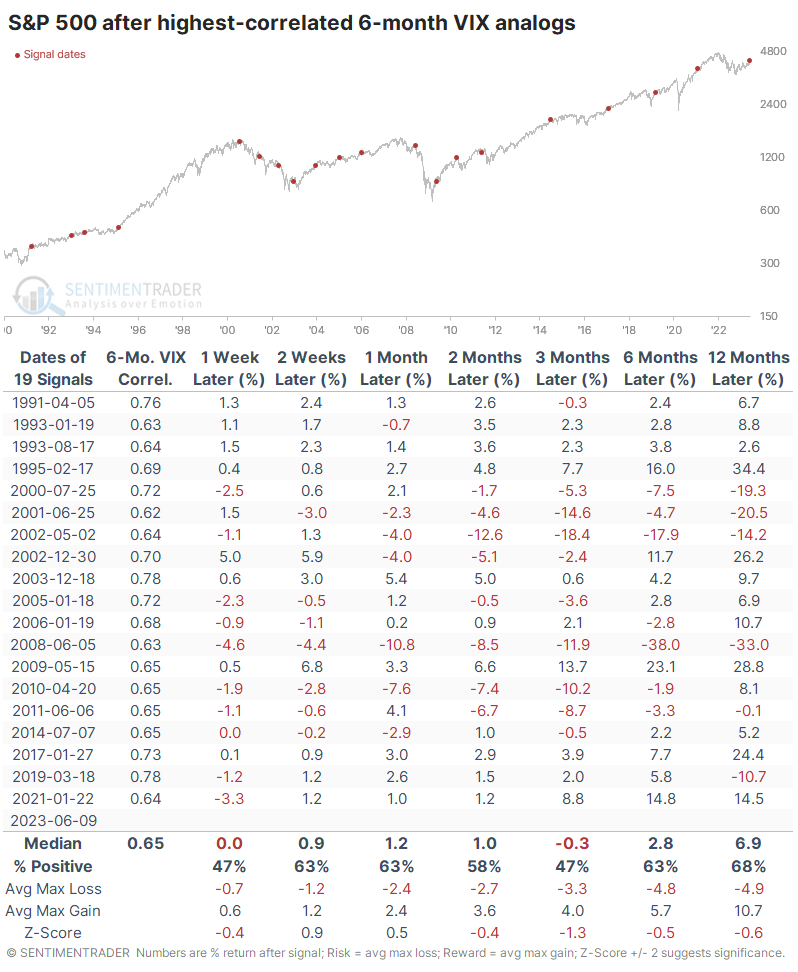
Just because the VIX rises doesn't mean stocks fall, but that was usually the case. The S&P 500 sported poor returns over the next few months. Only one year showed a double-digit gain three months later, while four years suffered a double-digit loss. It wasn't a total wipeout in general, and using it as a signal to sell stocks was hit-and-miss, at best.
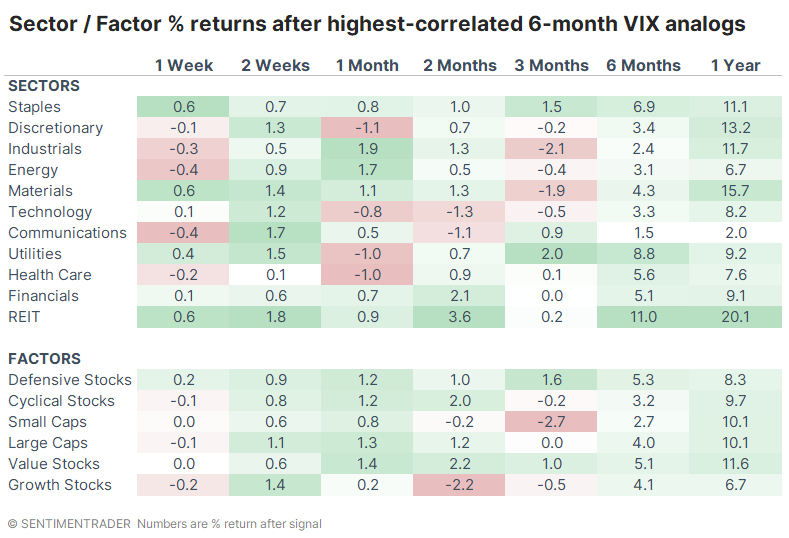
Not surprisingly, defensive sectors tended to hold up the best during these periods. Consumer Staples and Utilities showed the most robust three-month returns, with Small Caps and Growth stocks having trouble.
What the research tells us...
Traders tend to use forecasts of the VIX to trade the S&P because the latter is a lot easier to trade. The trouble with that approach is that there isn't a one-for-one correlation between the two. Volatility expectations can rise along with stocks or fall together (though that's rarer). The way the VIX has behaved so far this year, and over the past six months generally, has typically resulted in traders pricing in higher volatility in the months ahead. There isn't a simple and consistent way to trade that, as VIX trading vehicles are imperfect. It may be enough to consider it a very mild warning sign for stocks, with a reduced likelihood of significant gains and an increased likelihood of a larger pullback and favor a tilt to more defensive sectors.