
Why the average S&P 500 stock deserves a second look

Key points:
- In December, the equal-weight S&P 500 underperformed the capitalization-weight version by nearly -4%
- That was one of the worst monthly relative losses for the average stock since 1957
- After other bad (relative) months and after long streaks without meaningful new highs, the equal-weight S&P tended to rise
Another terrible month for the average stock
Another month, another depressing drop for the average stockholder. At least compared to his neighbor, who had taken Warren Buffett's advice to invest in the S&P 500.
For the typical person, investing in the S&P 500 would mean buying the SPY fund, the world's largest and most liquid ETF. According to VettaFi, the next-largest funds are IVV and VOO, which also track the S&P 500. Together, the three funds have around $2 trillion in assets under management, so it's safe to say many investors have taken Uncle Warren's advice and done phenomenally well. Good on them.
That money tracks the capitalization-weighted S&P 500 index, which basically everyone means by "the S&P 500." We all know that some of the largest tech stocks in the index have dominated its returns, so the average stock within the index is somewhat forgotten. And for the most part, that's been a boon for most investors because the average stock hasn't been doing all that well.
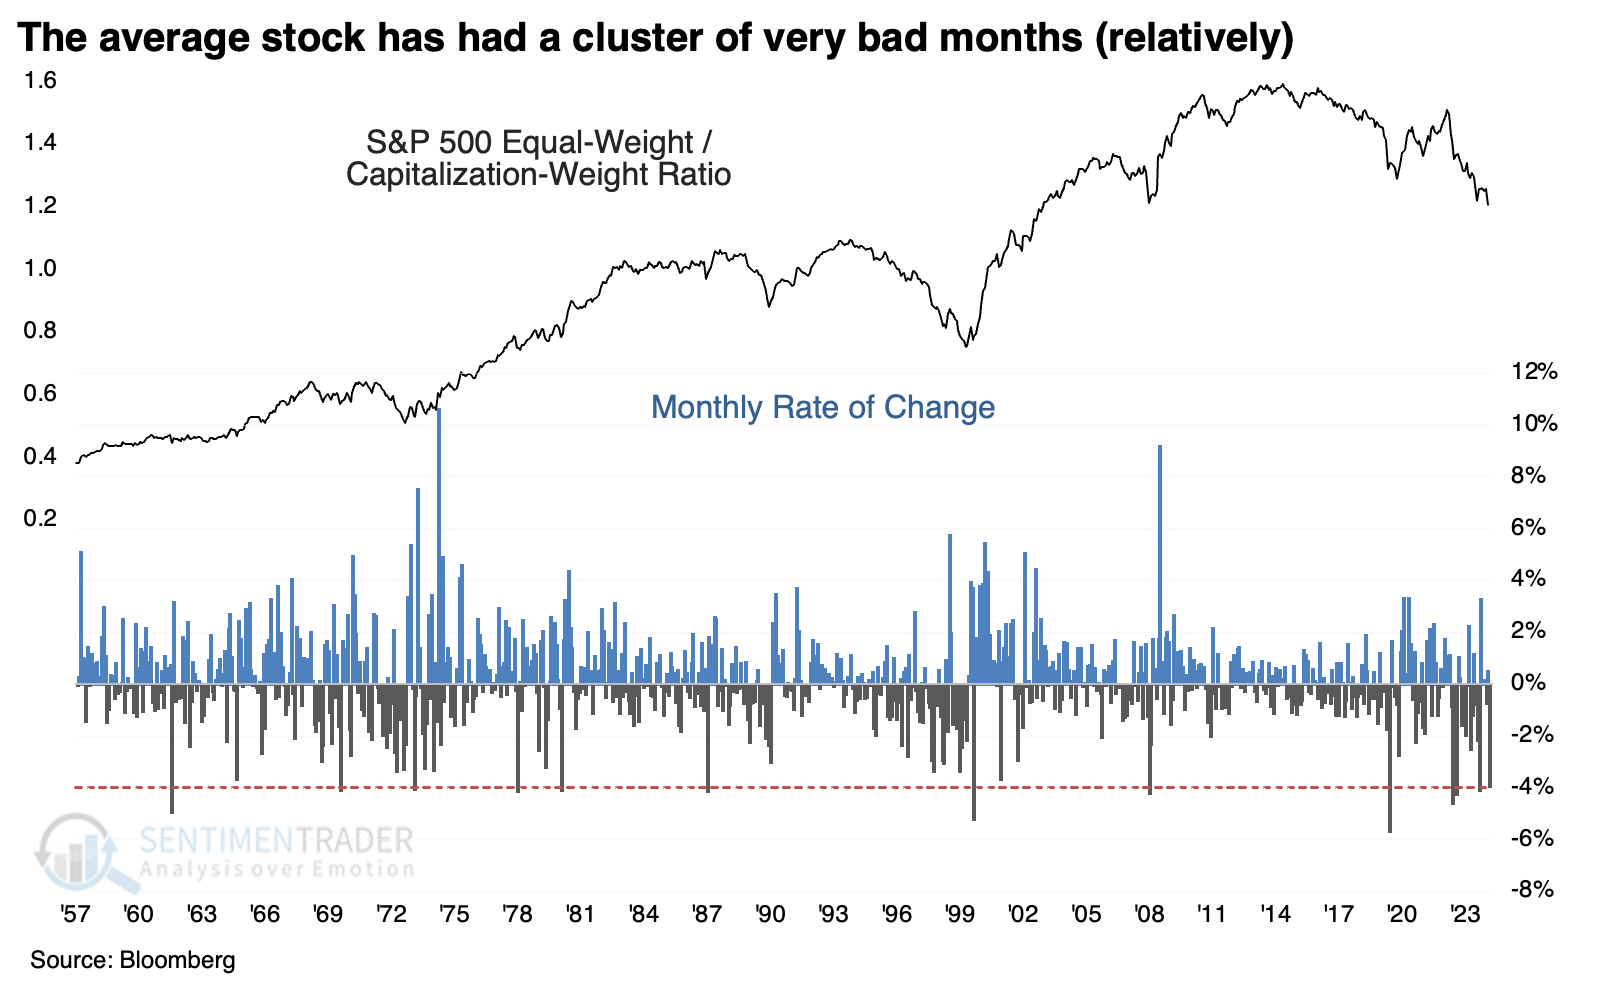
In December alone, the equal-weight version of the S&P 500, which weights every stock the same, trailed the popular capitalization-weight version by nearly 4%, one of the worst relative showings since 1957. There has been a cluster of those months in recent years.
Mean reversion response
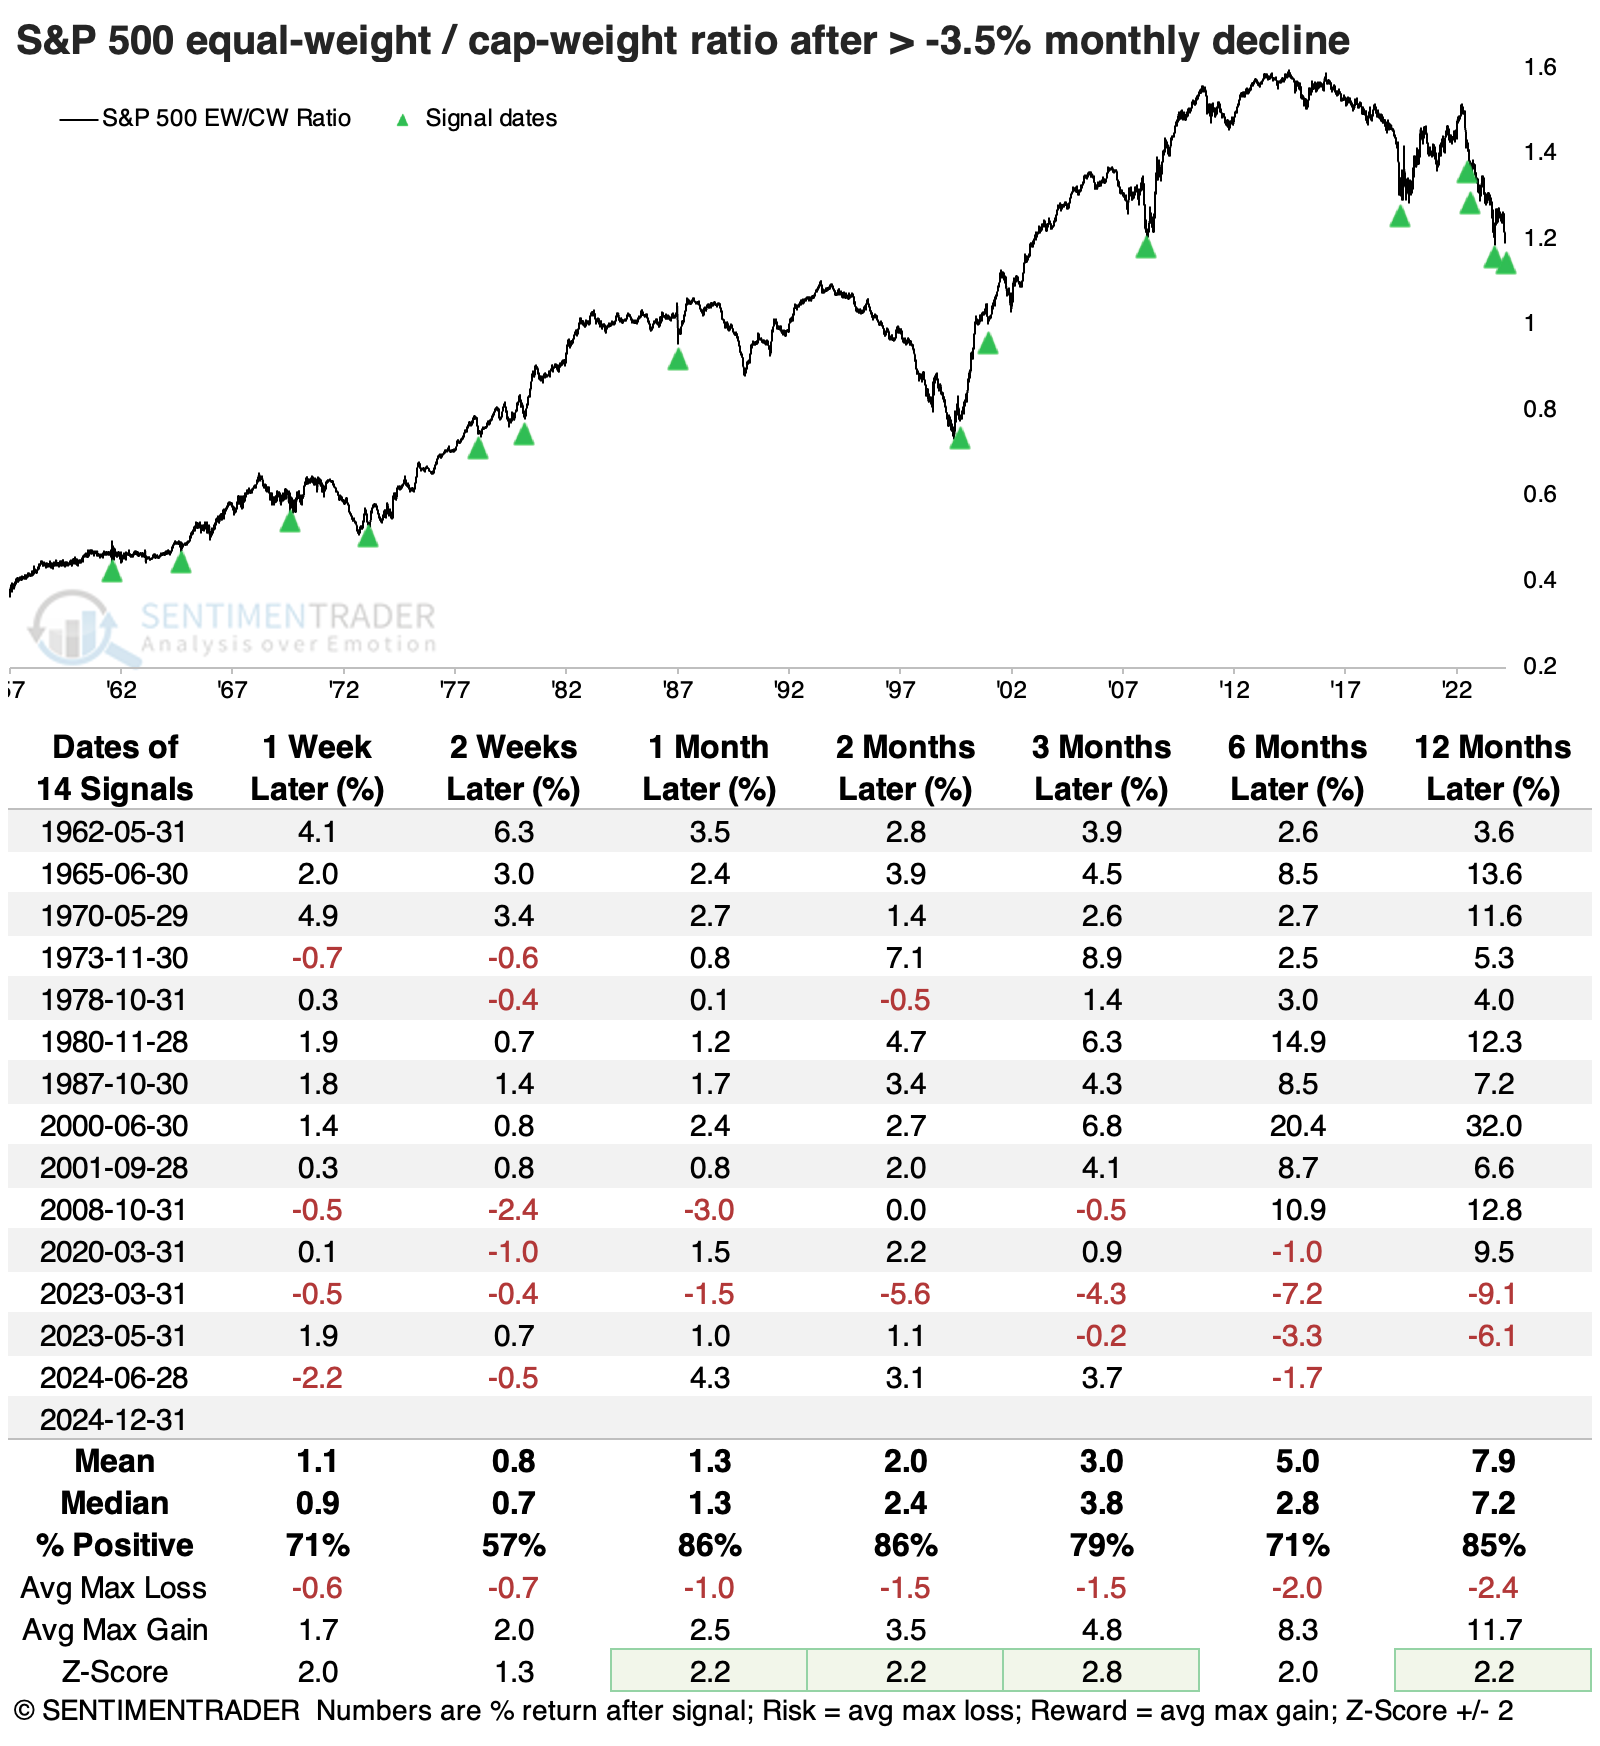
The table below shows how the two versions of the S&P performed relative to each other after large monthly declines in the equal-weight versus cap-weight ratio. For a while now, it has been tempting to assume that the average stock will make a comeback versus the top-heavy version of the index, and these big monthly declines add to that temptation.
Across all time frames, the equal-weight version of the index outperformed the cap-weight version, with particularly good (relative) returns over the next 1-2 months and again after 12 months. The only two losses a year later were the last two signals from the spring of 2023.
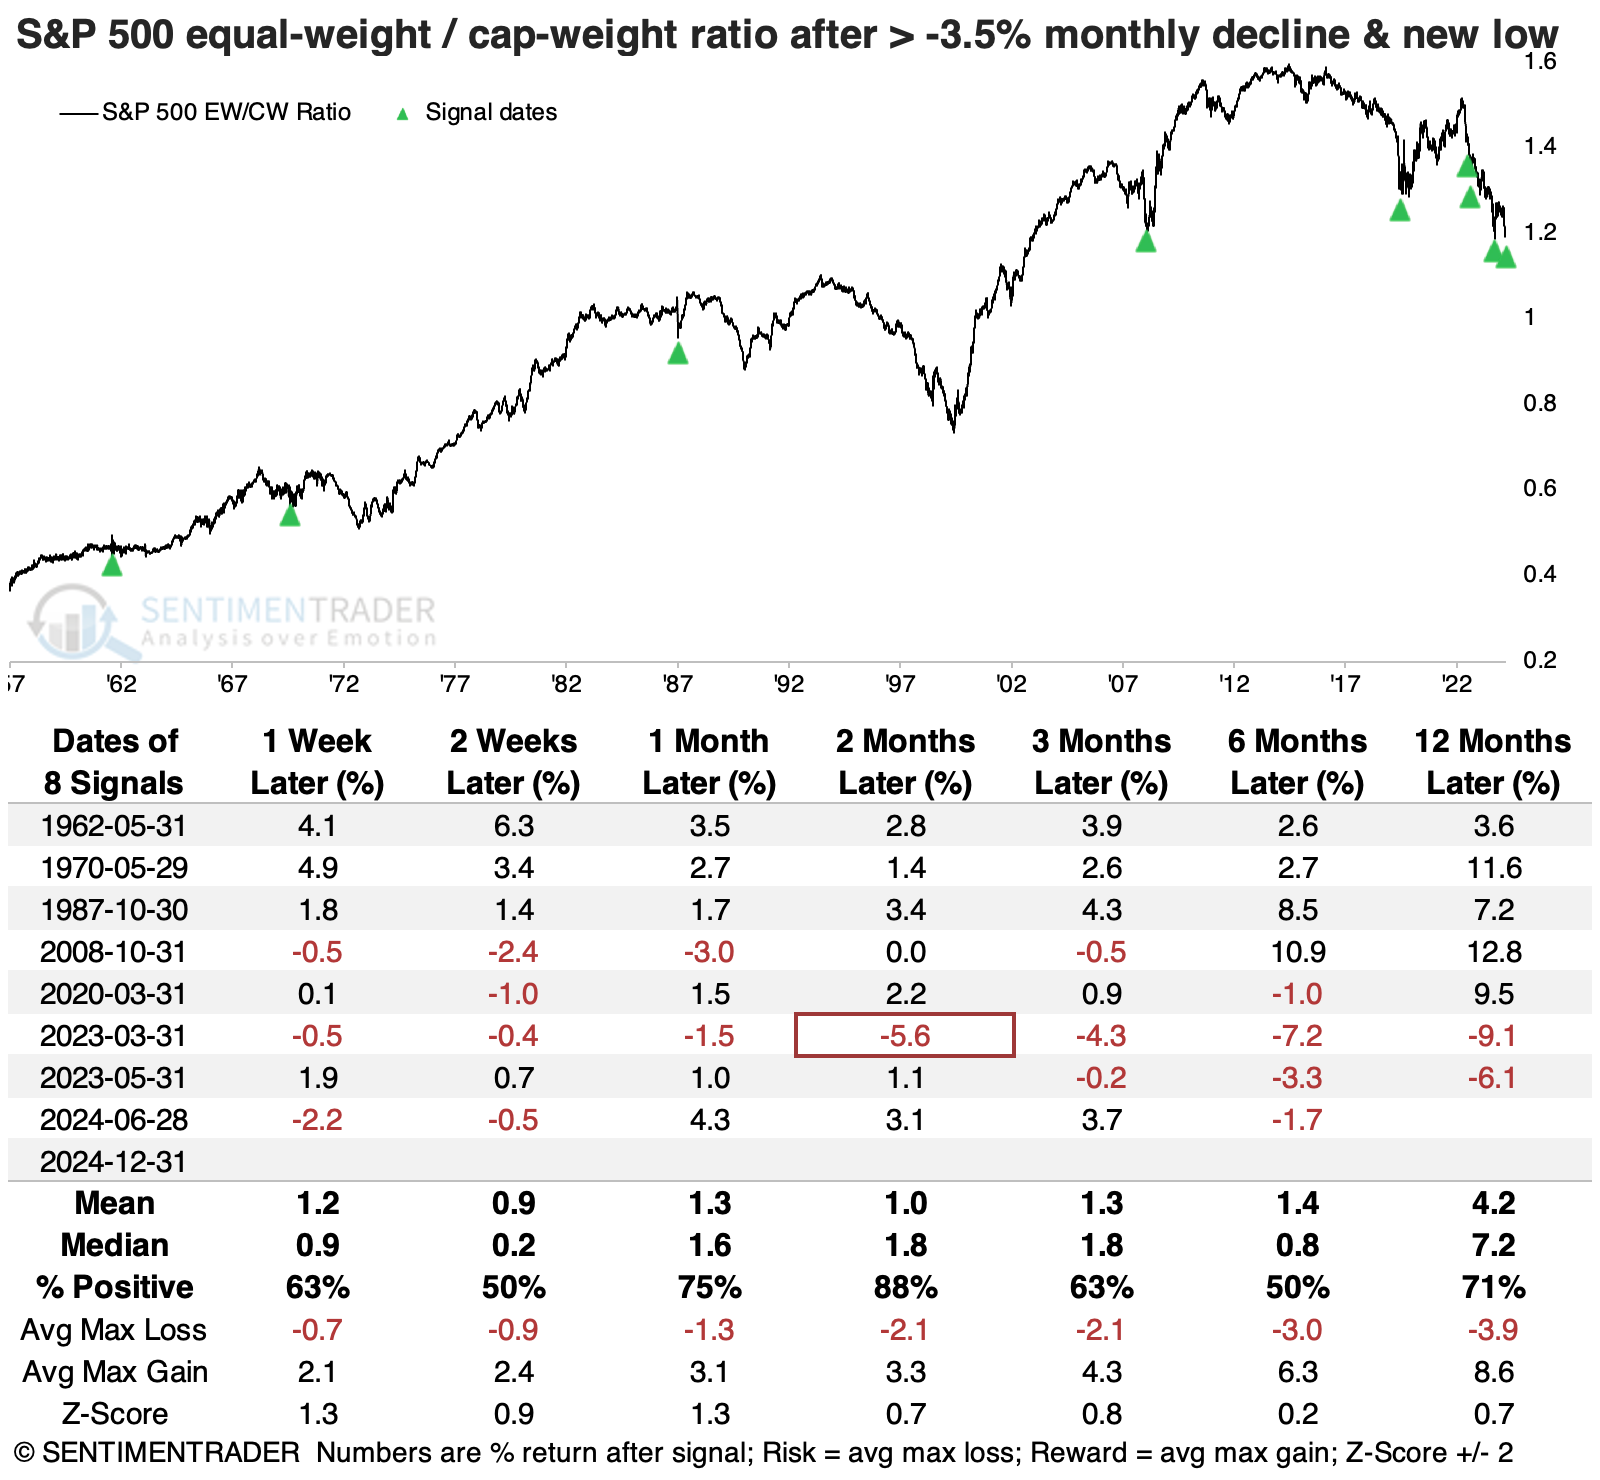
Not only did the ratio suffer one of its largest declines in 65 years, but it also fell to its lowest level in more than a year. The table below further filters the large monthly declines to those that also fell to a new low, many of which have been concentrated in recent years. Only the March 2023 signal suffered a further loss over the next two months, but again, the recent signals have been frustrating for those looking for mean reversion.
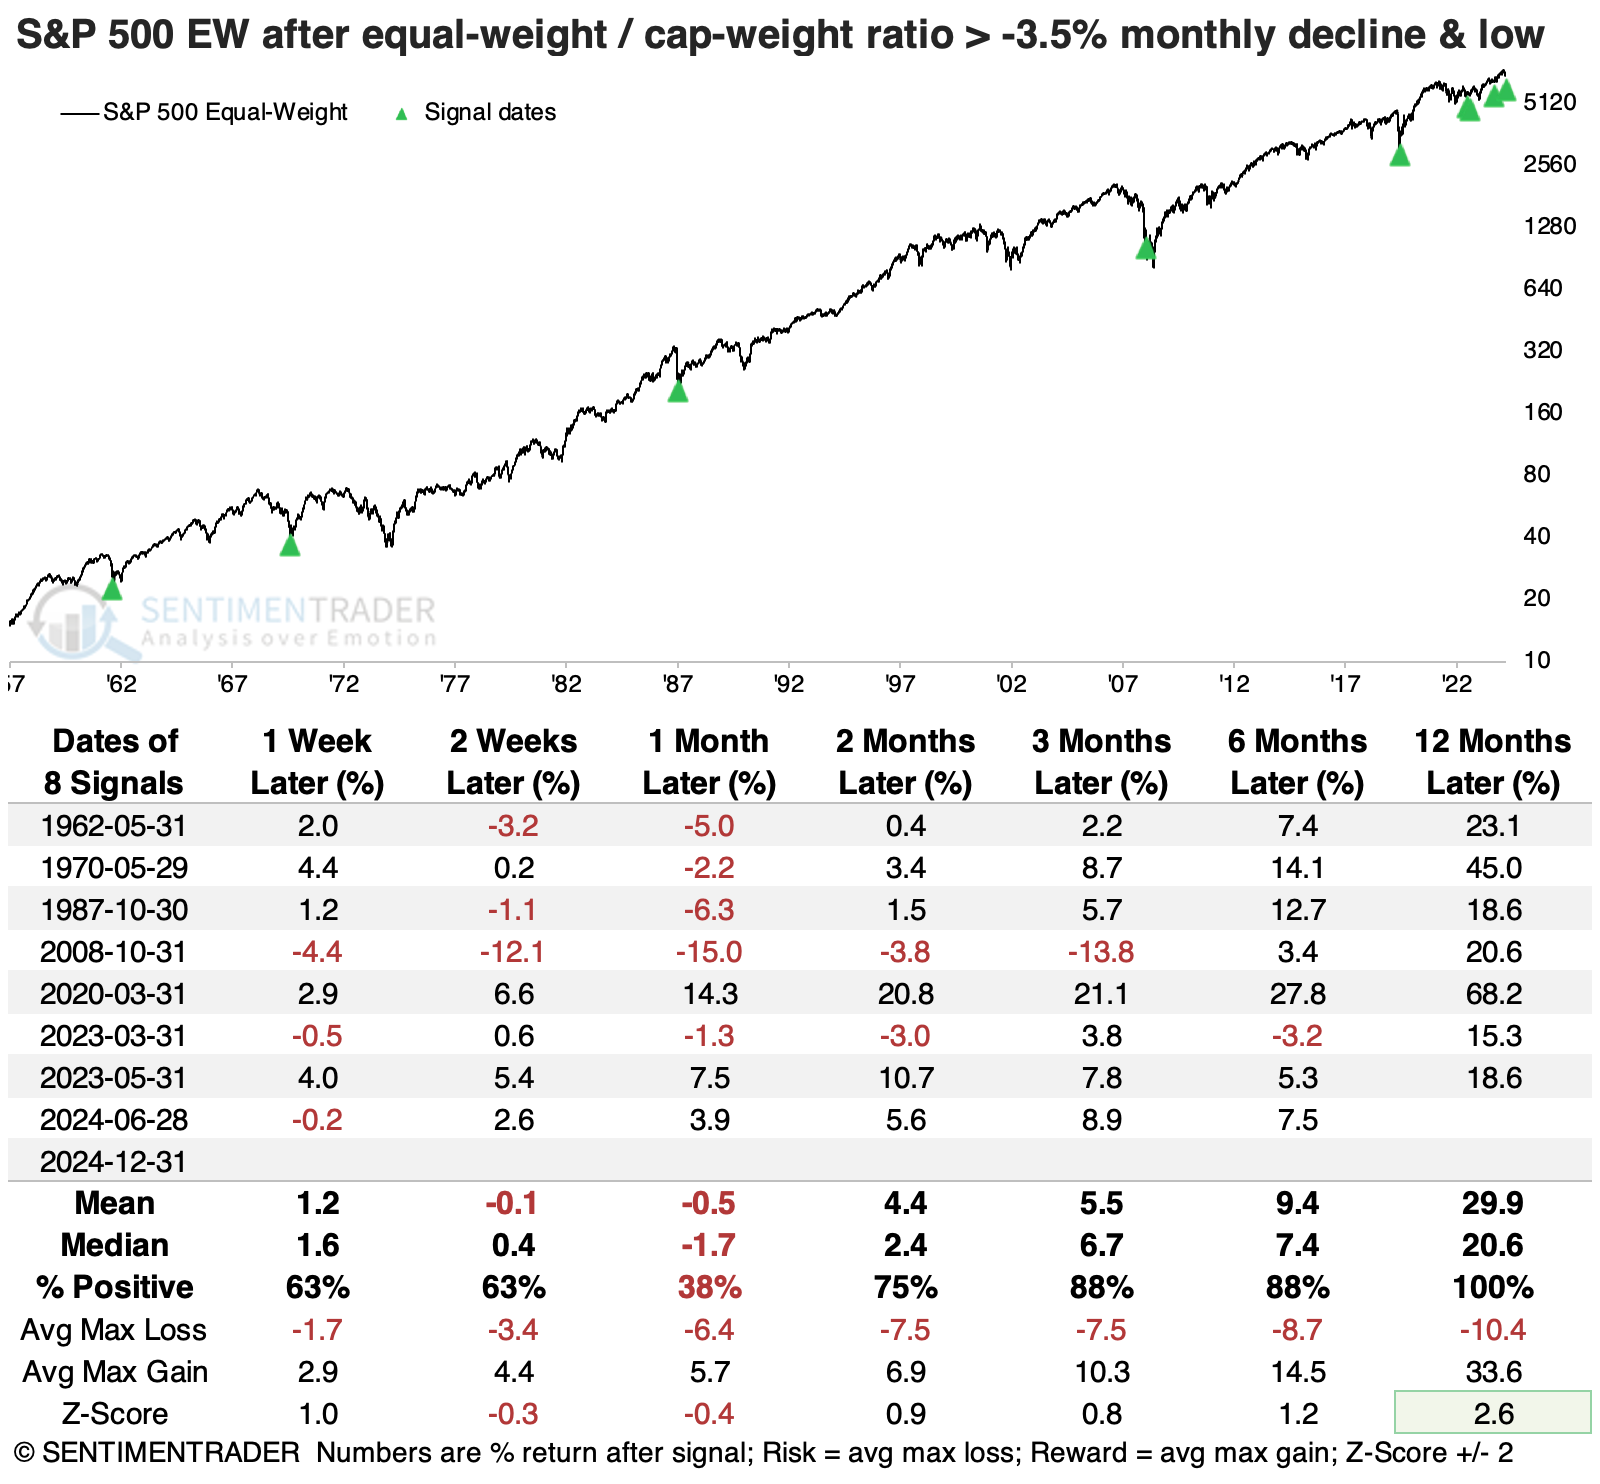
The table below shows the absolute returns in the equal-weight S&P 500 index after those signals. Some losses were scattered among the time frames, especially over the following month. But a year later, the equal-weight S&P showed a double-digit gain every time, averaging more than +20%.
A relatively rare "not winning" streak
As further proof of how much the average stock has lagged, we have gone ten consecutive sessions with no more than 1% of S&P 500 stocks hitting a 52-week high. That may not seem like much, but it's only the 12th time since the financial crisis, most of the others triggering during deeper pullbacks in the widely-watched S&P 500.
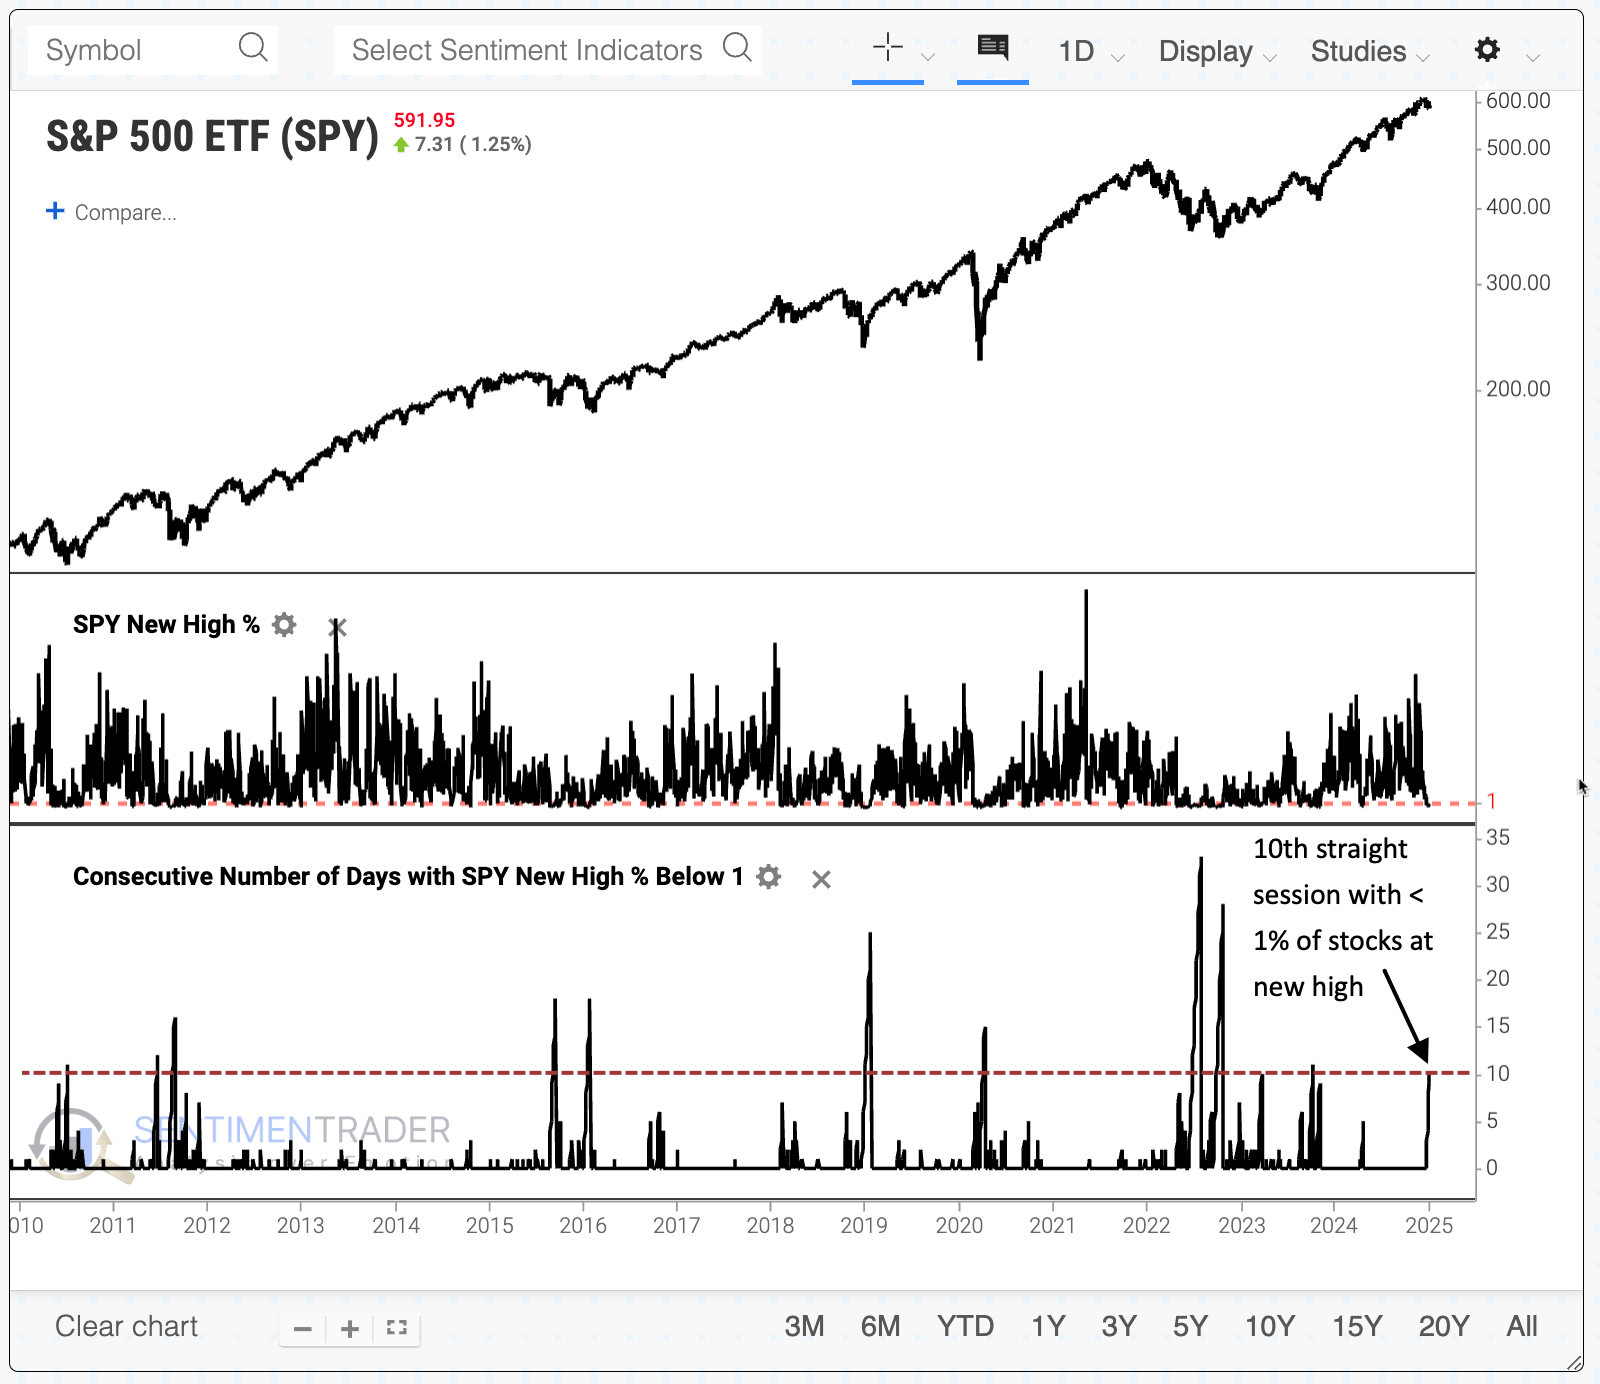
While it's not particularly rare to see a streak of ten sessions without more than 1% of stocks hitting a new high, it is uncommon to see it during protracted uptrends.
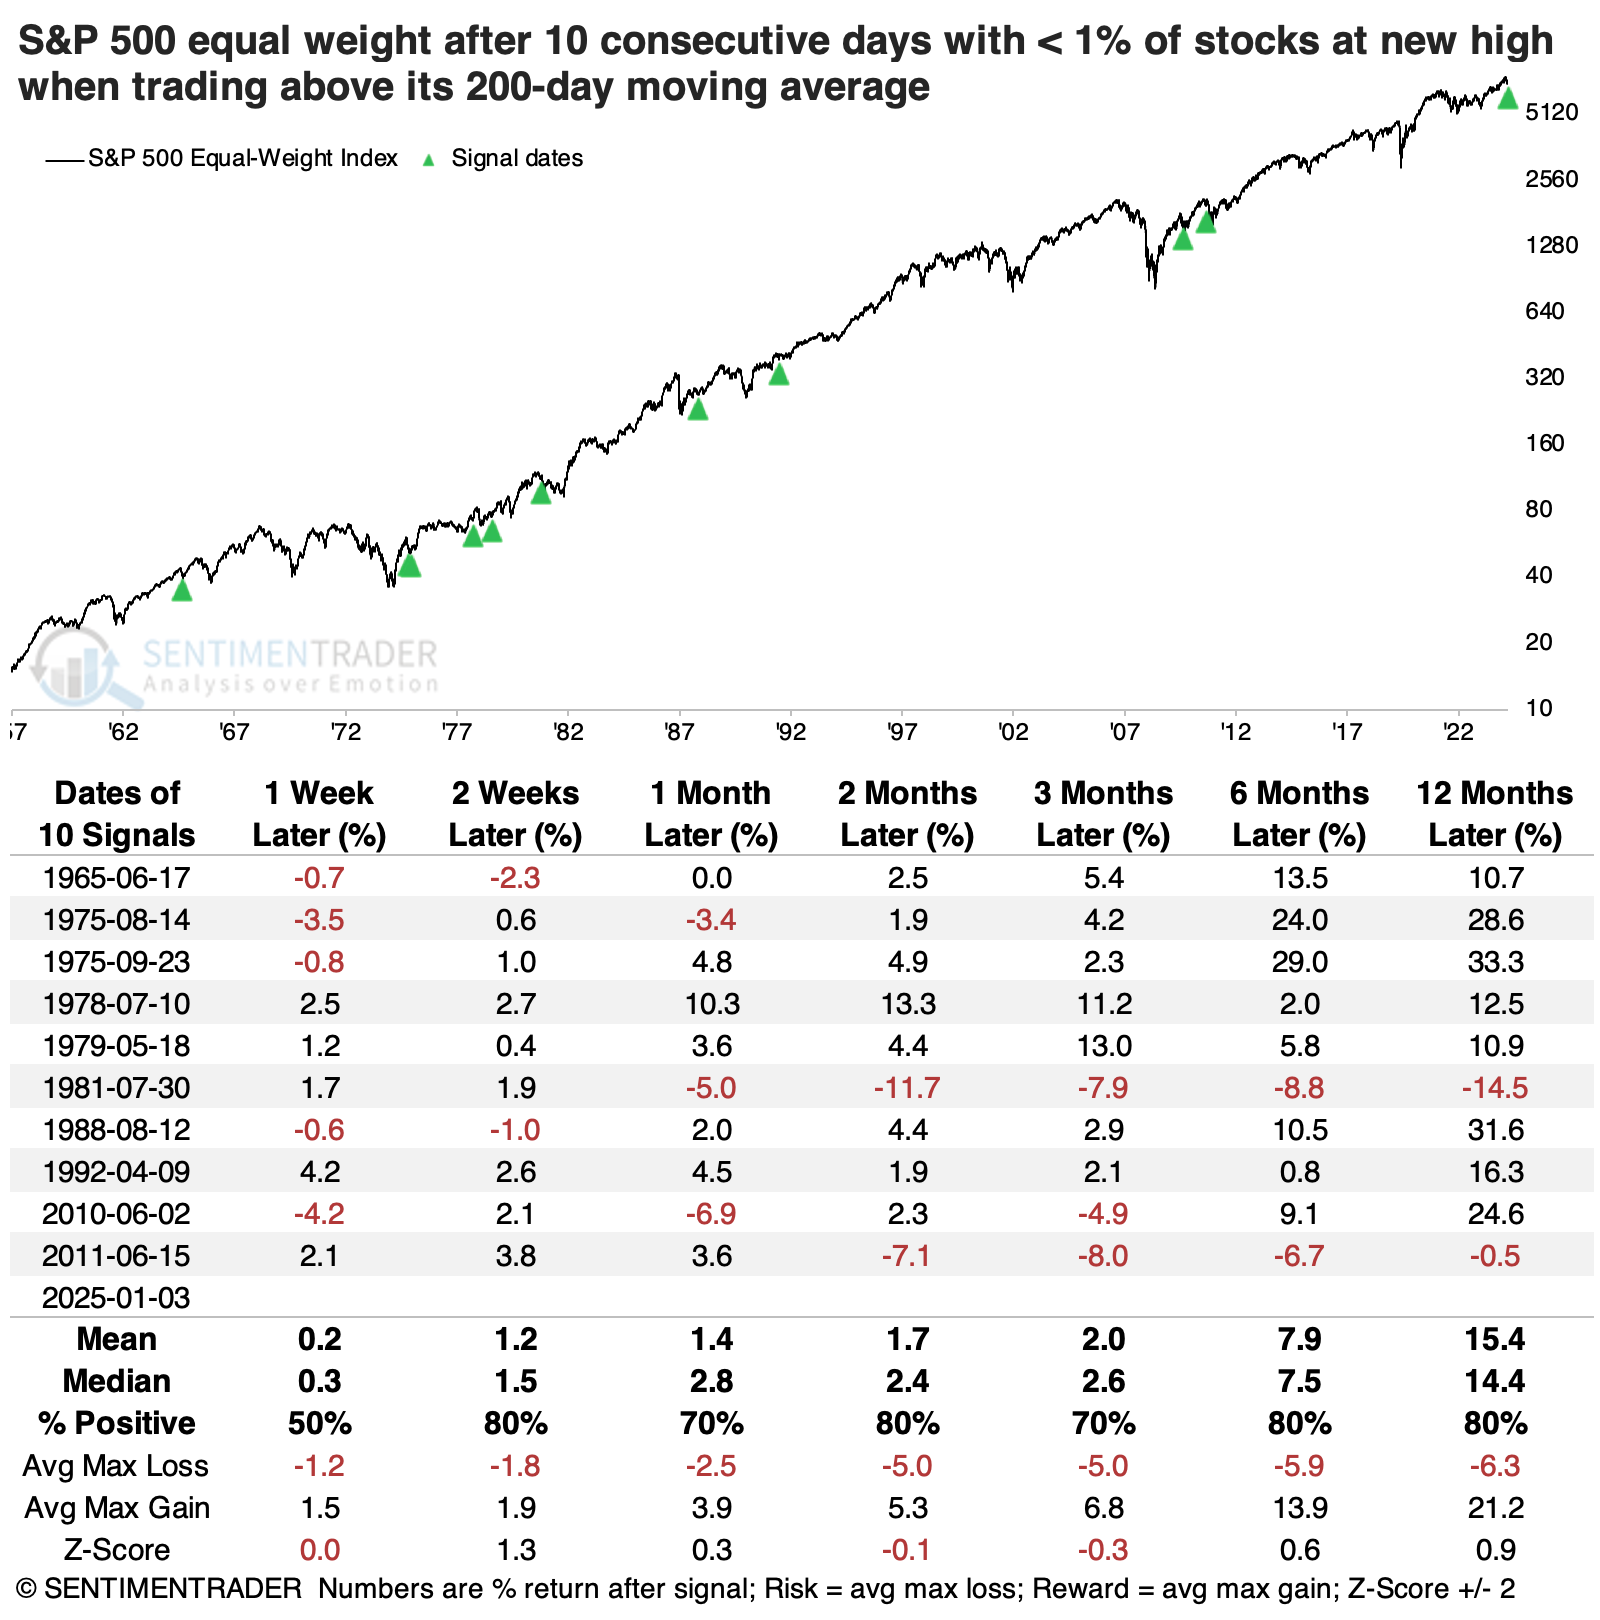
There were only ten other times we'd seen a streak like this when the equal-weight S&P 500 was trading above its 200-day moving average. Afterward, the index tended to rebound nicely, with the only meaningful and extended decline occurring after the July 1981 signal.
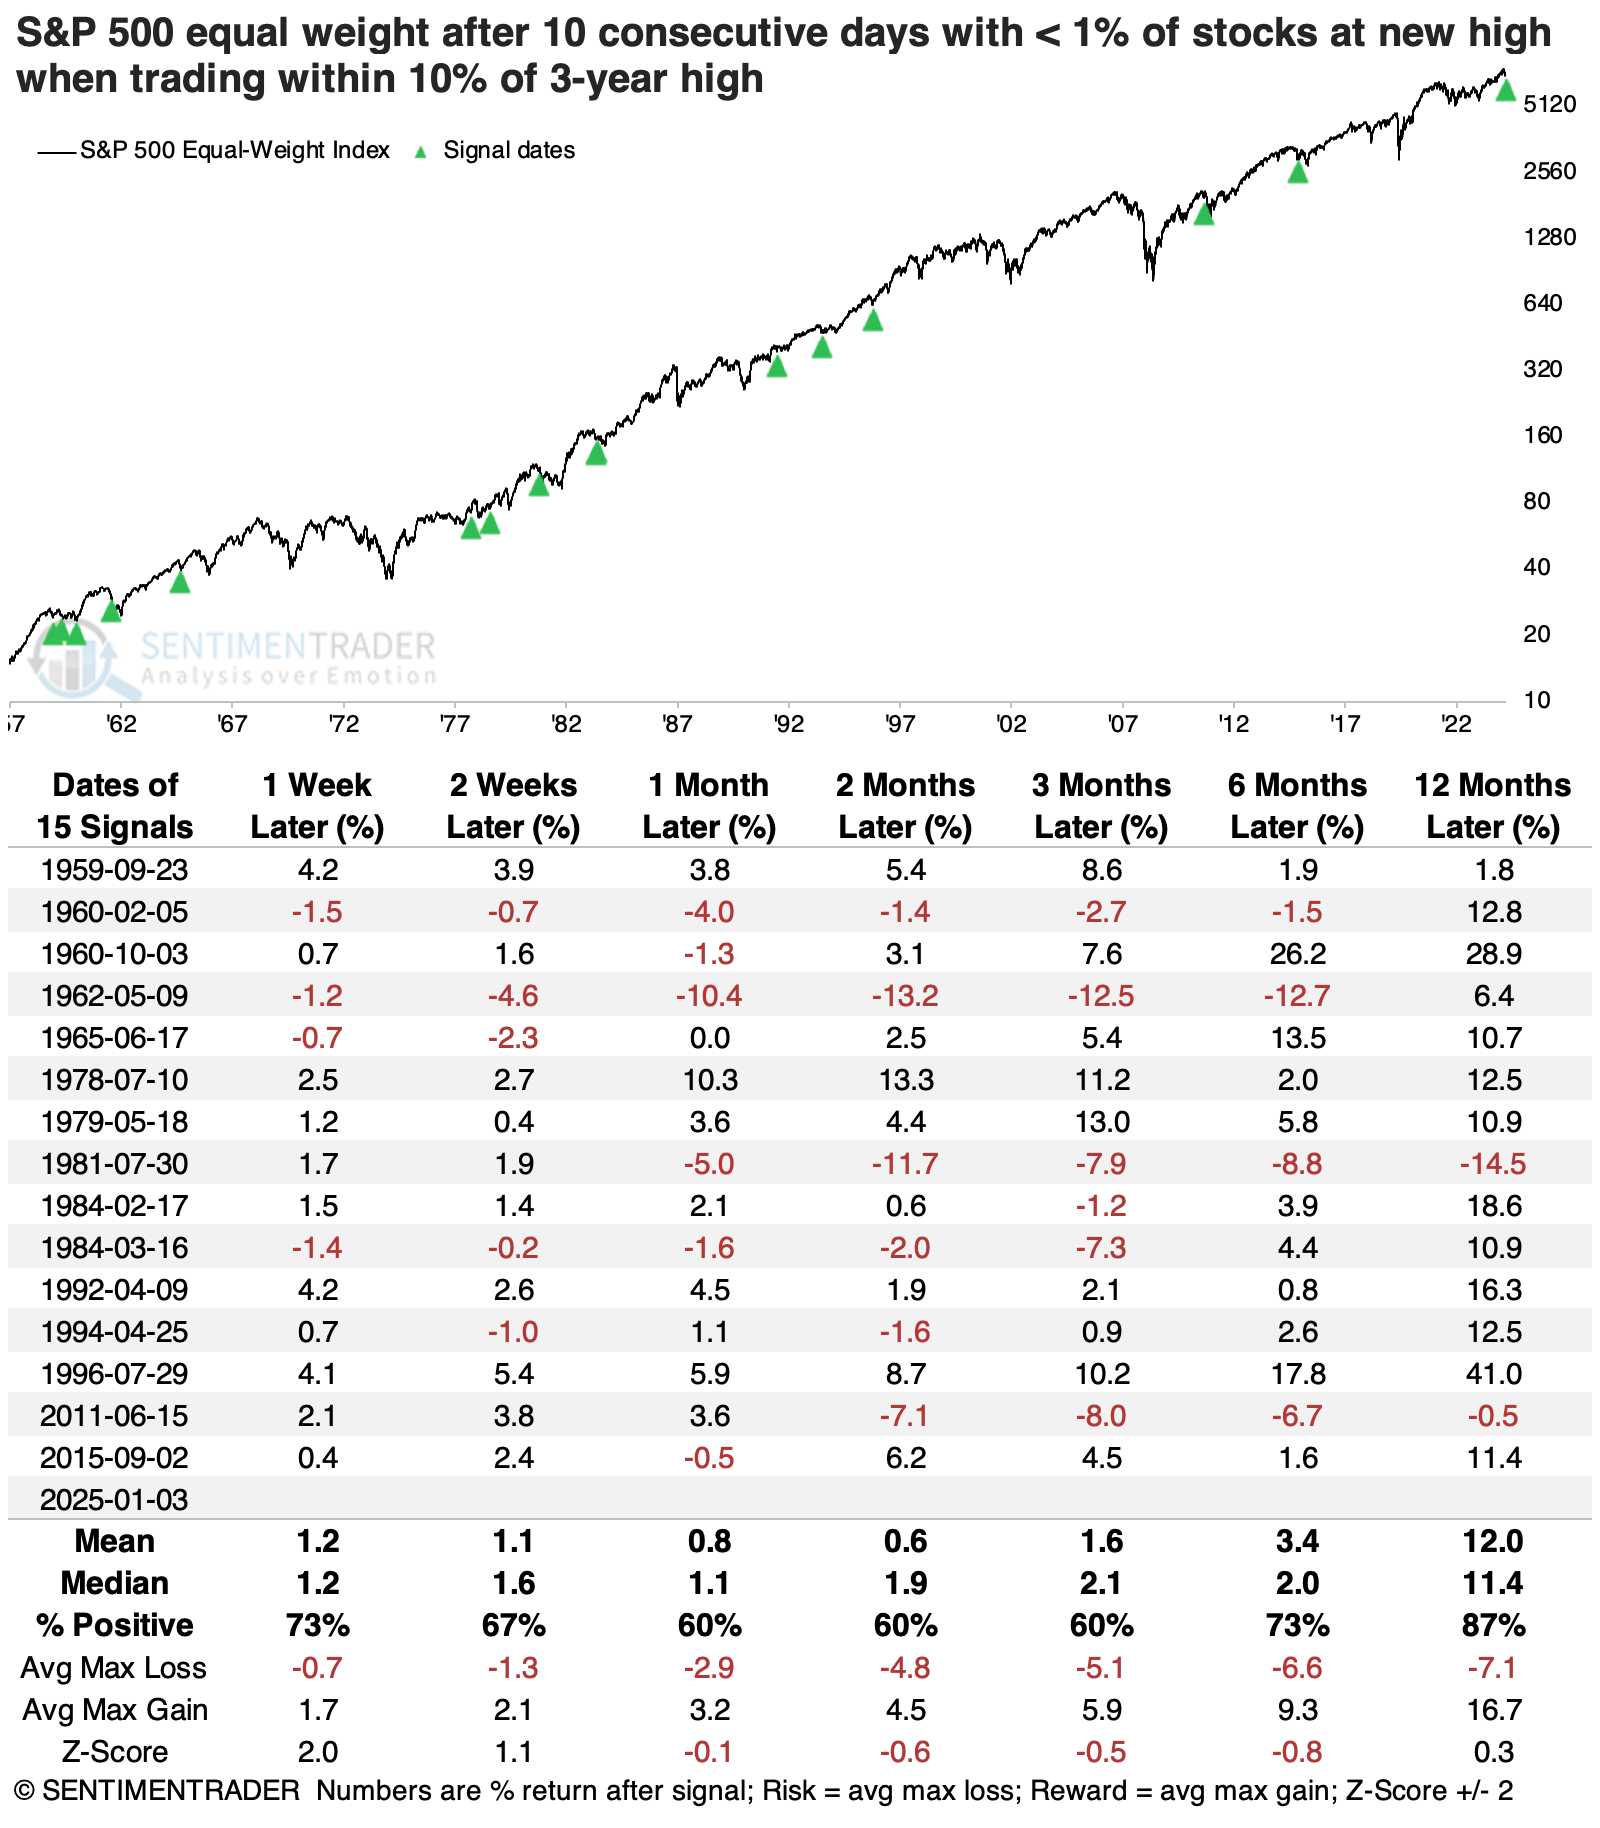
The table below shows a slightly different approach, showing streaks without more than 1% of stocks at new highs when the equal-weight S&P was still within correction territory, using the commonly cited threshold of 10%.
Looking at the data this way added some dates, and again only July 1981 ended up showing a meaningful loss over the next year. Three signals suffered at least a -10% loss within the following year, versus eleven signals that witnessed at least a +10% rally.
What the research tells us...
The average stock in the world's most benchmarked index has been struggling for weeks. However, that perspective is lost when we consider that the S&P 500 is only a few percentage points off its all-time high.
There are some decent signs that the average stock has seen substantial selling pressure, especially during what is still, so far, a technical uptrend. Typically, that invites buy-the-dip investors. Those expecting the average stock to catch up to the popular cap-weight S&P 500 have been disappointed for a year. Still, again, there are decent signs that the relationship has stretched to a point that has historically preceded some mean-reversion. These signs suggest that those looking for exposure to S&P may want to focus more on a fund like RSP versus SPY or one of the others.