
Why strong might be too strong

In recent weeks, we've pointed out a number of warning signs related to record-high optimism, bordering on euphoria, with investors moving into the most leveraged and speculative parts of the market.
And yet, the type of internal deterioration we often see following similar readings has not yet happened, either broadly among stocks or leading markets like high-yield bonds.
The ever-cheerful service ZeroHedge published another warning on Wednesday, suggesting that this type of strength may be the source of its own undoing.
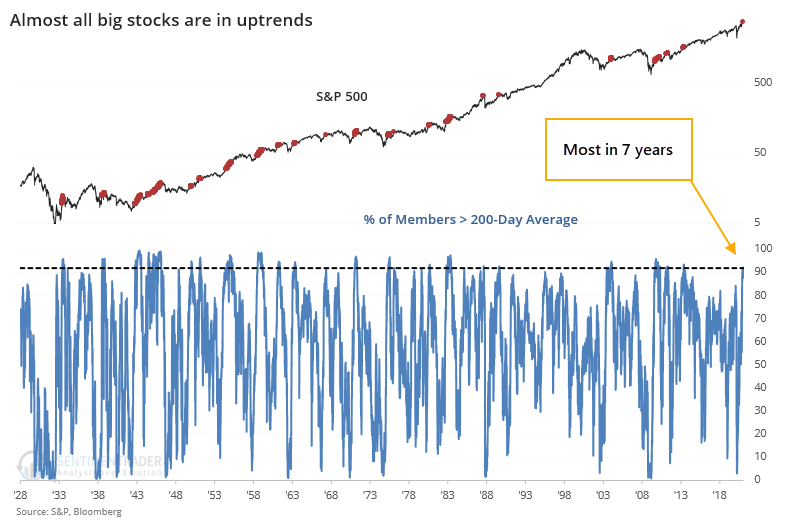
Morgan Stanley's Mike Wilson...points out that 92% of the stocks in the S&P 500 (extremely strong breadth) are currently sitting above their 200-day moving averages. As Wilson ominously points out, "historically, this metric tends to have difficulty moving above these levels (98th percentile over the last 30 years)" and If history holds, Morgan Stanley expects this metric to turn lower, "which can happen via price corrections or moving averages rising as prices stall."
Because according to [Bank of America's] Michael Wilson's backtest of forward returns after the % of S&P 500 stocks above 200-day moving averages reaching current levels or higher, forward returns on a 5-day, 1-month, and 3-month basis all tend to be lower than in other periods and in each case with high statistical significance.
Indeed, the recent surge has carried more stocks into uptrends than at any point since 2013.
So far, when we've looked at super-strong breadth readings, they have shown a modest tendency to precede short-term weakness, or at best tepid returns, but medium- to long-term results were skewed to the upside, with egregiously positive ratios of reward to risk.
In this case, context matters a lot. Below, we can see every time when more than 92% of stocks within the S&P 500 closed above their 200-day moving averages. This includes only the first signal in 3 months and only times when the S&P was at least 5% below its all-time high at the time of the surge.
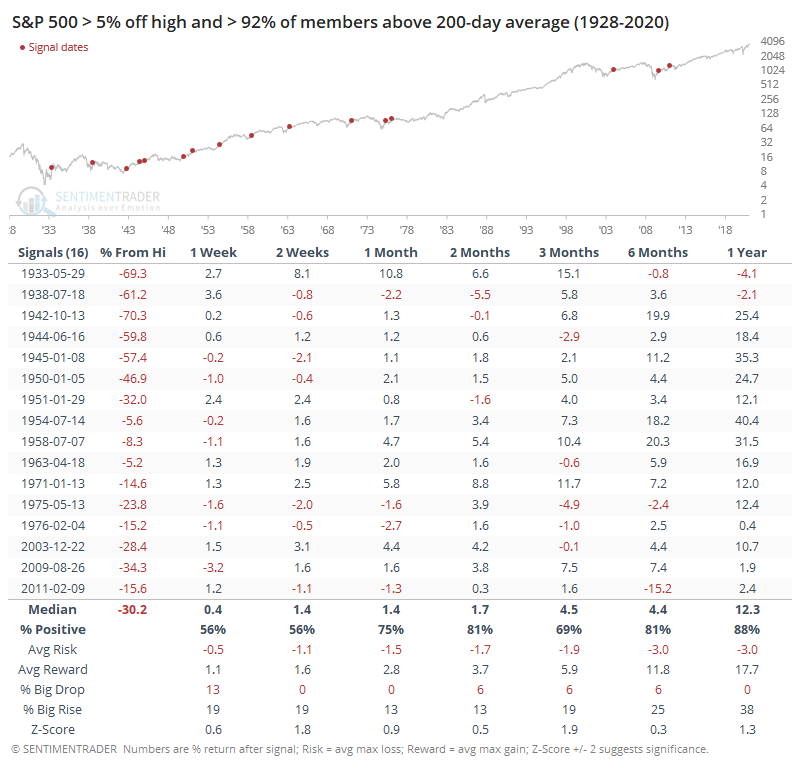
Pretty good results, with only minor losses on all time frames. There was a 15% loss 6 months after the signal in 2011, but other than that, the risk/reward was very good.
It also doesn't apply right now.
The index has soared, so we're well out of any kind of oversold conditions that helped propel those other signals. So, let's look at those that triggered when the S&P was at or close to its high instead.
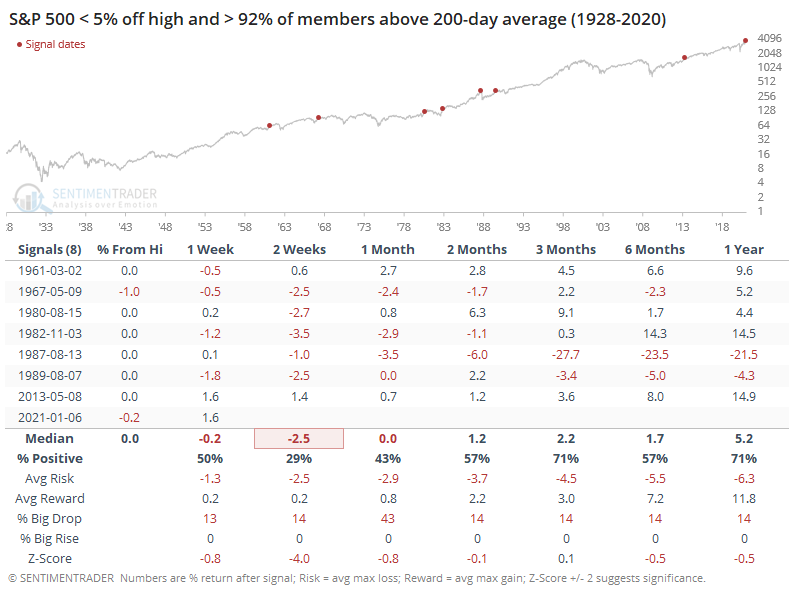
This has been more of an issue, especially over the next 2-4 weeks, but generally leading to below-average returns across all time frames. It triggered right before the market careened into Black Monday, so strong breadth isn't always an indicator that things will necessarily be okay.
The Risk/Reward table isn't very encouraging, with 5 of the 7 signals showing as much or more risk than reward over the next 2-3 months.
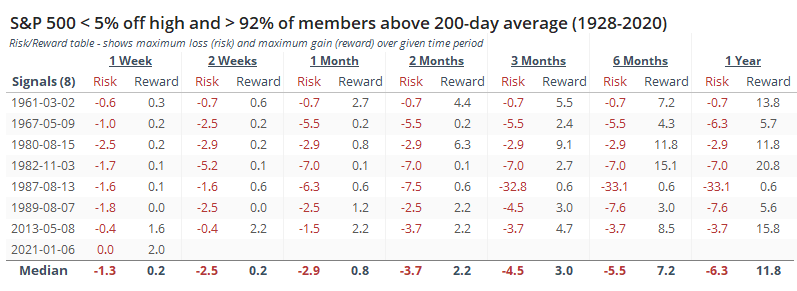
If we look at the price path of the S&P following these surges, then we can get a little better idea of how it played out in the months ahead.
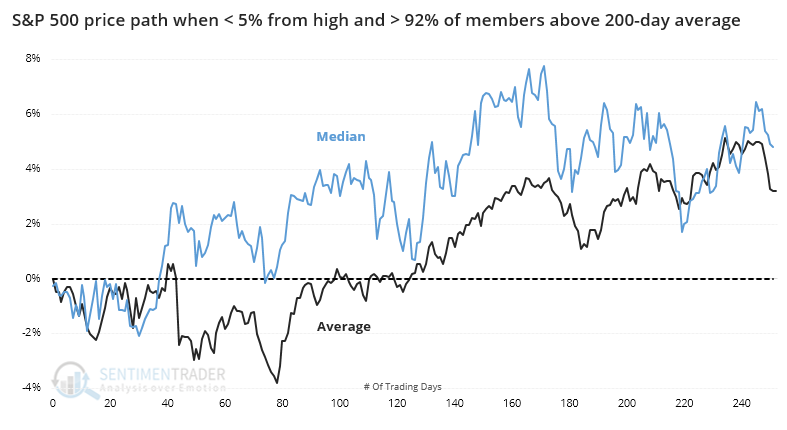
The first 30 days were especially fraught, but even up to 70-80 days later, the trend was flat-to-down. The individual dates showed quite a bit of variability, ranging from impressive rallies in 2013 and 1982 all the way to the crash of 1987.
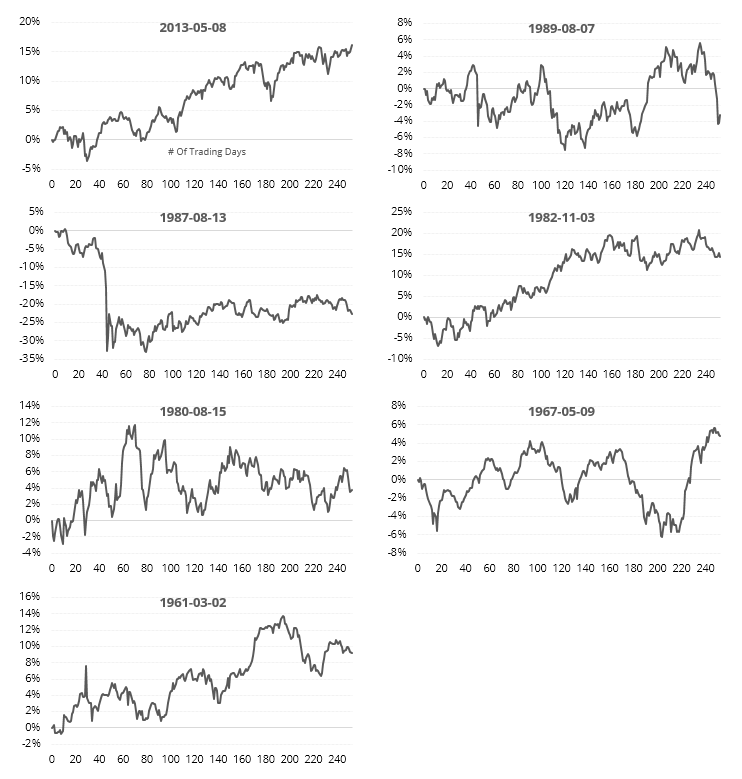
Like we saw in '87, we can't just sit back and assume that gains will continue to accrue just because we're seeing extremely strong internal buying pressure. It's also clear that that is a big exception, with most other cases seeing gains or moderate losses at worst. And again, those losses tended to be focused in the short- to medium-term.
The argument that stocks are too strong is always an iffy one when there is no internal deterioration, and so far other than some isolated days in December, we're not seeing that. This kind of behavior suggests that while the supreme confidence among investors is likely going to limit gains, it's not yet enough of an issue that has triggered under-the-surface selling and imminent warning signs.