Data &
Technology
Research
Reports
Report Solutions
Reports Library
Actionable
Strategies
Free
Resources
Simple Backtest Calculator
Simple Seasonality Calculator
The Kelly Criterion Calculator
Sentiment Geo Map
Public Research Reports
Free Webinar
Pricing
Company
About
Meet Our Team
In the News
Testimonials
Client Success Stories
Contact
Log inLoginSign up
< BACK TO ALL REPORTS

Why Small Caps Might Be a Better Bet

Jason Goepfert
2021-06-10
Over the past 3 weeks, S&P 500 stocks have been treading water while more in the Russell 2000 and Nasdaq rise above their 50-day moving averages.

Over the past few weeks, there has been a remarkable rotation under the surface.

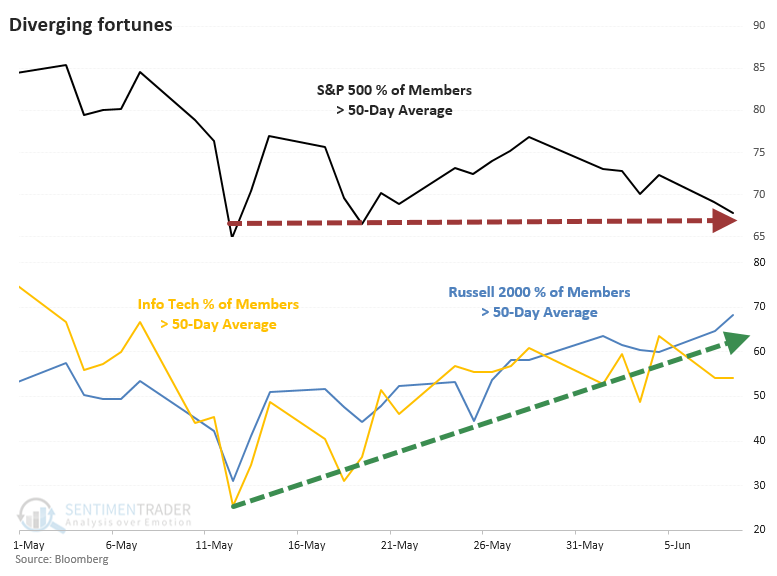
Since some riskier stocks took a mini-tumble into early May, many of them have stormed back. On May 12, only 31% of stocks in the Russell 2000 were holding above their 50-day moving averages. In the Info Tech sector, only 25% of stocks were above their averages. Both have seen participation more than double since then, while the S&P 500 has stagnated internally, as pointed out by the esteemed Liz Ann Sonders.

S&P 500 Russell 2000 Nasdaq members above 50 day average

The big question, as always, is "so what?"

Bulls want to believe that the S&P 500 is just treading water and about to head higher, preceded by increasing risk appetite from investors moving into high-beta stocks. Bears will argue that stagnation is a sign of indecision and chop, something usually seen at peaks.

Looking at available history, bears have the more compelling evidence on their side, depending on the index, and the time frame.

For the S&P, this was a horrible sign. Over the next two months, it managed to rally only twice out of eleven attempts. For the other two indexes, however, it wasn't nearly as ominous.

What else we're looking at

  • Full returns in the S&P 500 after these internal divergence signals
  • How the Russell 2000 and Nasdaq Composite fared relative to the S&P after the signals - the Russell stands out
  • Highlighting a backtest for when more than 90% of S&P stocks traded above their 50-day averages
  • Members in the Russell 2000 have "reset" and show a thrust


Stat box

Fewer than 65% of gold mining stocks are now trading above their 50-day moving averages, the fewest in over a month. A 20-day average of this figure has now dropped below 89%. Out Backtest Engine shows this has triggered 28 times in nearly 30 years, and an index of mining stocks rallied over the next month after only 10 of them.

Etcetera

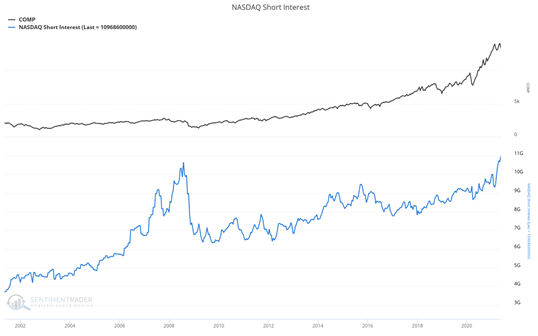
Wait for the squeeze. Total short interest among stocks on the NASDAQ exchange is at an all-time high, surpassing its previous peak in the summer of 2008. This doesn't account for the number of issues or float, but it's interesting to note that it just exceeded its prior peak.

nasdaq short interest

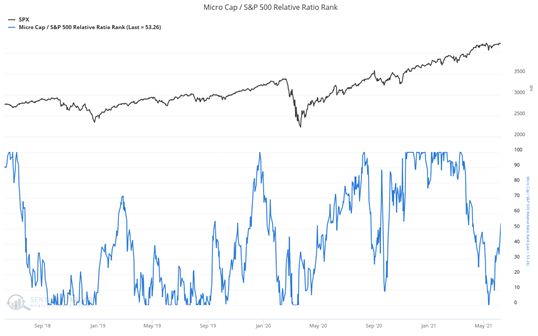
Risky business. Our micro-cap / S&P 500 relative ratio rank has rallied back to near half its latest peak from March 11th. This suggests that investors are exhibiting risk-on behavior after a three-month break.

micro cap s&p relative ratio rank

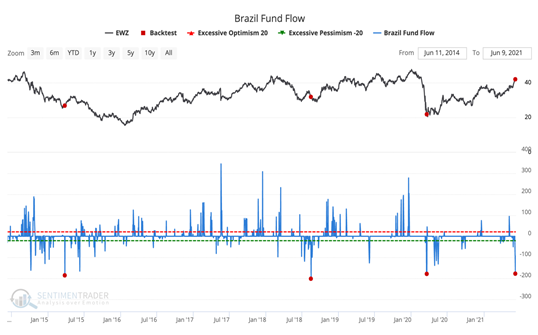
Brazil waxed. More than $175 million exited the Brazil fund, EWZ, earlier this week, the fourth time in 7 years this has happened, according to our Backtest Engine. Three months after the others, EWZ showed a gain each time, averaging 18%.

ewz brazil fund flow

DATA &
TECHnologies
IndicatorEdge
‍
BackTestEdge
‍
Other Tools
‍
DataEdge API
RESEARCH
reports
Research Solution
‍
Reports Library
‍
actionable
Strategies
Trading Strategies
‍
Smart Stock Scanner
‍
FREE
RESOUrCES
Simple Backtest
Calculator
Simple Seasonality
Calculator
The Kelly Criterion
Calculator
Sentiment Geo Map
‍
Public Research Reports
‍
Free Webinar
COMPANY
‍
About
‍
Meet our Team
‍
In the News
‍
Testimonials
‍
Client Success Stories
Pricing
Bundle pricing
‍
Announcements
‍
FAQ
© 2024 Sundial Capital Research Inc. All rights reserved.
Setsail Marketing
TermsPrivacyAffiliate Program
Risk Disclosure: Futures and forex trading contains substantial risk and is not for every investor. An investor could potentially lose all or more than the initial investment. Risk capital is money that can be lost without jeopardizing ones’ financial security or life style. Only risk capital should be used for trading and only those with sufficient risk capital should consider trading. Past performance is not necessarily indicative of future results.

Hypothetical Performance Disclosure: Hypothetical performance results have many inherent limitations, some of which are described below. No representation is being made that any account will or is likely to achieve profits or losses similar to those shown; in fact, there are frequently sharp differences between hypothetical performance results and the actual results subsequently achieved by any particular trading program. One of the limitations of hypothetical performance results is that they are generally prepared with the benefit of hindsight. In addition, hypothetical trading does not involve financial risk, and no hypothetical trading record can completely account for the impact of financial risk of actual trading. for example, the ability to withstand losses or to adhere to a particular trading program in spite of trading losses are material points which can also adversely affect actual trading results. There are numerous other factors related to the markets in general or to the implementation of any specific trading program which cannot be fully accounted for in the preparation of hypothetical performance results and all which can adversely affect trading results.

Testimonial Disclosure: Testimonials appearing on this website may not be representative of other clients or customers and is not a guarantee of future performance or success.