Data &
Technology
Research
Reports
Report Solutions
Reports Library
Actionable
Strategies
Free
Resources
Simple Backtest Calculator
Simple Seasonality Calculator
The Kelly Criterion Calculator
Sentiment Geo Map
Public Research Reports
Free Webinar
Pricing
Company
About
Meet Our Team
In the News
Testimonials
Client Success Stories
Contact
Log inLoginSign up
< BACK TO ALL REPORTS

Why Monday was so unusual

Jason Goepfert
2021-03-31
Earlier this week, the S&P 500 was holding near a high, but with the worst breadth in more than 60 years.

It's always sketchy to make a big deal about a single trading session, especially in relation to drawing conclusions about future returns. Markets are too noisy, and sometimes there is a market event that throws things out of whack for a day or two.

At the risk of that, let's make a big deal about Monday.

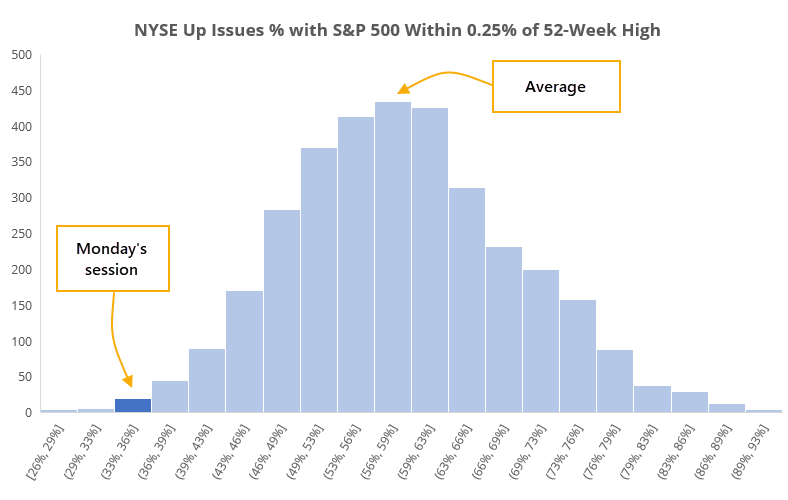
Despite the S&P 500 closing within 0.1% of a record high on Monday, fewer than 35% of securities on the NYSE managed to close above their closing price from Friday. That was the weakest Up Issues Ratio since 1946.

Since 1928, when the S&P 500 was within 0.25% of a 52-week high, an average of 58% of securities on the NYSE advanced for the day. There have been 3,331 days when the S&P was that close to a high, and the histogram below shows just how unusual Monday's session was. 

Average NYSE up issues

In terms of what those weak days meant for forward returns, the S&P had some trouble holding near its highs when so many stocks had been declining under the surface. Every signal in the past 30 years showed a negative 1-month return.

What else we're looking at

  • Detailed returns following extremely low Up Issues
  • The McClellan Oscillator and Summation Index are also unusually low
  • What it means when financials consistent underperform the broader market - and what that means right now
  • What happens when optimism on the VXX volatility fund starts to ebb from enthusiasm

Stat Box

Over the past 20 days, an average of 92% of gold mining stocks have been mired in a bear market. This is the most since early 2014.


Etcetera

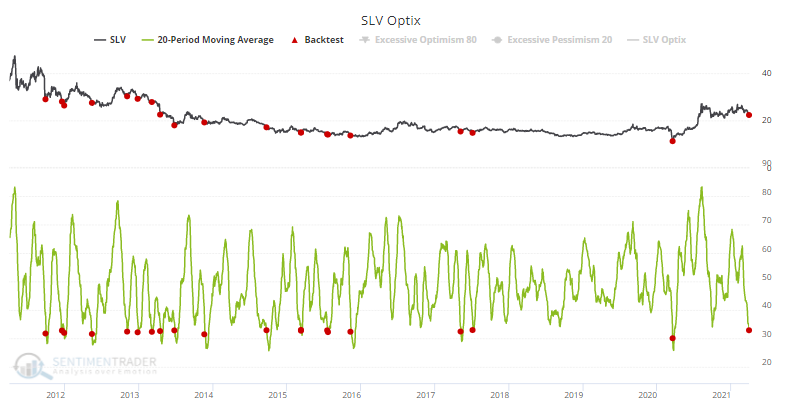
The shine has come off precious metals. A 20-day moving average of the Optimism Index for the SLV silver ETF is showing the least optimism since the big thrust starting a year ago. It's about as low as it got during the protracted bear market. Our Backtest Engine shows that even during the bear market, this kind of low optimism generated a positive return over the next month.

silver etf slv sentiment

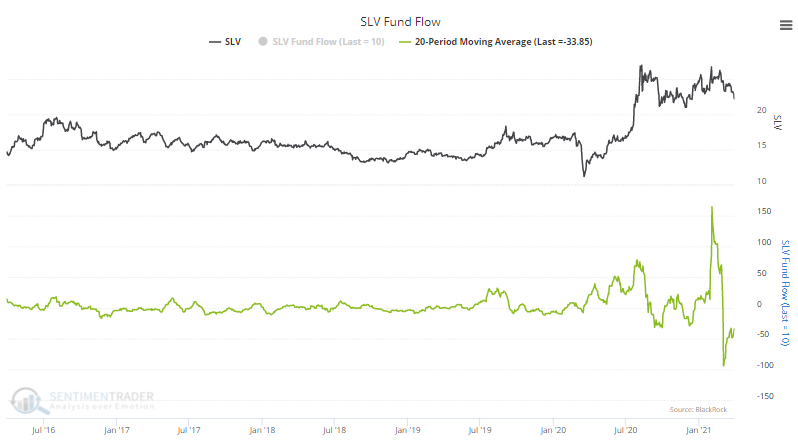
Traders are leaving. After a big spike in assets for a couple of days early in February, the SLV fund has been leaking funds. Over the past month, the fund has lost an average of nearly $34 million per day.

slv silver etf fund flow

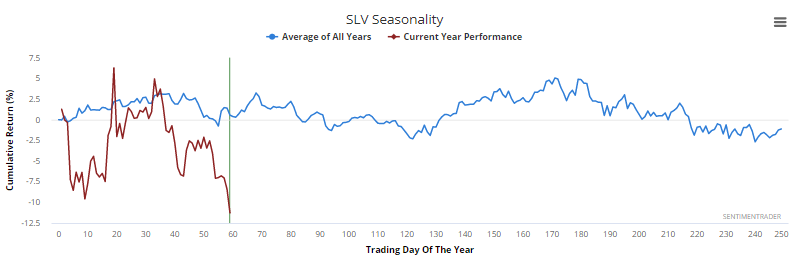
Seasonal boost? The spring winds typically provide a tailwind to SLV, as it has a positive seasonal bias in April...before a tougher stretch during the summer months.

silver slv seasonality

DATA &
TECHnologies
IndicatorEdge
‍
BackTestEdge
‍
Other Tools
‍
DataEdge API
RESEARCH
reports
Research Solution
‍
Reports Library
‍
actionable
Strategies
Trading Strategies
‍
Smart Stock Scanner
‍
FREE
RESOUrCES
Simple Backtest
Calculator
Simple Seasonality
Calculator
The Kelly Criterion
Calculator
Sentiment Geo Map
‍
Public Research Reports
‍
Free Webinar
COMPANY
‍
About
‍
Meet our Team
‍
In the News
‍
Testimonials
‍
Client Success Stories
Pricing
Bundle pricing
‍
Announcements
‍
FAQ
© 2024 Sundial Capital Research Inc. All rights reserved.
Setsail Marketing
TermsPrivacyAffiliate Program
Risk Disclosure: Futures and forex trading contains substantial risk and is not for every investor. An investor could potentially lose all or more than the initial investment. Risk capital is money that can be lost without jeopardizing ones’ financial security or life style. Only risk capital should be used for trading and only those with sufficient risk capital should consider trading. Past performance is not necessarily indicative of future results.

Hypothetical Performance Disclosure: Hypothetical performance results have many inherent limitations, some of which are described below. No representation is being made that any account will or is likely to achieve profits or losses similar to those shown; in fact, there are frequently sharp differences between hypothetical performance results and the actual results subsequently achieved by any particular trading program. One of the limitations of hypothetical performance results is that they are generally prepared with the benefit of hindsight. In addition, hypothetical trading does not involve financial risk, and no hypothetical trading record can completely account for the impact of financial risk of actual trading. for example, the ability to withstand losses or to adhere to a particular trading program in spite of trading losses are material points which can also adversely affect actual trading results. There are numerous other factors related to the markets in general or to the implementation of any specific trading program which cannot be fully accounted for in the preparation of hypothetical performance results and all which can adversely affect trading results.

Testimonial Disclosure: Testimonials appearing on this website may not be representative of other clients or customers and is not a guarantee of future performance or success.