Why Keep an Eye on PPI
The latest Producer Price Index (PPI) number just came out. And of course, it is getting spun in all different directions - based primarily on whether the person doing the spinning wants to spin it in a mostly negative light ("inflation is soaring!") or a mostly positive light ("the individual components are a mixed bag, therefore...").
Blah, blah, blah.
Here is what you need to know about inflation in general and the current way of things. Jay summed it up very simply:
- Yes, inflation is presently "high" on a historical basis
- High OR inverse inflation (deflation) is typically bad for stocks (but - importantly - not always)
- Yes, the level of inflation does seem to matter (i.e., extreme readings are significantly worse than moderate readings)
In a nutshell, when inflation rises to a certain point, it is correct to be concerned about the impact on stocks. However, there is no guarantee that the market will decline solely because of high or rising inflation.
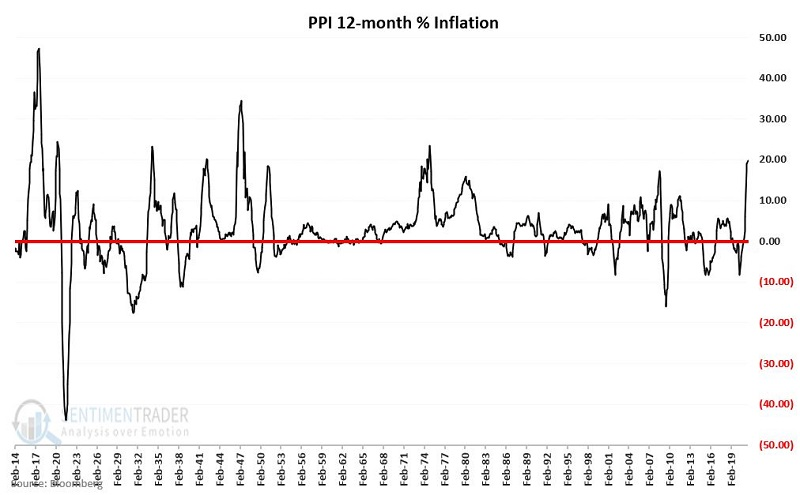
If we look at the 12-month rate of change in PPI, we can get a sense for one popular measure of inflation. By this method, at the end of August 2021, the 12-month % change for PPI will be 19.79% (we advance it by a month to account for reporting lags).
The historical chart since 1914 appears below.
The chart below displays the cumulative % gain or loss for the Dow since 1914 if held only when PPI inflation at the end of the previous month is greater than +4%. Holding the Dow over the last 107 years ONLY when PPI 12-month inflation was greater than 4% produced a loss of -3%.
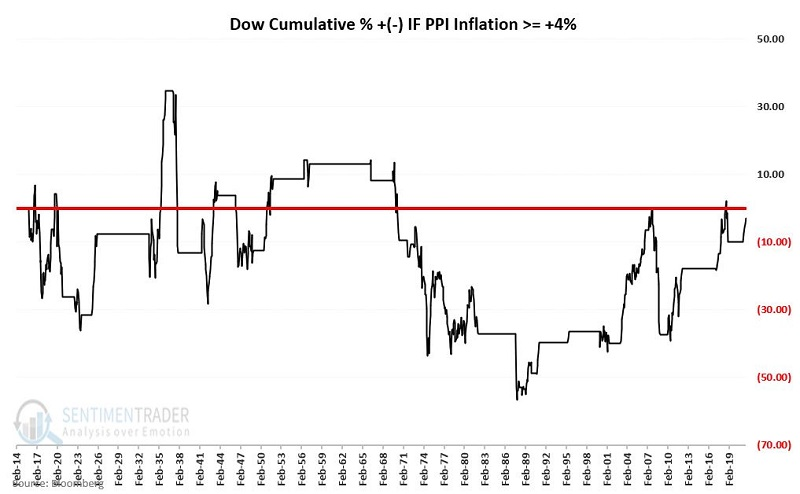
To put this -3% loss for the Dow into perspective, note that from February 1914 through July 2021, the Dow gained +57,875% (price only). The results get even more extreme when looking at larger numbers in the PPI rate of change.
So does this mean that we need to be concerned about high inflation this time around?
The jury is still out on that one.
The bottom line is that - based on historical results - the current state of inflation should be listed on the negative side of the "Weight of the Evidence" ledger.
What else we're looking at
- More detail on returns in the Dow during different inflation regimes
- Looking at a trading signal using stochastic momentum
- Yet another reason to not fight the Fed
| Stat box Got milk? The MOO Agribusiness ETF has rallied for 6 consecutive days, tied for the 10th-longest streak in the past 5 years. It's longest streak of up days was 9 in November 2019. |
Etcetera
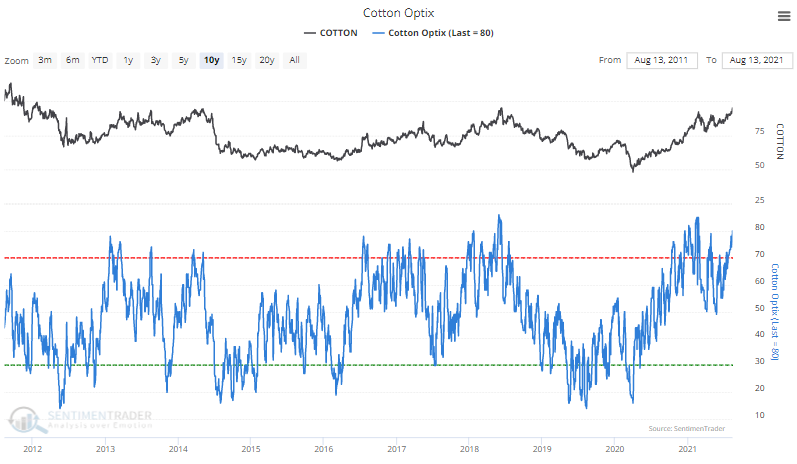
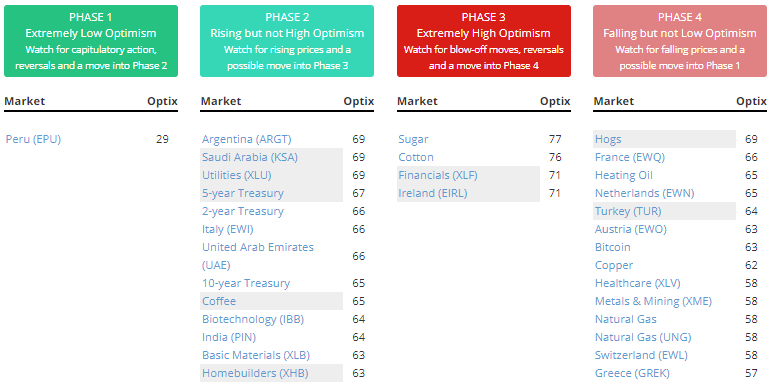
The (expensive) fabric of our lives. Among the markets we cover, the highest Optimism Index is currently in cotton. Over the past 30 years, an Optix value of 80 or above preceded a one-year average return of -8% according to our Backtest Engine.
Not a lot of pessimism. Among all markets, the only one in Phase 1 - showing low optimism over the past 10 days - is Peru.
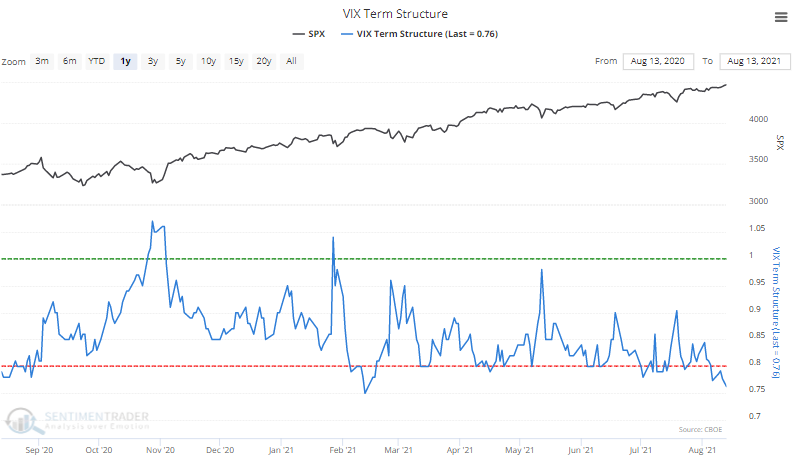
No fear. The Term Structure in the VIX is showing that traders are placing little confidence in an extreme move in stocks anytime soon. This is the 2nd-lowest reading in 3 years and among the lowest in the past 15 years.
