Why are correlations plunging?

The historic shift between factors hasn't really let up since they were jolted out of a slumber last week. The continued outperformance in small-cap stocks is triggering some other oddities, as well.
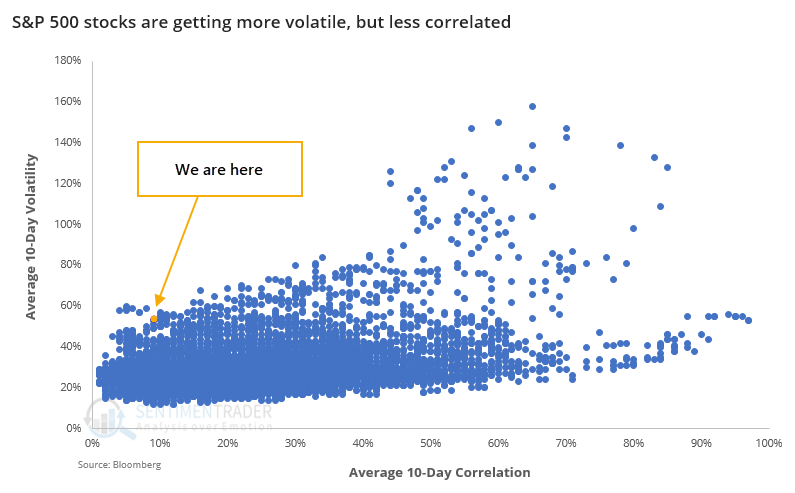
Bloomberg notes that while the average 10-day volatility among stocks in the S&P 500 has jumped along with big price moves over the past two weeks, the average 10-day correlation among stocks in the index has plunged.
This is extremely unusual. Most of the time, higher volatility means higher correlation and vice-versa.
For the S&P 500, this was a mixed-to-positive sign, with gains over the next month and longer-term, but less-positive performance over the next 2 months.
This phenomenon is likely mostly triggered by smaller stocks within the index suddenly becoming more volatile. And, for the most part, that was a good sign for those smaller stocks. The Russell 2000 performed admirably after the other times there was a similar divergence between volatility and correlation.
What else is happening
These are topics we explored in our most recent research. For immediate access with no obligation, sign up for a 30-day free trial now.
- Full returns in the S&P 500 and Russell 2000 after wide spreads between correlation and volatility
- Energy stocks are close to closing above their 200-day average, recovering from the worst spread since 1926
- What happens when there is a wide spread between Smart Money and Dumb Money
- Over half of our core indicators are now showing excessive optimism
- Most countries are showing a very high optimism reading
Coding for investors
Do you want to know how we test some of our strategies? Using free, readily available tools, you can. Don't be hemmed in by common misperceptions and outright disinformation about what works and what doesn't - test it yourself.
If you're new to coding, this initial video in a new series is a must-watch. We walk you step-by-step in creating a simple algorithmic trading strategy using the popular Relative Strength Index (RSI).
| Stat Box Stocks in Asia have been rallying just as hard as those in the U.S. In India, more than 40% of stocks in the Nifty 50 have rallied enough to become overbought according to their Relative Strength Index. For this particular index, "overbought" was a good thing, with the Nifty rising over the next month after 92% of the signals. |
Sentiment from other perspectives
We don't necessarily agree with everything posted here - some of our work might directly contradict it - but it's often worth knowing what others are watching.
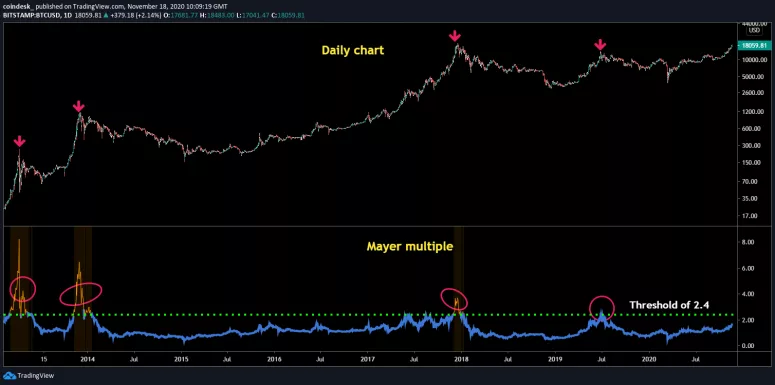
1. The "Mayer Multiple" on bitcoin still isn't flashing a warning sign. When bitcoin last suffered its most prolonged declines, it was more than 2.4x higher than its 200-day moving average. That's all this indicator is - the spread between the market and its long-term average, which investors have been watching forever. Sidenote - please don't try to name common indicators after yourself, it's embarrassing. [Coindesk]
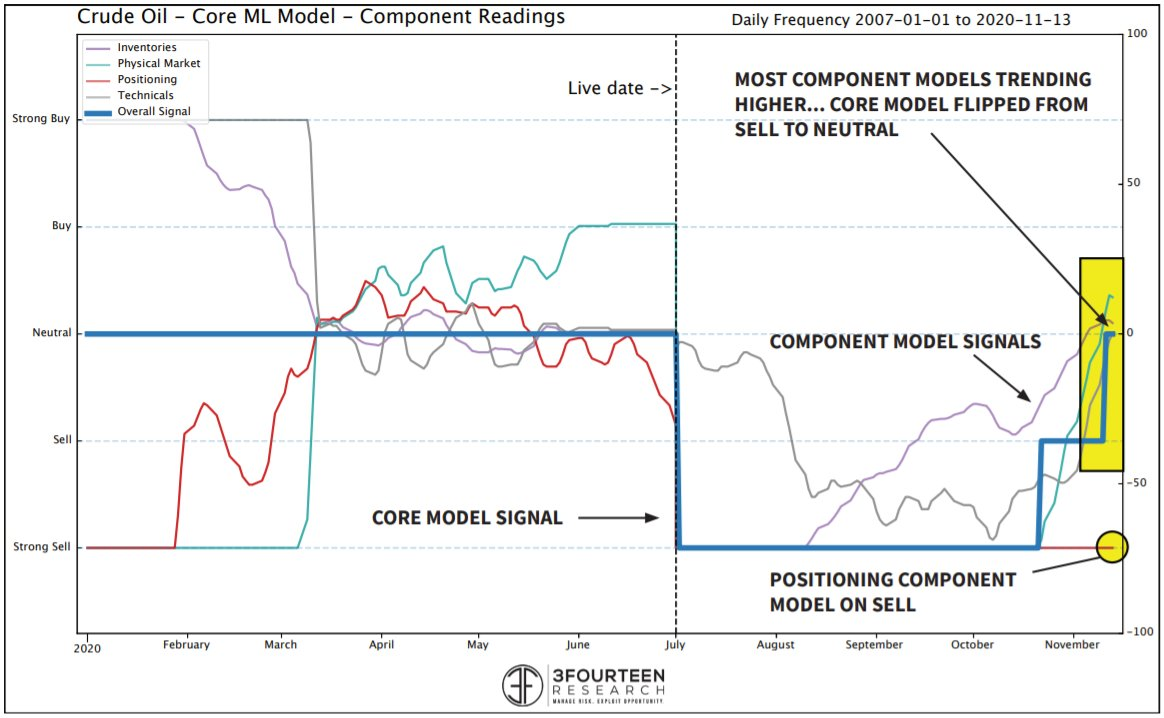
2. Hedge funds are still carrying too much long exposure to crude oil. A model that combines various aspects of the oil market has turned neutral after being negative for months. Now, if only those pesky hedge funders would finally give up the ghost. [3Fourteen Research]
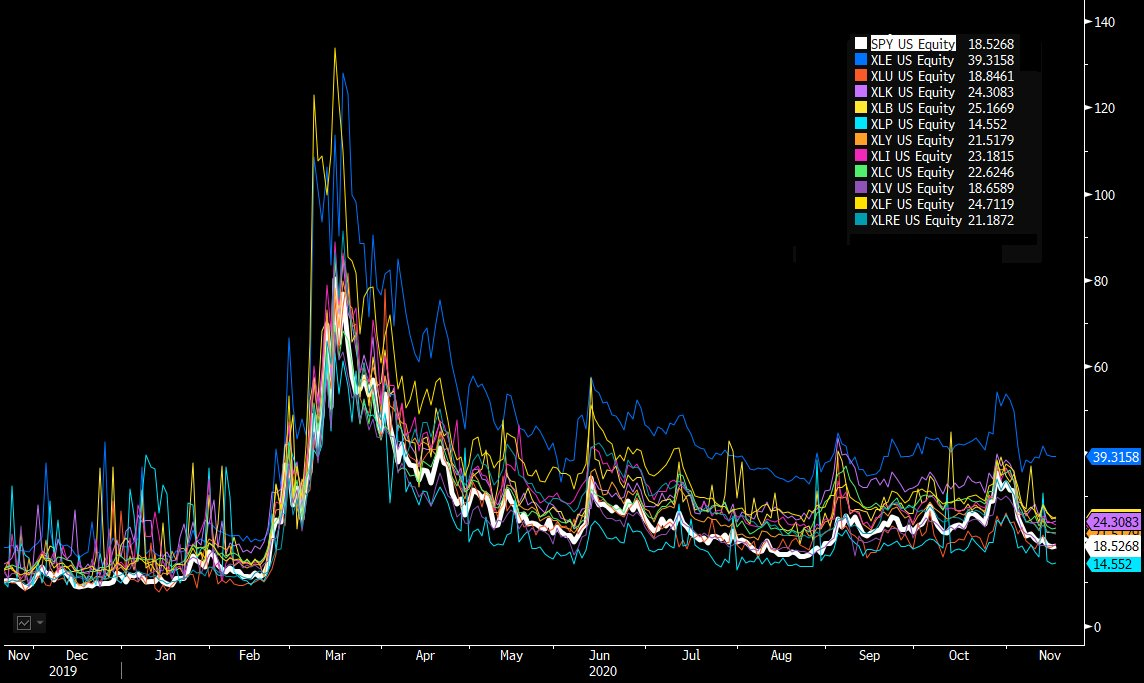
3. Implied forward volatility has plunged across virtually all sectors. Staples, which is usually one of the least volatile sectors anyway, has the smallest expected movement according to options traders. [I. Vodenitcharov CFA CMT]