Data &
Technology
Research
Reports
Report Solutions
Reports Library
Actionable
Strategies
Free
Resources
Simple Backtest Calculator
Simple Seasonality Calculator
The Kelly Criterion Calculator
Sentiment Geo Map
Public Research Reports
Free Webinar
Pricing
Company
About
Meet Our Team
In the News
Testimonials
Client Success Stories
Contact
Log inLoginSign up
< BACK TO ALL REPORTS

Why 2021 was so much like the mid 1990s

Jason Goepfert
2022-01-05
We take a look at years with the closest sector and factor performance to 2021. Returns following a quarter with more than a 9% gain were good.

Sector and factor performance most like 2021

Near the end of the year, we looked at the S&P 500's closest analogs. In terms of pure price performance for the index itself, the highest-correlated year was 1995.

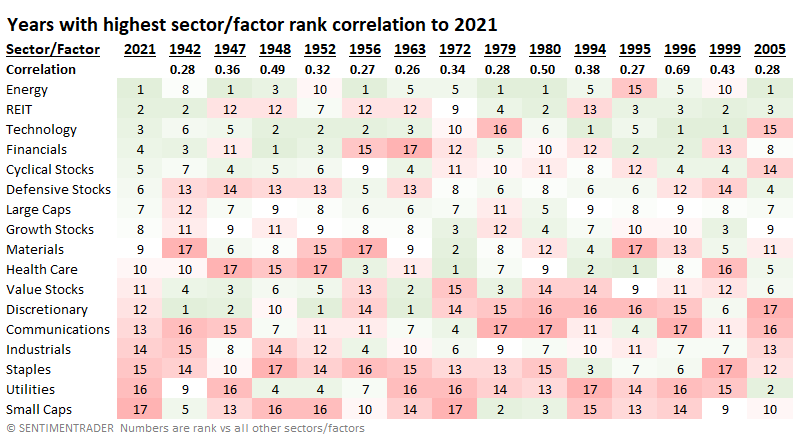
If we look at performance under the surface, things change a bit. In 2021, Energy and REITs were the highest-ranked sectors, while the Small-Cap factor took up the rear. This is using total return and ranked against the return of all other sectors and factors. In 1995, Health Care and Financials led everything else, though Small-Caps were still weak.

Using the correlation between sector and factor ranks, 1995 doesn't show up as the closest correlation (+0.27 out of a scale from -1.0 to +1.0). That honor belongs to the following year (0.69). Most sectors/factors with high (green) and low (red) rankings in 2021 showed similar rankings in 1996.

Sector factor performance most like 2021

Like we saw with the S&P analog, years with the highest sector and factor correlations to 2021 showed strength in the first couple of weeks, then less so. For the sectors and factors themselves, there was some evidence of mean-reversion. 

Stat box

On Monday, 100% of stocks in India's Nifty 50 index traded above their 10-day moving averages. That's only the 11th time in 20 years. All 10 previous signals saw the Nifty rise over the following 6 months.


Yet another wonderful quarter for investors

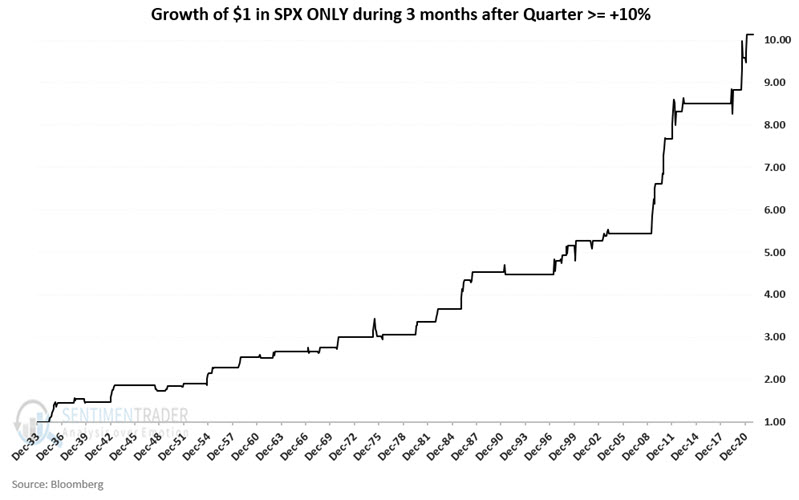
There have been 56 quarters that have seen the S&P 500 Index gain +9% or more in price since 1933. Forty-seven of those quarters were followed by another up quarter. Only nine times did the S&P 500 decline over the next quarter.

The chart below displays the cumulative growth of $1 invested in the S&P 500 for three months after a +9% quarter.

Returns after a 9% quarter

Traders should not assume that the first quarter of 2022 is sure to show a gain for the S&P 500 Index. An 84% success rate is a powerful indication, but it does not guarantee success. 

DATA &
TECHnologies
IndicatorEdge
‍
BackTestEdge
‍
Other Tools
‍
DataEdge API
RESEARCH
reports
Research Solution
‍
Reports Library
‍
actionable
Strategies
Trading Strategies
‍
Smart Stock Scanner
‍
FREE
RESOUrCES
Simple Backtest
Calculator
Simple Seasonality
Calculator
The Kelly Criterion
Calculator
Sentiment Geo Map
‍
Public Research Reports
‍
Free Webinar
COMPANY
‍
About
‍
Meet our Team
‍
In the News
‍
Testimonials
‍
Client Success Stories
Pricing
Bundle pricing
‍
Announcements
‍
FAQ
© 2024 Sundial Capital Research Inc. All rights reserved.
Setsail Marketing
TermsPrivacyAffiliate Program
Risk Disclosure: Futures and forex trading contains substantial risk and is not for every investor. An investor could potentially lose all or more than the initial investment. Risk capital is money that can be lost without jeopardizing ones’ financial security or life style. Only risk capital should be used for trading and only those with sufficient risk capital should consider trading. Past performance is not necessarily indicative of future results.

Hypothetical Performance Disclosure: Hypothetical performance results have many inherent limitations, some of which are described below. No representation is being made that any account will or is likely to achieve profits or losses similar to those shown; in fact, there are frequently sharp differences between hypothetical performance results and the actual results subsequently achieved by any particular trading program. One of the limitations of hypothetical performance results is that they are generally prepared with the benefit of hindsight. In addition, hypothetical trading does not involve financial risk, and no hypothetical trading record can completely account for the impact of financial risk of actual trading. for example, the ability to withstand losses or to adhere to a particular trading program in spite of trading losses are material points which can also adversely affect actual trading results. There are numerous other factors related to the markets in general or to the implementation of any specific trading program which cannot be fully accounted for in the preparation of hypothetical performance results and all which can adversely affect trading results.

Testimonial Disclosure: Testimonials appearing on this website may not be representative of other clients or customers and is not a guarantee of future performance or success.