
Where we were, where we are, and where we're going


Where we were
Near the end of each year, we objectively review studies that were closed during the year.
We track every study that has a solid conclusion in the Active Studies. To remain accountable and transparent, after the studies’ effective time frames have passed, we go back and rate them based on whether they were a good guide or not, and they're moved to the Archived Studies. There are currently 745 studies that have been rated.
The ratings are based on how the indicated market performed over the time frame that was most consistent in the study. They range from 1 to 5 stars.
As we did last year, here is a breakdown of the study results for this year. Using a conservative rating approach, the studies continue to show a positive expectation. You can see summaries from past years in this Knowledge Base article.
The results from this year were good, and don't include a handful of studies that aren't yet graded (they are still active), almost all of which should end up being rated positively.
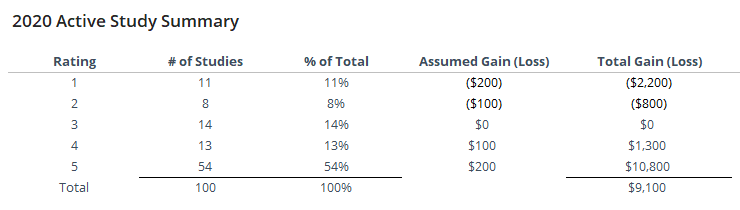
Assuming that we would have lost as much on the bad studies as we gained on the good ones – basically, that our stop losses were equal to our profit targets – then we would have made $9,100, or about a 91% return on the $10,000 total “invested” assuming we put $100 on the market for each of the 100 studies. That's about double the rate of return from other years.
Granted, it’s not a trading system and would be hard or impossible to implement if it was. It’s just a shorthand way of trying to determine if the studies have been helpful over the years. As long as the expectation is positive, we think there’s value in this way of looking at markets.
Many of the most positive ones were medium- to long-term ones that focused on stocks, thanks to extreme pessimism and then incredible momentum during the spring and summer months. We see this consistently - when there is a big cluster of studies pointing one direction or the other, in whatever market, they tend to be mostly accurate.
Where we are
In March and April, investors came for stocks almost without regard to size, quality, or any other factor. That kind of sustained buying thrust has led to higher prices without exception, which it did again. There were even signs of it into May and June before some warning signs popped up in August.
Then again in October, the thrusts returned, helping to shift the market's overall bias to the positive side. Starting in November, we started to see speculative excesses similar to what triggered in August, or even more so in some cases. But internal momentum was still very strong and high-quality.
Until lately.
Over the past 2 weeks or so, there have been more and more odd readings piling up. Whether that's due to year-end machinations or other factors, the fact remains that investors are behaving differently now than they did during the best runs of the year. And that has typically meant that further gains are limited in the short- to medium-term.
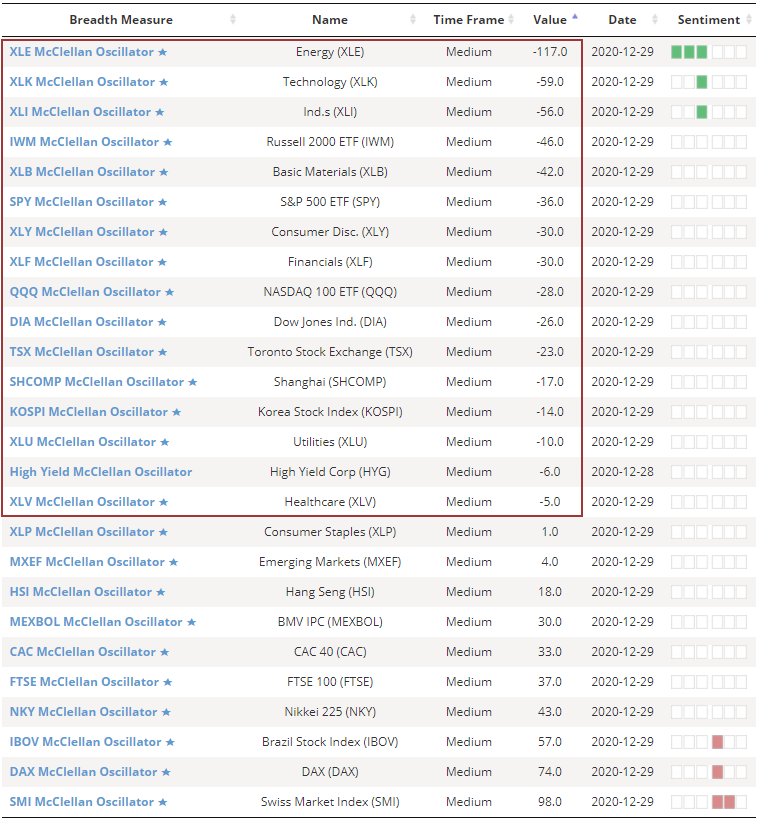
One of the best reflections of this is in the McClellan Oscillator. Across indexes and sectors, the Oscillator is negative. About the only ones in positive territory are for overseas indexes.
The Oscillator for all securities on the NYSE is also negative. Like we saw in August, this is diverging from the price action of the indexes on the surface.
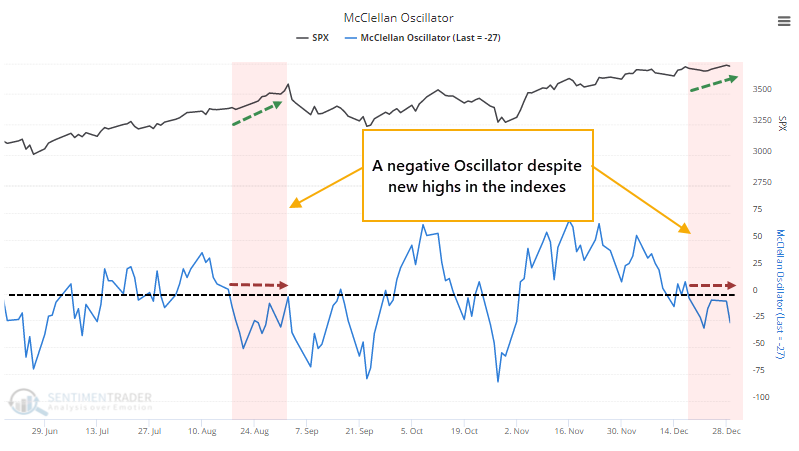
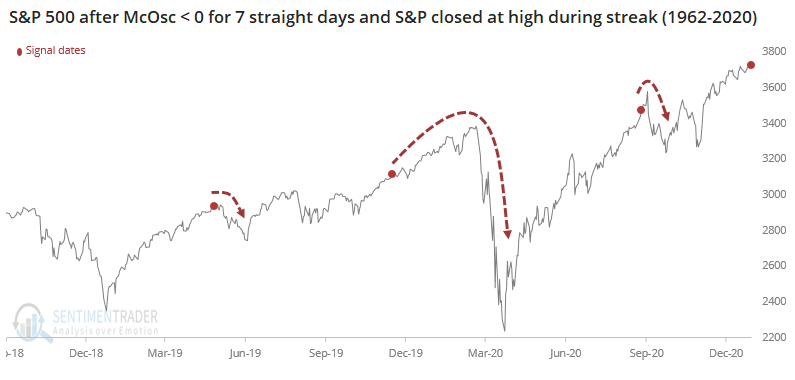
The Oscillator has been negative for 7 consecutive days, even though the S&P 500 has hit record highs during that span. This is unusual.
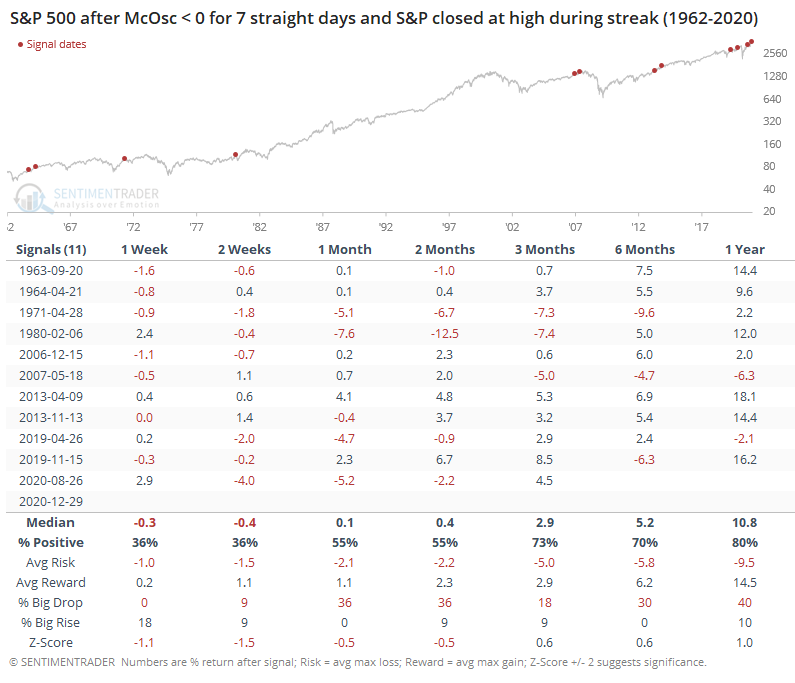
This type of activity has preceded more risk than reward over the next couple of months. If we focus on the last couple of years, then each of them eventually led to any further gains being erased during a subsequent pullback.
The overall market environment is still positive, and we continue to have lingering long-term tailwinds like that big up volume in October and November, surging small-caps and tech stocks, and maybe even still the March through May thrusts and recoveries.
But now we have some counter-signals that weren't really a factor at other points in the year, like Confidence recently near a record high, way too much options speculation, an IPO market that's too hot and getting hotter, along with broad overvaluation and a jump in leverage.
Maybe 2-3 times per year we see almost everything line up and point in one direction, while other times there are conflicts and we have to judge the weight of the evidence. More and more, that's pointing down over a multi-week to multi-month time frame, while beyond that, it's hard to argue with some of those positives that triggered as recently as November.
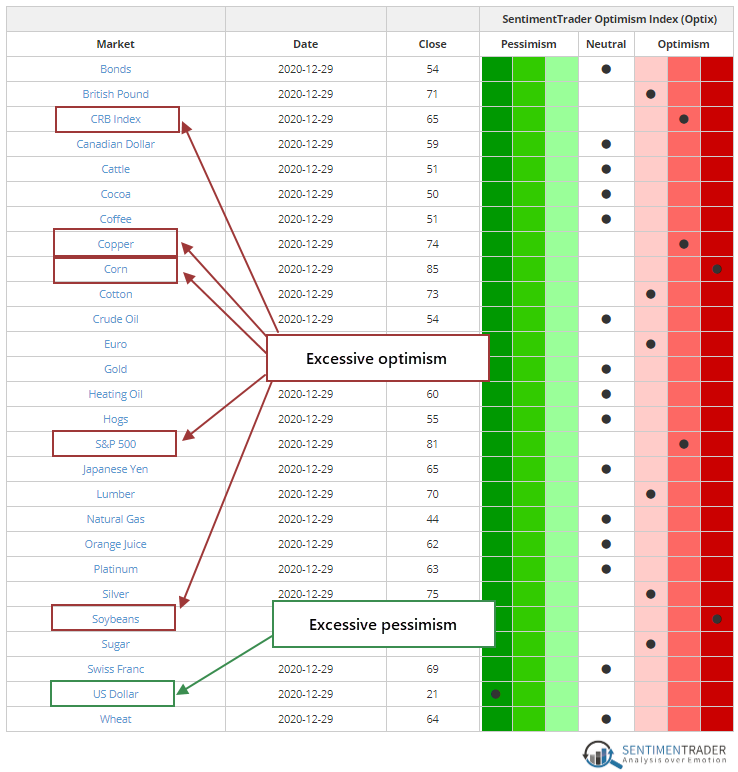
The Market Sentiment Overview gives a broad look at the Optimism Index across markets - if you're looking for a single place to quickly check for extremes, this is a good start. No surprise that the S&P 500 is among them, or the fact that ag contracts and the CRB Index is included. We've been highlighting hedger selling in those contracts each week after the Commitments of Traders report is released. Since hedgers are selling, it means speculators are buying. The dollar is the only market we cover that's showing pessimism, though as noted previously, that market doesn't respond very well to extremes.
Where we're going
There are two main priorities we have as we head into 2021: 1) Give you more tools to check yourself against emotional biases and 2) Make the service more coherent. Not necessarily "more" research, but "better."
Hopefully, in Q1 we will be rolling out an enhanced Backtest Engine, which will allow for much more functionality than the current one. The biggest challenge is to not make it overwhelming for the casual user, and we'll do our best to do so. We're also working on ways to improve our visualizations, screens, and filters.
We will have an increased focus on education and actionable ideas. We have everyone from college students to the most sophisticated investors in the world who use the service, so "trading recommendations" aren't appropriate. But we can do better at distilling the various indicators and studies into cohesive ideas.
To that end, I'm beyond excited to announce that we'll have two additions as of January 1. A combination of smarts, experience, dedication, uniqueness, and ethics has proven difficult to find, and both individuals have this in spades.
Please welcome Jay Kaeppel and Dean Christians!

Jay Kaeppel has over 30 years of experience in options, equity, and futures trading, and as a research analyst, trader, and portfolio manager. Jay’s expertise will allow us to offer expanded content in the areas of seasonality, options trading, and trading systems.
In addition, one of Jay’s greatest strengths is in helping to teach individuals to “think like a trader.” While we do not and will not offer specific investment advice, one of Jay’s primary objectives will be to help members get the most out of our vast array of content by highlighting how investors and traders can effectively put the information on the website to work.
Jay is a prolific researcher and writer as evidenced by his authoring four books on trading: Seasonal Stock Market Trends (Wiley), The Four Biggest Mistakes in Option Trading (Wiley), The Four Biggest Mistakes in Futures Trading (Wiley), and The Option Trader’s Guide to Probability, Volatility, and Timing (Wiley).
Currently, he writes the monthly Explore Your Options column for STOCKS & COMMODITIES, as has contributed over 30 articles to that magazine over the years. His cover interview in the June 2020 edition of that magazine can be read here.
Most recently, Jay served for six years as the Director of Research at Alpha Investment Management, Inc. Professionally, he began his career as a programmer at Essex Trading Co., co-developing trading software that was voted “Best Option Trading System” six consecutive years in STOCKS & COMMODITIES. There he later became Head Trader as a CTA, managing futures accounts for eight years. He later became a Trading Strategist and Course Instructor for Optionetics for nine years, writing a weekly column called “Kaeppel’s Corner.”
Jay can be reached at [email protected].

Dean Christians is a 25-year Wall Street trading and market research veteran, including 20+ years of experience working for a large-cap growth manager with peak assets of $35 billion.
In his most recent role, he served as the Manager of Trading at Montag & Caldwell, where he translated his advanced knowledge of electronic trading to define the best approach for client portfolios, provided input regarding specific stocks, and mitigated potential risks.
A self-confessed market junky, Dean has extensive experience as a coder, indicator, and system designer that has independently coded hundreds of custom models including the one-of-a-kind Tactical Composite Trend Model (TCTM), which will become a core part of our market environment outlook. You may have seen some of his work under the Twitter handle Turning Point Macro Research (https://twitter.com/tpmacroresearch).
Dean can be reached at [email protected].
Research from both Jay and Dean will be a mix of premium and basic content.
Eric, Lisa, and I are excited for Jay and Dean to join the team, and we're looking forward to making the service better for you in every way we can. Here's to 2021!