
Where to look for opportunities in the fourth quarter

Key points:
- The stock market is in the most favorable portion of the 4-year election cycle
- The fourth quarter of the year often sees specific sectors, indexes, and markets consistently rally
- Among the most consistent gainers are Biotech, Health Care, and Materials
What the charts below mean - and don't mean
The most appropriate adage regarding seasonality is, "Seasonality is climate, not weather."
A seasonal chart or trend does not tell you what a given asset is going to do. It only tells you what that asset has done in the past during a given time period. Some traders assign this information more weight than others.
The best use I have found for seasonal trends is in helping to highlight potential opportunities. Once an opportunity is spotted, it is up to the individual to decide whether to trade it, how to trade it, how much to risk, when to exit, etc.
The table below lists ten assets entering a favorable seasonal period and seven entering - or in the middle of - an unfavorable period. There is no guarantee that the assets listed on the left-hand side of the table will rise in price from here, nor that the assets listed on the right-hand side will decline in price. Likewise, there is no guarantee that other assets not listed won't outperform those listed in the table. But history suggests focusing more on the assets on the left-hand side of the table and de-emphasizing those on the right.
With these caveats firmly in mind, if you are looking for trading opportunities, take a closer look at the assets highlighted below.
Seasonal trends broadly favor Biotech, Health Care, and Staples - not metals or Retailing
The assets listed on the left-hand side of the table below have shown a historical tendency to advance during the fourth quarter. The assets listed on the right-hand side have tended to lag.
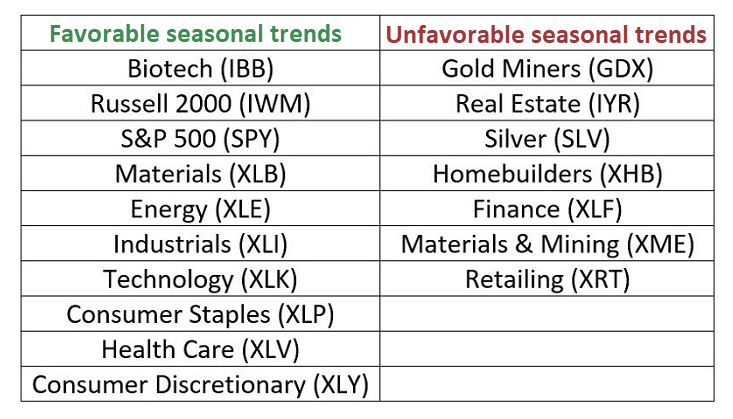
Some traders might consider the assets in the right-hand column as potential plays from the short side. There is nothing wrong with that. However, for the record, they are presented here as assets to avoid on the long side relative to those listed on the left-hand side of the table and not as short candidates.
The seasonally favorable sectors
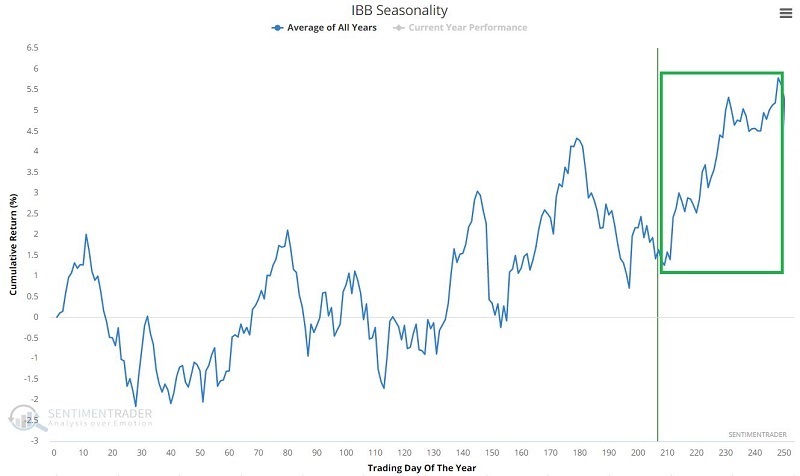
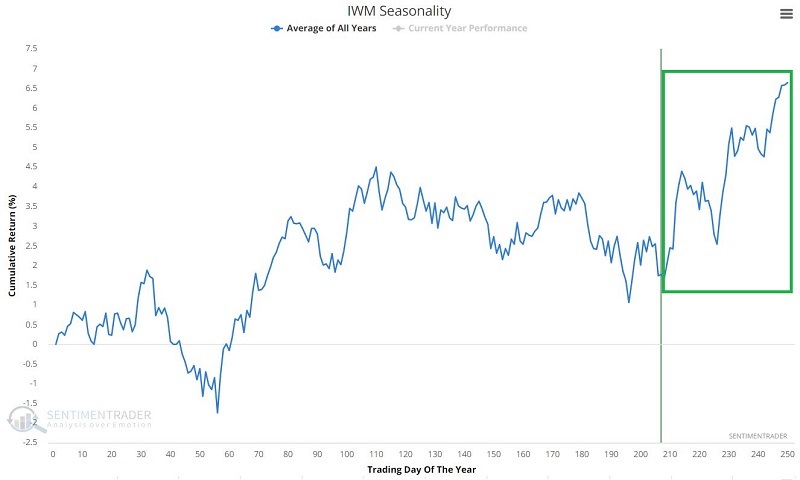
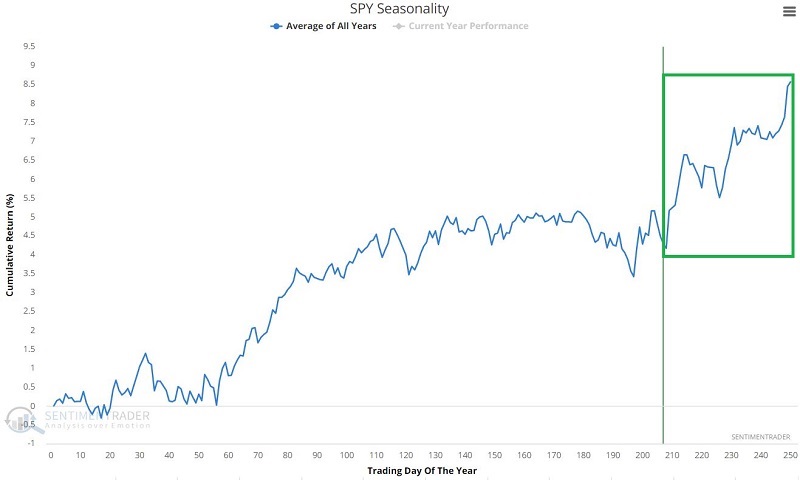
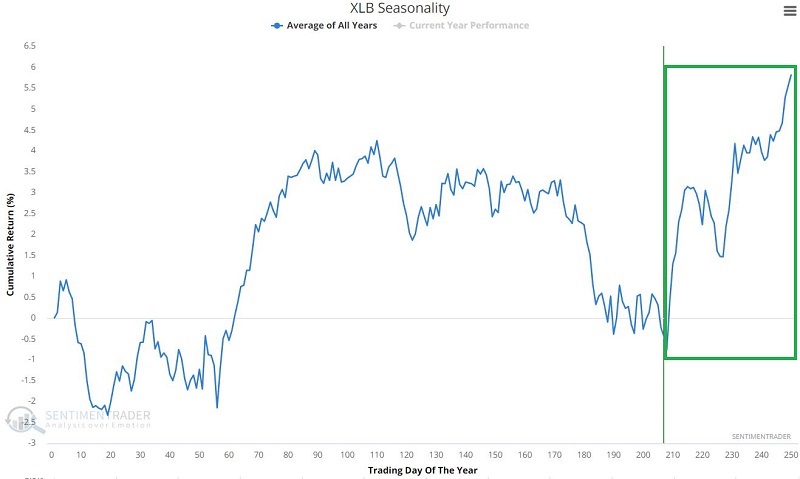
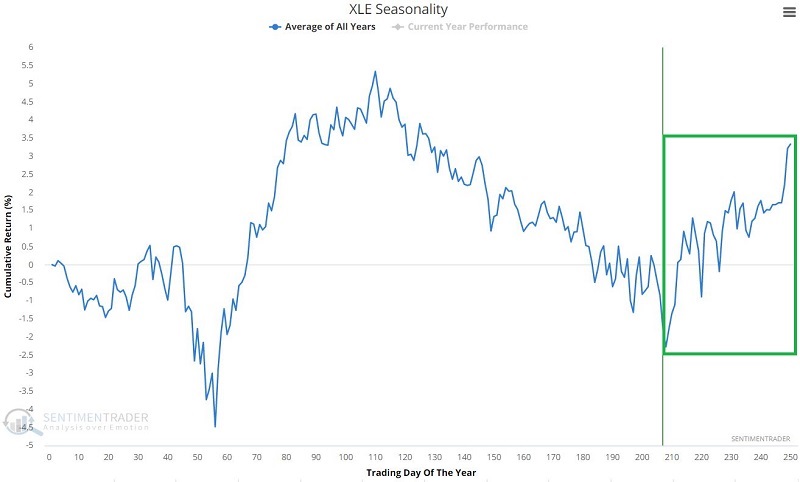
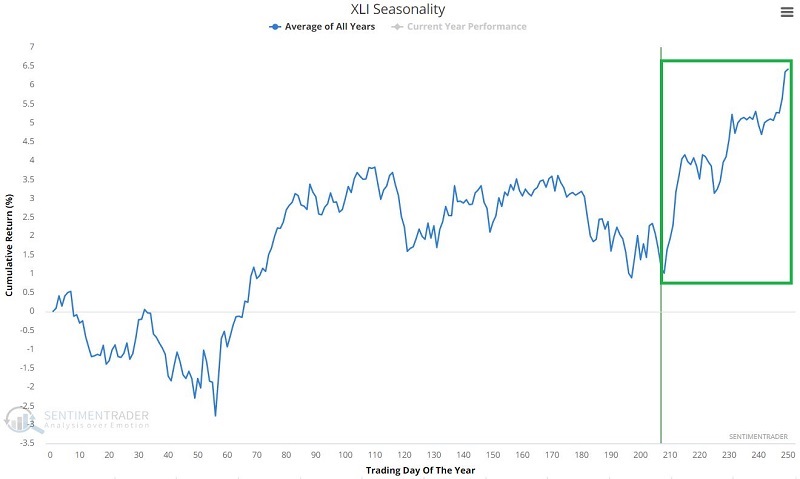
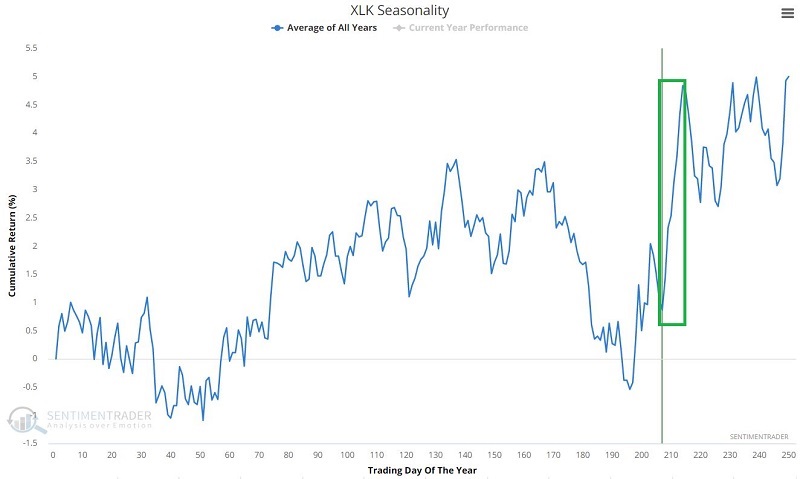
The charts below display the annual seasonal trend for the assets listed on the left-hand side of the table above.
Biotech
Small-Caps (Russell 2000) (see also here and here)
S&P 500 Index (see also here and here)
Materials
Energy
Industrials
Technology (see also here and here)
Consumer Staples (see also here)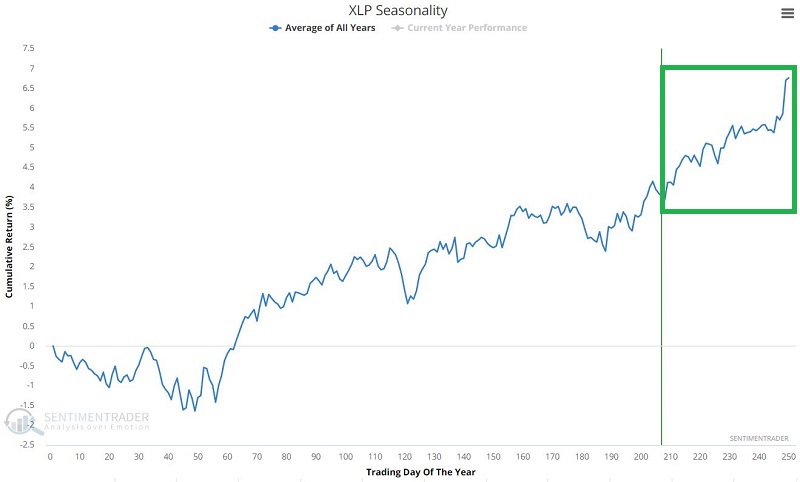
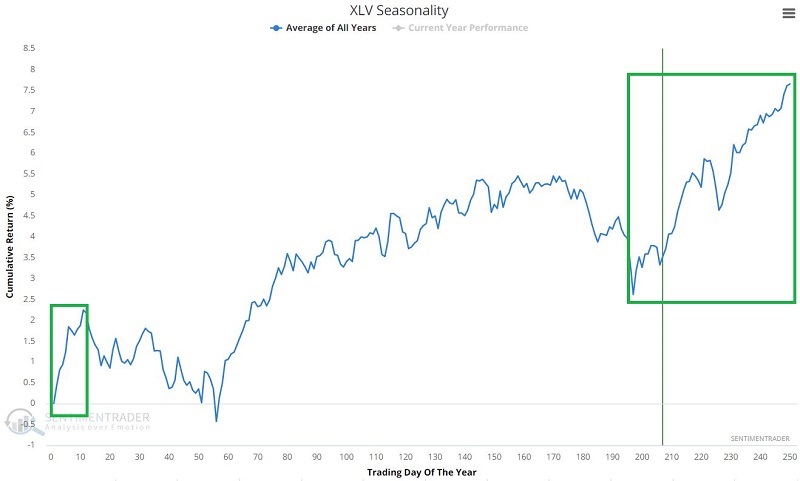
Health Care
Consumer Discretionary
The seasonally unfavorable sectors
The charts below display the annual seasonal trend for the assets listed on the right-hand side of the table above.
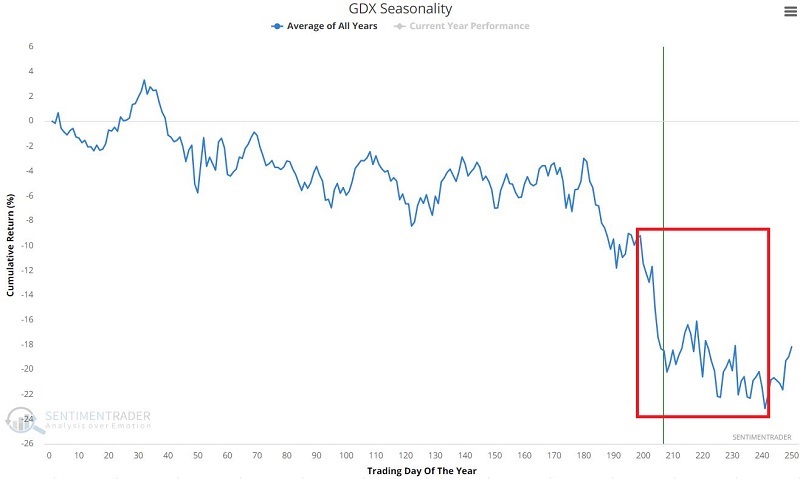
Gold Miners (see also here)
Real Estate (see also here)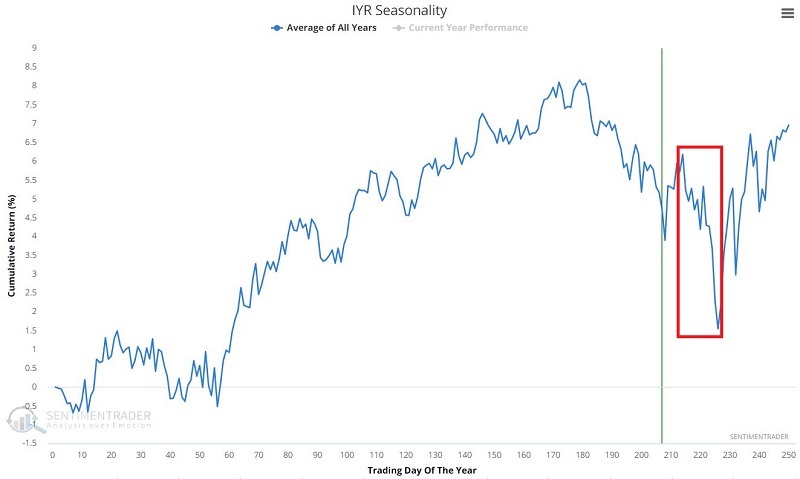
Silver (see also here and here)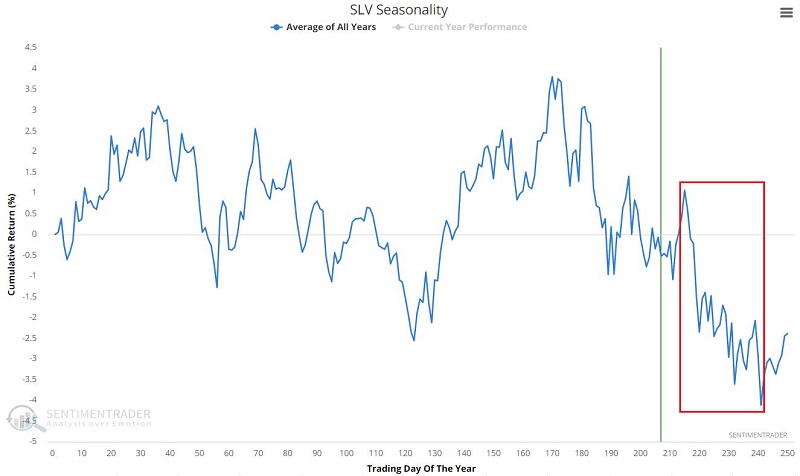
Homebuilders (see also here)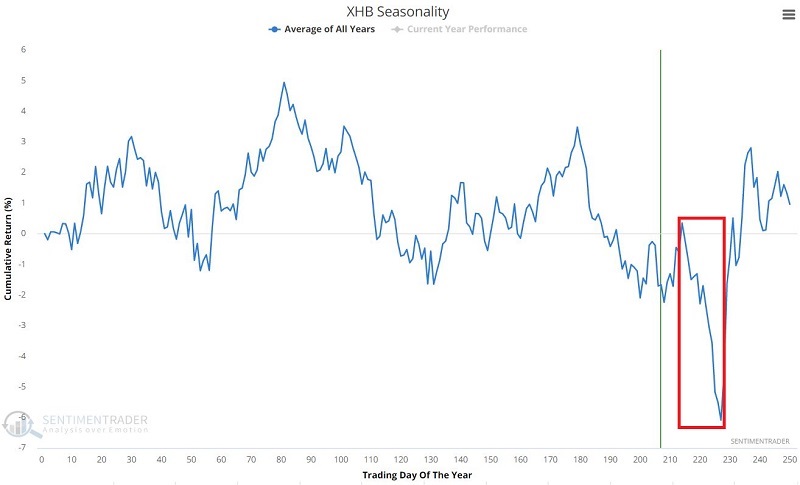
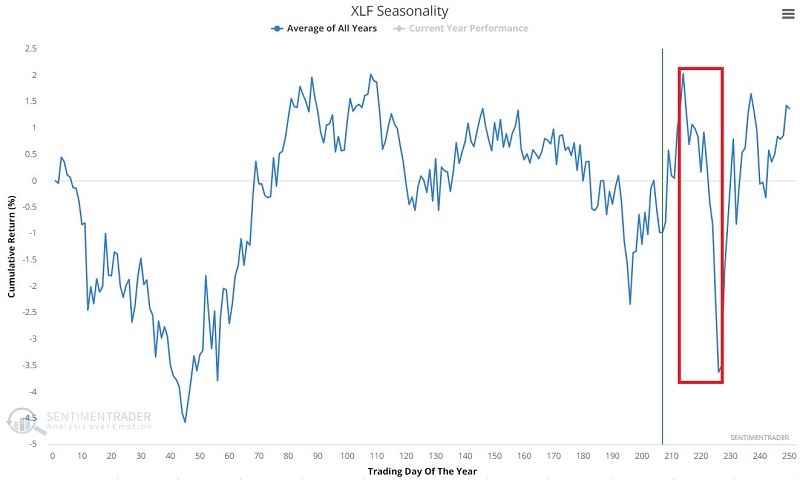
Finance
Materials & Mining (see also here)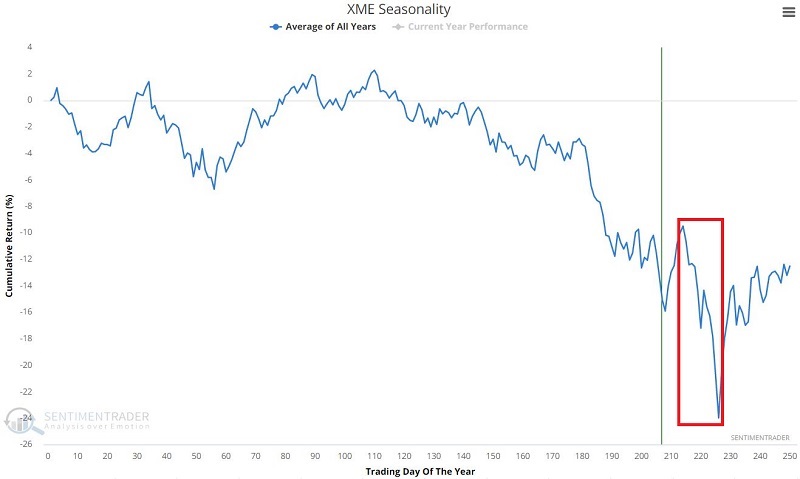
Retailing

What the research tells us…
The information above represents a starting point, not trading signals. Seasonality is an indicator like moving averages, MACD, stochastics, and the rest of them. Like any indicator, sometimes it can be uncannily accurate and sometimes just 100% wrong. There is nothing magic about a given time of year. A seasonal trend can highlight an asset with a better-than-average probability of advancing (or declining) during a given time period. From there, it is up to you to supply everything else.