Products
SentimenTrader Trading Tools
‍
Backtest Engine
My Trading Toolkit
Correlation Analysis
Seasonality
Market Prediction
Indicators & Data API
‍
Proprietary Indicators & Charts
Market Data API
Strategies & Scanner
‍
50+ Trading Strategies
Smart Stock Scanner
Smart Option Scanner
Research Reports
‍
Research Solutions
Reports Library
Free Resources
Simple Backtest Calculator
Simple Seasonality Calculator
The Kelly Criterion Calculator
Sentiment Geo Map
Public Research Reports
Education
Sentiment Indicators
Technical Indicators
Pricing
Company
About
In the News
Testimonials
Client Success Stories
Contact
Log inLoginSign up
< BACK TO ALL REPORTS

Where S&P 500 seasonality stands now

Jay Kaeppel
2025-03-17
The stock market is in a funk, but seasonality suggests the potential for better days ahead. Does it matter? We explore the history herein.

Key Points

  • The S&P 500 is entering one of its most reliably favorable periods of the year
  • Unfortunately, this does not guarantee a positive outcome in 2025; Seasonality is only one of many factors that influence stocks (I follow valuation, price action, inflation, interest rates, economy, sentiment, breadth, seasonality, and corporate insiders) and arguably one of the least influential
  • Still, seasonality primarily tells us "When to look where" - as a result, if the market is going to stabilize, then the period directly ahead is a logical time for that to happen

Late winter into spring

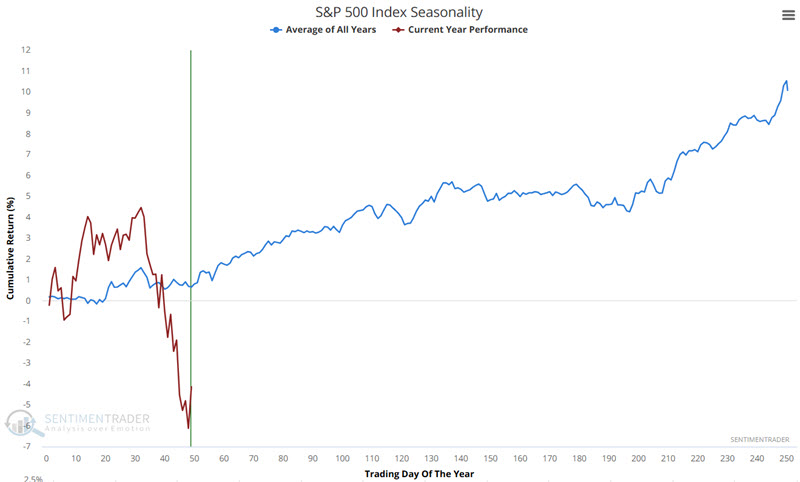
The chart below shows the annual seasonal trend, with price action for the S&P 500 so far this year overlaid. Remember that the seasonal chart is more about direction than price magnitude. In the broadest sense, stocks have followed their seasonal tendencies so far-i.e., strength through Trading Day of Year (TDY) #32 and weakness into TDY #49.
The chart below shows the annual seasonal trend for the S&P 500. It shows an upward bias from late March into the middle of the year. More specifically - and as highlighted in the green box - the period from Trading Day #49 through TDY #75 tends to show strength. For 2025, this period extends from the close on 2025-03-14 through 2025-04-22.
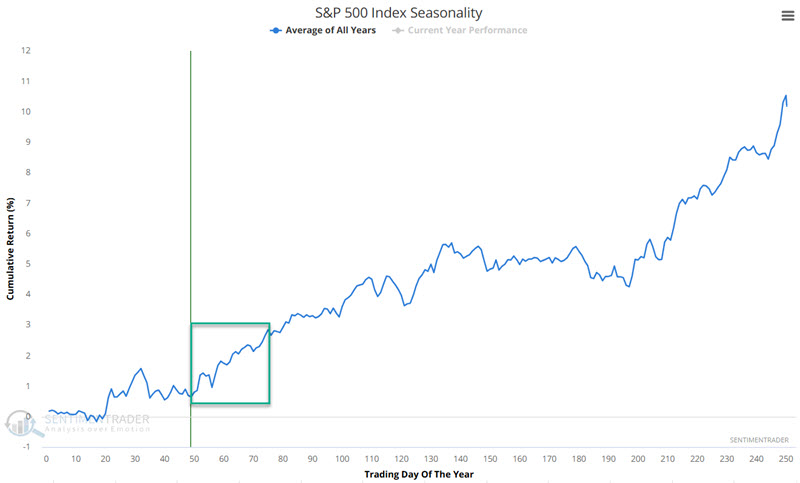
As always, it is essential to remember that seasonality is backward-looking - i.e., it is simply an average of the past - and should never be considered a roadmap for what will happen in the current year. Still, history is what it is for the S&P 500.

The chart below displays the hypothetical growth of $1 invested in SPX only from TDY #49 through TDY #75 every year since 1953.
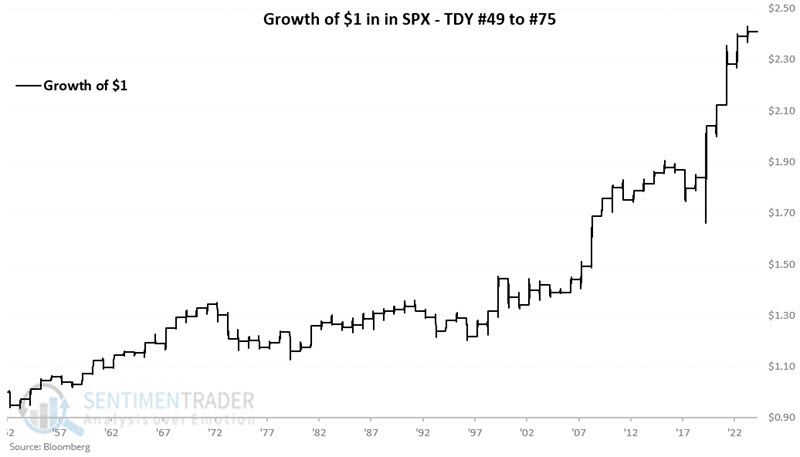
The chart below displays the same information on a logarithmic scale.
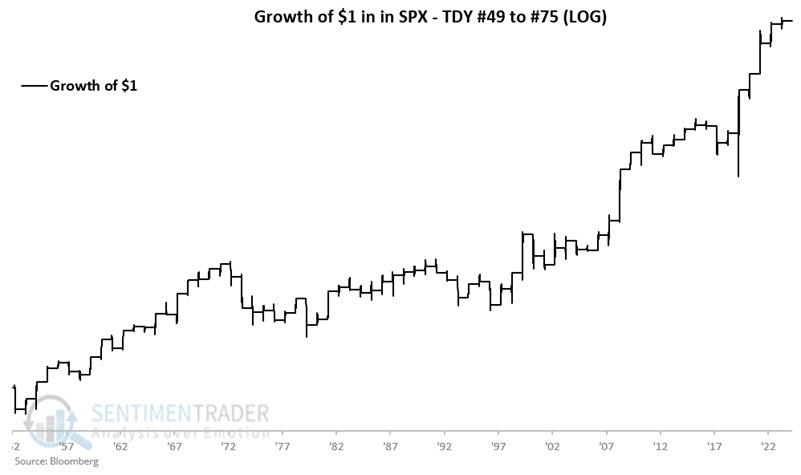
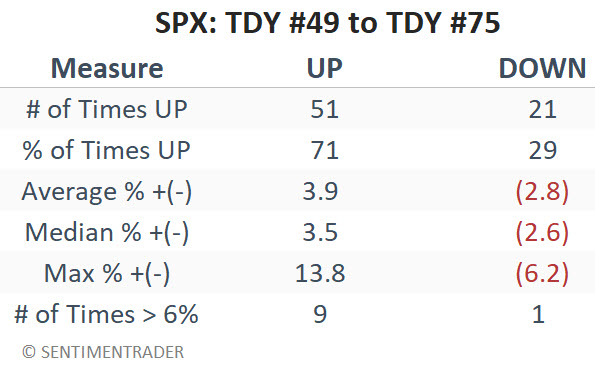
The table below summarizes S&P 500 performance during the TDY #49 to #75 period.
What the research tells us…

A 71% Win Rate is good but reminds us that a late spring stock market rally is no sure thing. With the majority of major stock market indexes below their respective 200-day moving average and with uncertainty (primarily around the ultimate effect of tariffs) still overhanging the market, the fact that "seasonality is favorable" should not be confused with a "buy signal." More than anything, the current round of favorable seasonality is a reminder not to let ourselves be overwhelmed by the cacophony of gloom and doom presently surrounding the market - and to be open to the possibility of bullish opportunities arising while the crowd looks the other way.

PRODUCTS
SentimenTrader
Trading Tools
Indicators & Data API
‍
Strategies & Scanner
‍
Research Reports
FREE
RESOUrCES
Simple Backtest
Calculator
Simple Seasonality
Calculator
The Kelly Criterion
Calculator
Sentiment Geo Map
‍
Public Research Reports
‍
Education
Sentiment Indicators
‍
Technical Indicators
‍
Pricing
Bundle pricing
‍
FAQ
‍
Announcements
‍
COMPANY
‍
About
‍
In the News
‍
Testimonials
‍
Client Success Stories
CONTACT
‍
General Inquiries
‍
Media Inquiries
‍
Financial Professionals Inquiries
‍
© 2026 Sundial Capital Research Inc. All rights reserved.
Setsail Marketing
TermsPrivacyAffiliate Program
Risk Disclosure: The information and tools provided are for research and analytical purposes only and are not intended as investment advice. Market analysis involves uncertainty, and outcomes may differ from expectations. Users should conduct their own due diligence and consider their individual circumstances before making any financial decisions. Past performance is not necessarily indicative of future results.

Hypothetical Performance Disclosure: Hypothetical performance results have many inherent limitations, some of which are described below. No representation is being made that any account will or is likely to achieve profits or losses similar to those shown; in fact, there are frequently sharp differences between hypothetical performance results and the actual results subsequently achieved by any particular trading program. One of the limitations of hypothetical performance results is that they are generally prepared with the benefit of hindsight. In addition, hypothetical trading does not involve financial risk, and no hypothetical trading record can completely account for the impact of financial risk of actual trading. for example, the ability to withstand losses or to adhere to a particular trading program in spite of trading losses are material points which can also adversely affect actual trading results. There are numerous other factors related to the markets in general or to the implementation of any specific trading program which cannot be fully accounted for in the preparation of hypothetical performance results and all which can adversely affect trading results.

Testimonial Disclosure: Testimonials appearing on this website may not be representative of other clients or customers and is not a guarantee of future performance or success.