Data &
Technology
Research
Reports
Report Solutions
Reports Library
Actionable
Strategies
Free
Resources
Simple Backtest Calculator
Simple Seasonality Calculator
The Kelly Criterion Calculator
Sentiment Geo Map
Public Research Reports
Free Webinar
Pricing
Company
About
Meet Our Team
In the News
Testimonials
Client Success Stories
Contact
Log inLoginSign up
< BACK TO ALL REPORTS

Where Are We in the Typical Sentiment Cycle?

Jason Goepfert
2021-06-03
Based on correlations to various parts of a Typical Sentiment Cycle, investors are now in the Enthusiasm phase, and have been for months.

For more than six months, investors have had shown at least Returning Confidence and even Enthusiasm. That's according to the latest correlations to a Typical Sentiment Cycle.

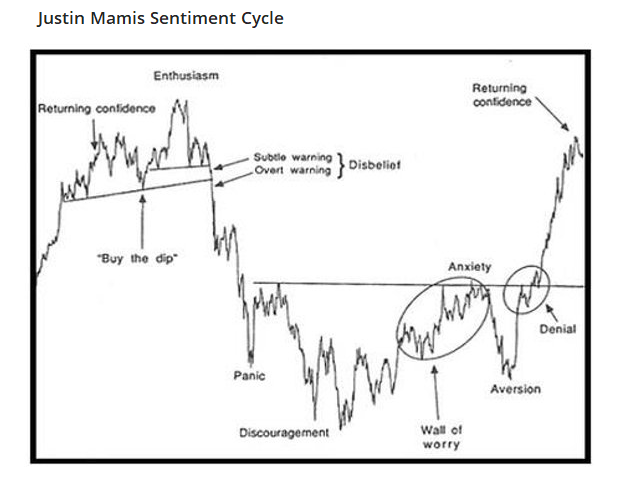
The idea of a repeatable pattern of investor behavior is questionable because the environment and inputs are always different. Human behavior is relatively constant, though, so many use some version of the Cycle popularized by Justin Mamis in his 1999 book, The Nature of Risk.

Justin Mamis typical sentiment cycle

If we go back to 1928 and compare all periods that are similar to that 1990-1991 period, we can see the correlation we have to each part of the Cycle. When we do that, we get the following estimates for where we are in the Cycle:

  1. Enthusiasm: +0.93
  2. Returning Confidence: +0.77
  3. Discouragement: -0.69
  4. Panic: -0.80

The correlations range from -1.0 (perfect opposite) to +1.0 (perfect symmetry). Based on that, there is a strong probability that we're in the Enthusiasm phase. Last September, the correlations suggested we were moving into the Returning Confidence phase, a good sign. It stayed there for a while, then moved into Enthusiasm near the end of last year.

Correlation to typical sentiment cycle

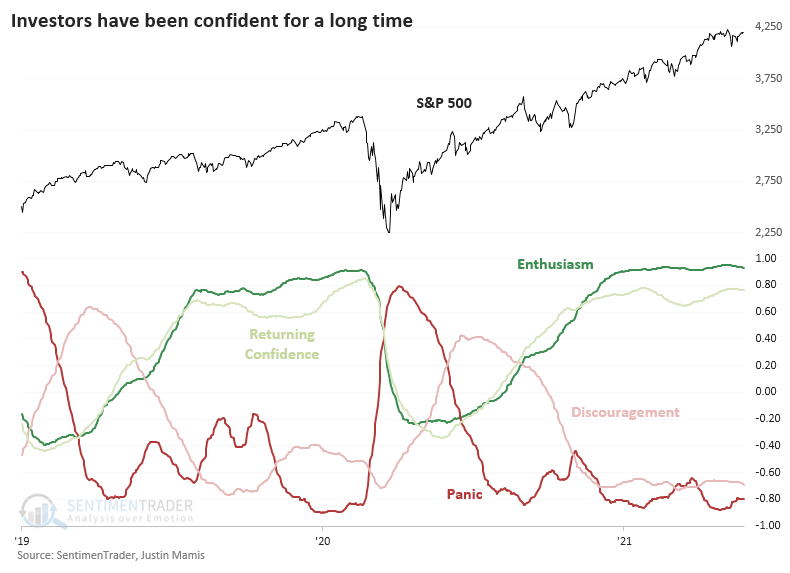
So, it has been more than six months, 140 days to be exact, that the price pattern of the S&P 500 has had at least a +0.60 correlation to both Returning Confidence and Enthusiasm, while also showing at least a -0.40 correlation to Discouragement and Panic.

That has moved us into the top 15 stretches of time with this kind of confidence among investors.

Stat Box

Nearly 93% of stocks in the S&P BSE Sensex Index of Indian stocks have climbed above their 50-day moving averages. When the index has seen similar internal thrusts, it rallied over the next 3 months after 19 out of 22 signals.


What else we're looking at

  • Full returns after investors showed at least Returning Confidence and not Discouragement for 140 days
  • A worrisome - and little known - sign of inflation, and what it means for the Dow Industrials
  • Indian stocks are showing a medium-term internal thrust
DATA &
TECHnologies
IndicatorEdge
‍
BackTestEdge
‍
Other Tools
‍
DataEdge API
RESEARCH
reports
Research Solution
‍
Reports Library
‍
actionable
Strategies
Trading Strategies
‍
Smart Stock Scanner
‍
FREE
RESOUrCES
Simple Backtest
Calculator
Simple Seasonality
Calculator
The Kelly Criterion
Calculator
Sentiment Geo Map
‍
Public Research Reports
‍
Free Webinar
COMPANY
‍
About
‍
Meet our Team
‍
In the News
‍
Testimonials
‍
Client Success Stories
Pricing
Bundle pricing
‍
Announcements
‍
FAQ
© 2024 Sundial Capital Research Inc. All rights reserved.
Setsail Marketing
TermsPrivacyAffiliate Program
Risk Disclosure: Futures and forex trading contains substantial risk and is not for every investor. An investor could potentially lose all or more than the initial investment. Risk capital is money that can be lost without jeopardizing ones’ financial security or life style. Only risk capital should be used for trading and only those with sufficient risk capital should consider trading. Past performance is not necessarily indicative of future results.

Hypothetical Performance Disclosure: Hypothetical performance results have many inherent limitations, some of which are described below. No representation is being made that any account will or is likely to achieve profits or losses similar to those shown; in fact, there are frequently sharp differences between hypothetical performance results and the actual results subsequently achieved by any particular trading program. One of the limitations of hypothetical performance results is that they are generally prepared with the benefit of hindsight. In addition, hypothetical trading does not involve financial risk, and no hypothetical trading record can completely account for the impact of financial risk of actual trading. for example, the ability to withstand losses or to adhere to a particular trading program in spite of trading losses are material points which can also adversely affect actual trading results. There are numerous other factors related to the markets in general or to the implementation of any specific trading program which cannot be fully accounted for in the preparation of hypothetical performance results and all which can adversely affect trading results.

Testimonial Disclosure: Testimonials appearing on this website may not be representative of other clients or customers and is not a guarantee of future performance or success.