
When to worry (or not) about a recession

Key Points
- A lot of people seem to want to be the first to forecast the next economic recession
- There are some valid reasons for concern (high inflation, rising rates and energy prices, some yield curve inversion)
- Unfortunately, countless indicators and pundits have called roughly 9 of the last five recessions
- Certain indicators do a better job than others in accurately gauging the prospects for the economy and stock market
- The unemployment rate and housing starts are excellent tools for assessing the prospects for the economy - and by extension, the stock market - particular when considered together
How indicators are calculated and updated
The data I use is updated once a month and can be found here and here. Data for the previous month is reported sometime during the current month. I only update the indicators at the end of the month and then apply the results to the following month.
For example, March 2022 housing starts were reported on 4/20. Because housing starts are in an uptrend (defined below), this indicator will be deemed "favorable" for stocks and the economy for May at the end of April.
Unemployment Rate
For this data series, lower is better, indicating that more people are working. To assess a "favorable" or "unfavorable" rating, I use a 12-month exponential moving average, as shown in the chart below.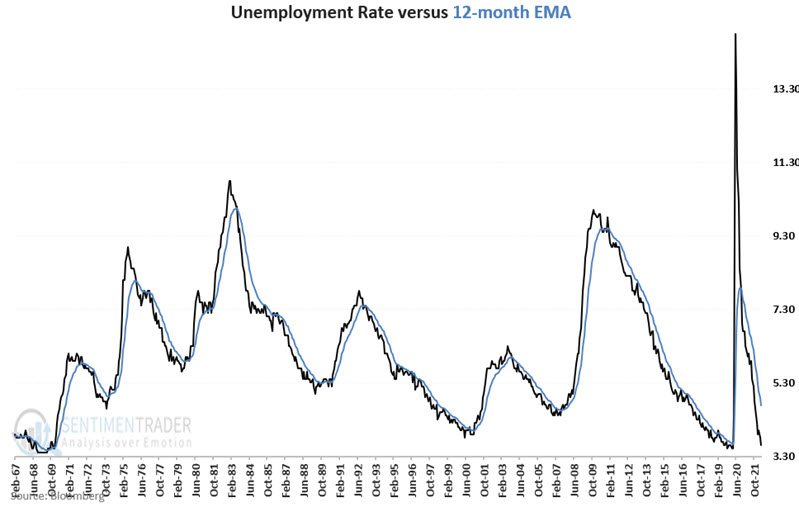
The short version:
- Black line BELOW blue line = GOOD
- Black line ABOVE blue line = BAD
The slightly longer version:
Suppose that during a given calendar month, the reported unemployment rate (black line) is below the 12-month EMA (blue line). In that case, at the end of the month, the unemployment rate indicator is deemed "favorable" (i.e., unemployment is declining) for stocks and the economy during the following calendar month.
Conversely, suppose that during a given calendar month, the reported unemployment rate (black line) is above the 12-month EMA (blue line). In that case, at the end of the month, the unemployment rate indicator is deemed "unfavorable" (i.e., unemployment is rising) for stocks and the economy during the following calendar month.
Housing Starts
For this data series, higher is better. More people willing to commit to building a new home is generally a sign of a flourishing economy. To assess a "favorable" or "unfavorable" rating, I use an 18-month exponential moving average, as shown in the chart below.
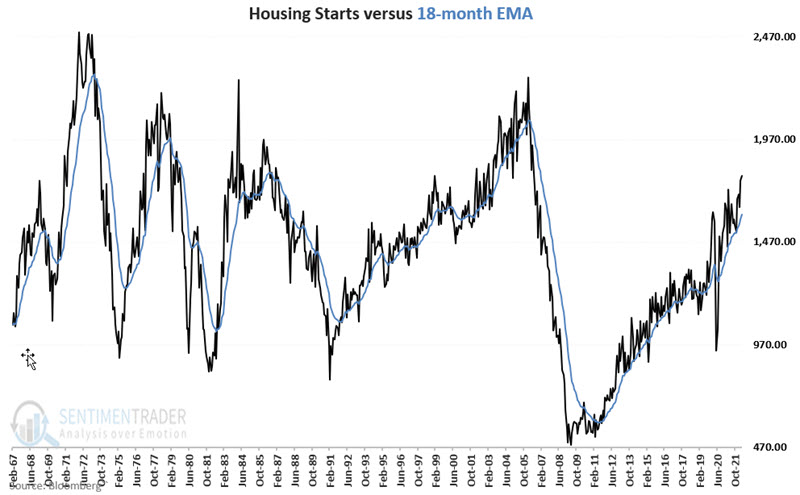
The short version:
- Black line ABOVE blue line = GOOD
- Black line BELOW blue line = BAD
The slightly longer version:
Suppose housing starts (black line) are above the 18-month EMA (blue line) at the end of the month. In that case, the housing starts indicator is deemed "favorable" (i.e., more new homes are being built) for stocks and the economy during the following calendar month.
If housing starts (black line) is below the 18-month EMA (blue line), then at the end of the month, the housing start indicator is deemed "unfavorable" for stocks and the economy during the following calendar month.
Combining the two indicators
At the end of each month, either 0, 1, or 2 indicators will be rated as "favorable." The chart below shows the month-end total since 1967.
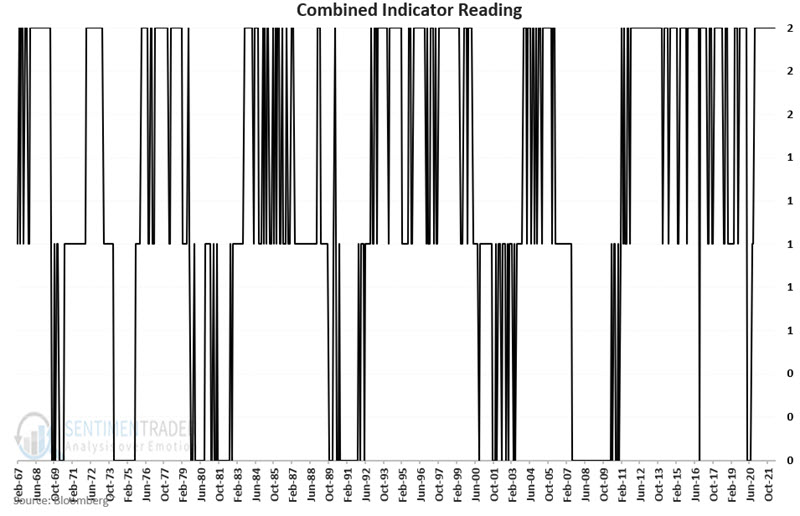
In theory, stocks and the economy should be expected to perform best when both indicators are favorable (a +2 combined reading) and worst when both indicators are unfavorable (a combined reading of 0). Let's look at how this theory has played out in reality.
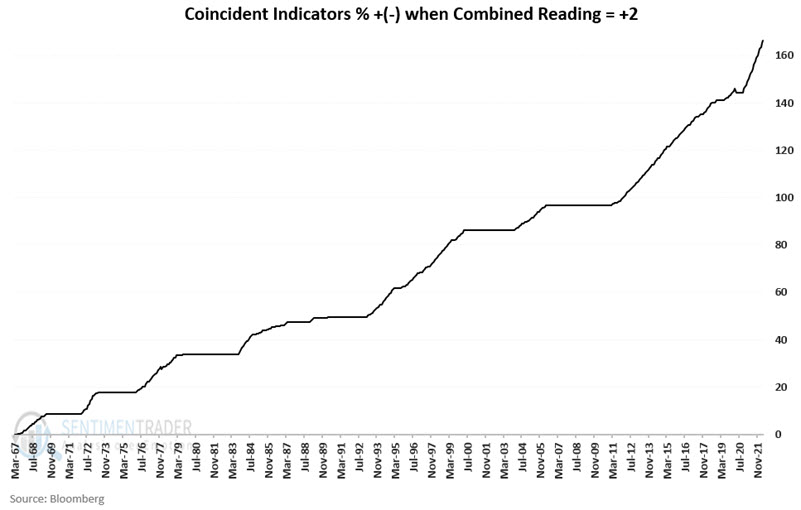
Economic results based on the combined reading
The chart below displays the cumulative % gain for the Coincident Economic Indicators only during months when the combined reading = +2. Note the steadily growing nature of economic performance when both indicators are favorable.
The chart below displays the cumulative % gain for the Coincident Economic Indicators only during months when the combined reading = 0. Note the volatile and overall negative nature of economic performance when both indicators are unfavorable.
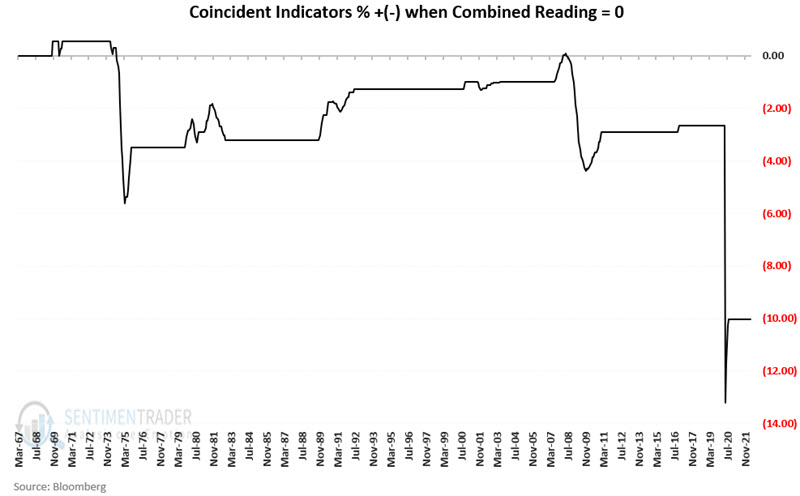
The bottom line:
- When both unemployment and housing starts are favorable, the risk of recession is relatively low - despite all the talk, hand-wringing, worry, and warnings to the contrary
- When both indicators are unfavorable, the risk of an economic contraction rises significantly
Stock market results based on the combined reading
While assessing the overall economy is interesting, the real question is, "can we make money?" So let's look at stock market performance during fully favorable and unfavorable periods as we just did for the economy. For the test below, we use the monthly closing price for the S&P 500 Index (not total return data).
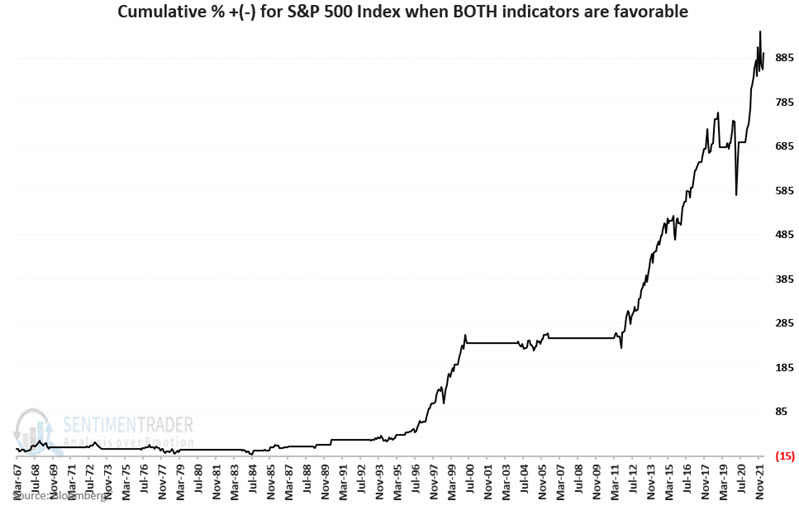
The chart below displays the cumulative % gain for the S&P 500 Index only during months when the combined reading = +2. The S&P 500 did not produce stellar returns during these periods in the 1970s and 1980s. However, except for the Covid-19 induced panic of 2020, there were no long-term downtrends to speak of.
The chart below displays the cumulative % gain for the S&P 500 Index Indicators only during months when the combined reading = 0. Note the volatile nature of stock market performance when both indicators are unfavorable.
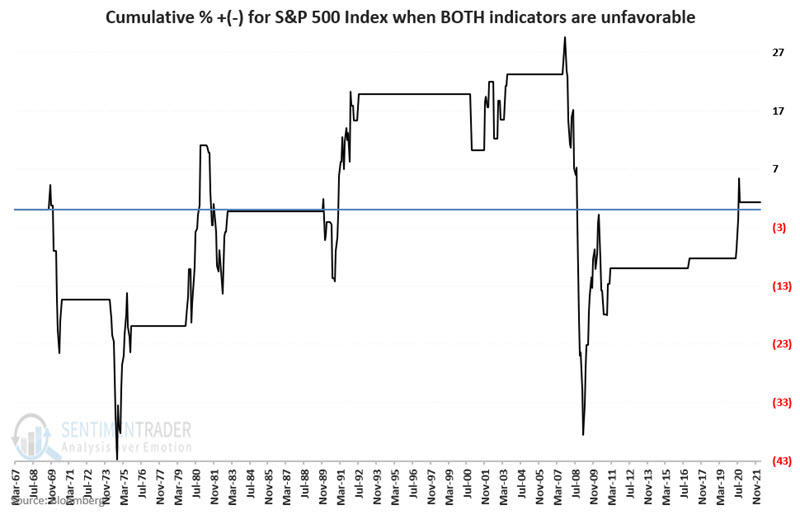
The cumulative price gain for the S&P 500 held during these periods was just +1.3%. This means that virtually all of the stock market gains since 1967 occurred when at least one of the two indicators detailed above was favorable.
The chart below displays the cumulative gain for the S&P 500 held during all months when at least one of the two economic indicators was bullish.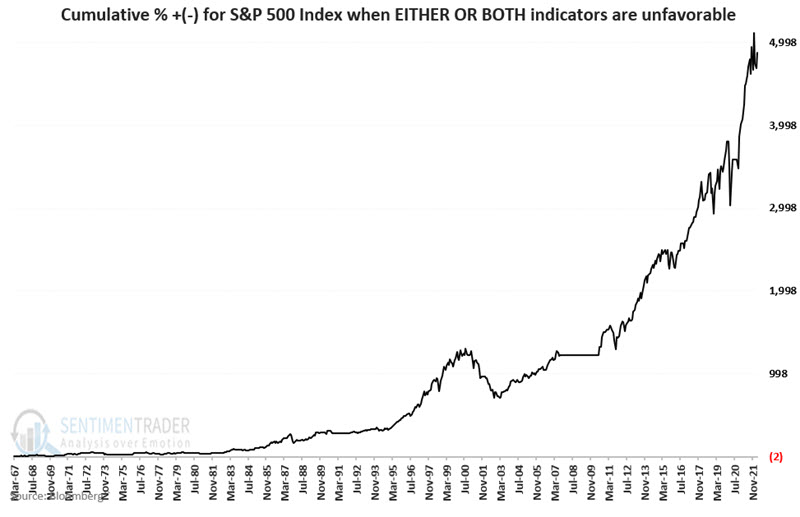
The cumulative price gain for the S&P 500 held during all months when at least one of the two economic indicators was favorable is +4,875%.
What the research tells us…
In the long run, the stock market moves based on perceptions of how the economy will perform in the months and years ahead. By keeping track of the unemployment rate and housing starts once a month, an investor can assess the outlook for stocks and the economy with a relatively high degree of confidence.
The combined indicator read 0 for May through August 2020, then +1 for September and October 2020. Since November 2020, the combined unemployment rate/housing starts indicator has stayed at +2 and will do so again in May 2022. Does this mean that a recession cannot begin tomorrow? Not at all. Anything can happen, as we saw in February and March of 2020. But history strongly suggests that investors avoid all the shouting and continue to focus on executing their investment plan.