Data &
Technology
Research
Reports
Report Solutions
Reports Library
Actionable
Strategies
Free
Resources
Simple Backtest Calculator
Simple Seasonality Calculator
The Kelly Criterion Calculator
Sentiment Geo Map
Public Research Reports
Free Webinar
Pricing
Company
About
Meet Our Team
In the News
Testimonials
Client Success Stories
Contact
Log inLoginSign up
< BACK TO ALL REPORTS

When to Take a Week Off(?)

Jay Kaeppel
2021-09-30
Finding an "edge" in the market is one thing. Figuring out how to use it to your advantage is another. In this piece, we highlight the month-by-month performance of a stock market anomaly that "hides in plain sight."

In this recent article, I wrote about a little-known seasonal anomaly that "hides in plain sight." In this piece, we focused solely on this anomaly during September.

Here we will look at historical results on a month-by-month basis.

THE DAYS

As a quick review:

  • The last trading day of the month is designated as TDM -1
  • The next to last trading day is TDM -2
  • The day before that is TM -3
  • Etc.

The test period:

  • Includes TDM -10 through TDM -5
  • On a month-by-month basis
  • From January 1931
  • Through December 2020

CUMULATIVE RESULTS MONTH-BY-MONTH

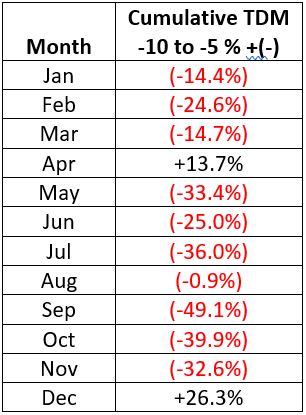
The table below displays the:

  • Cumulative % price change for the S&P 500
  • During this 6-trading day period
  • For each month individually
  • From 1931 through 2020

Things to Note (From 1931 through 2020):

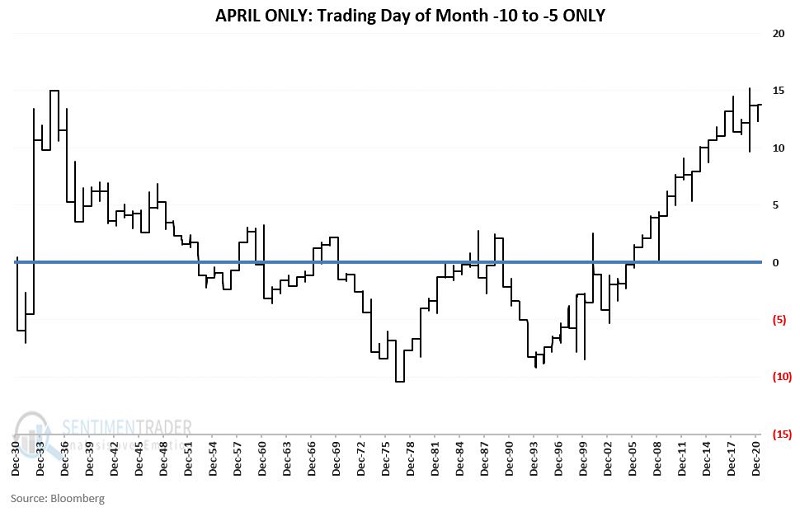
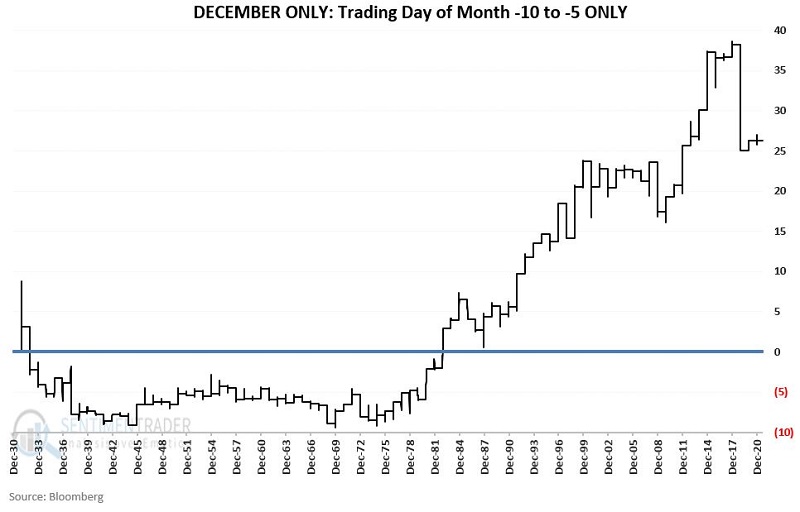
  • The only two months to show a gain are December and April
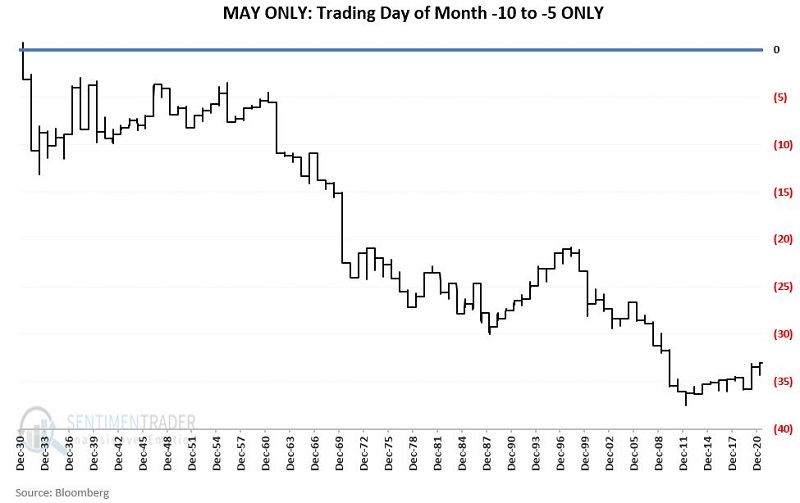
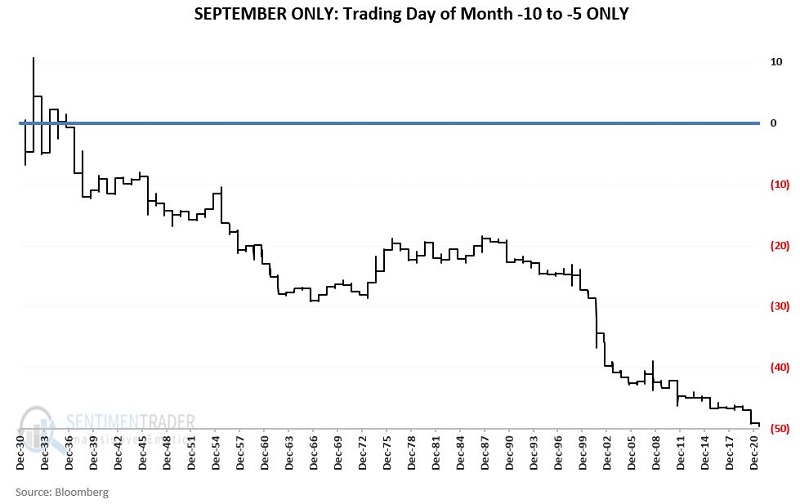
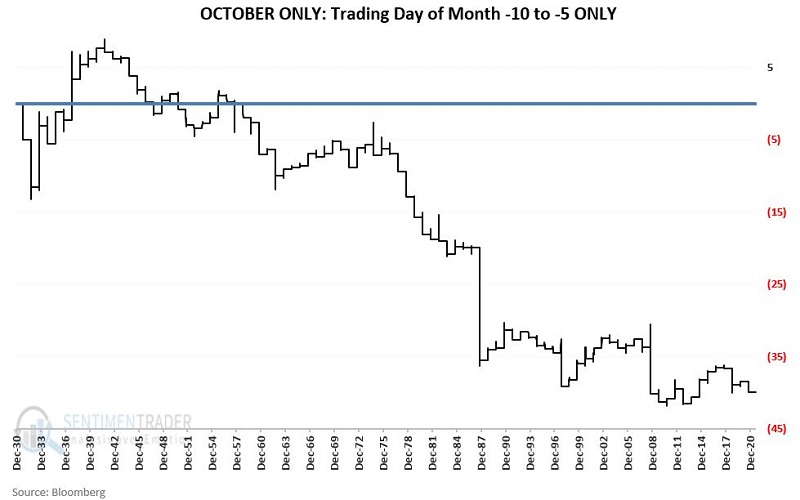
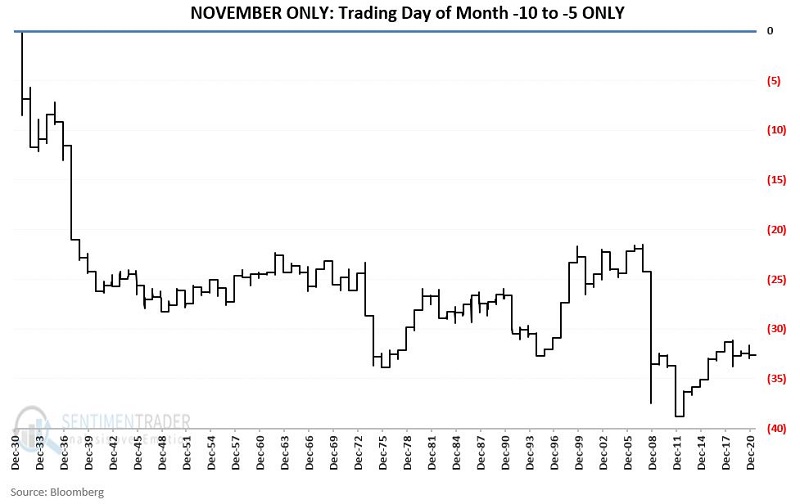
  • The weakest months overall have been September, October, July, May, and November

MONTH-BY-MONTH

The table below displays the performance of the TDM -10 through TDM -5 period on a month-by-month basis.

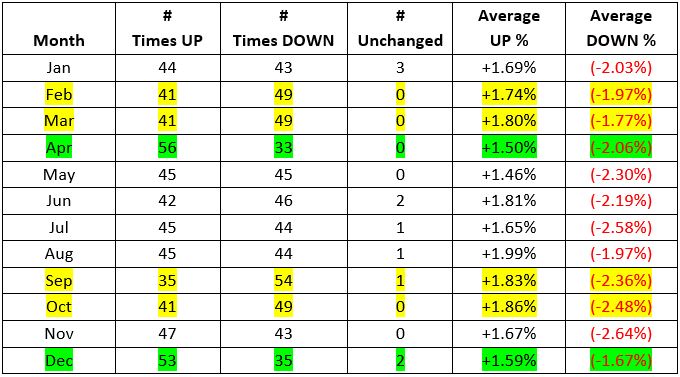
When we look at the frequency of UP months versus DOWN months, what we find is that:

  • The -10 to -5 edge is slight, even in the best and worst months
  • The "best" -10 to -5 months have been December and April 
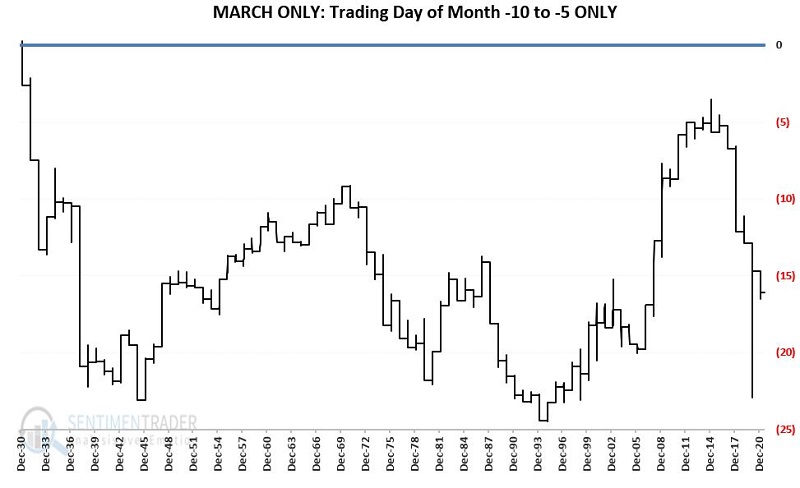
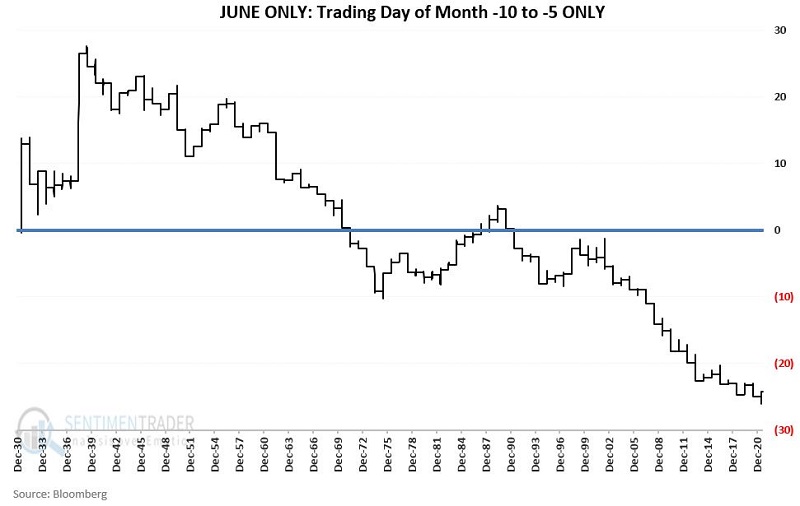
  • The "worst" -10 to -5 months were September, October, February, and March, and June

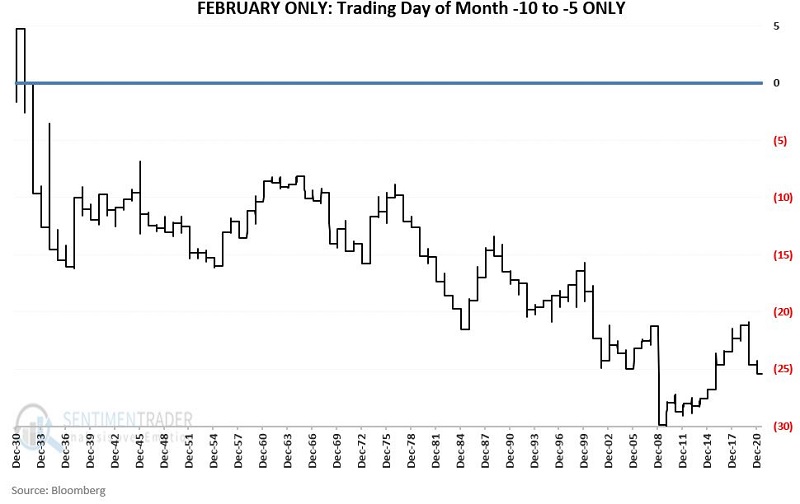
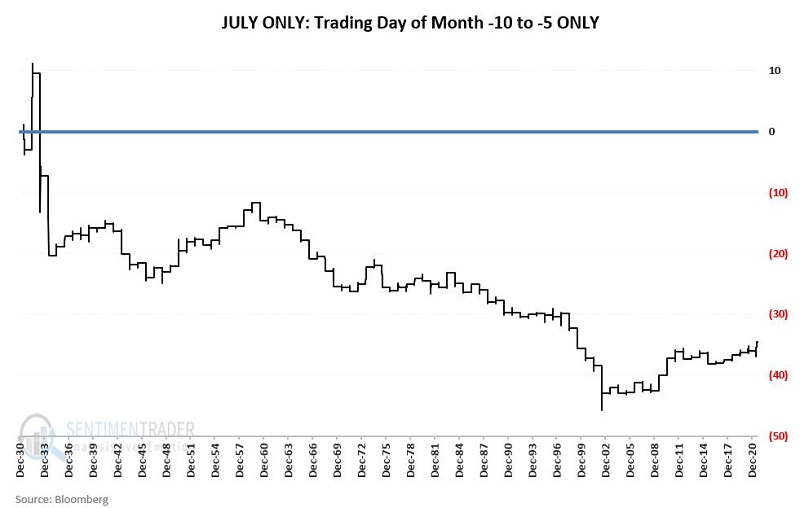
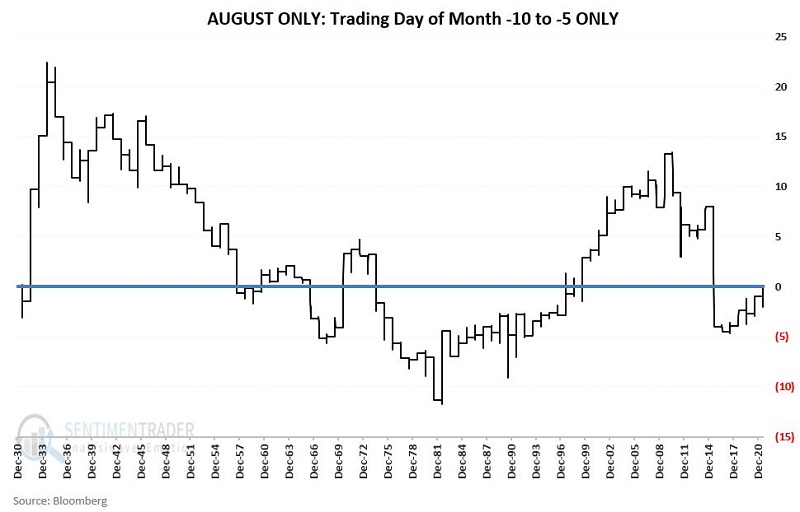
The following charts display the cumulative price return for our "seasonally weak" 6-trading day period on a month-by-month basis through the end of 2020.

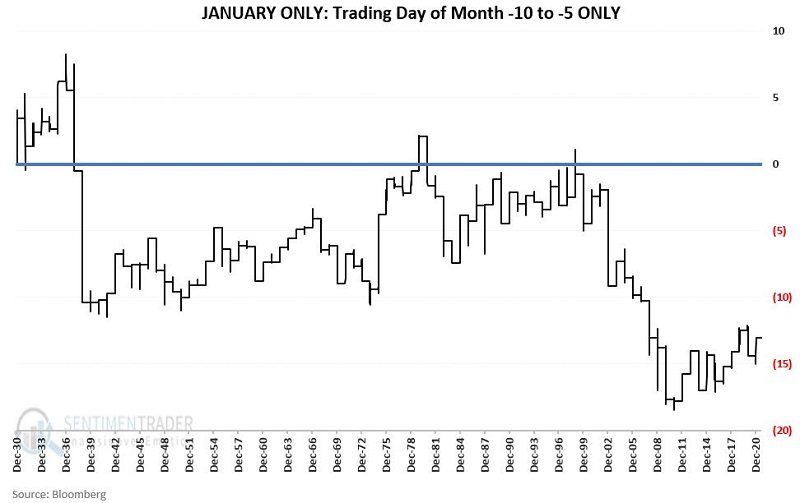
REAL-WORLD TRADING APPLICATIONS

There does not appear to be any real rhyme or reason to the gyrations of the individual charts above.  Nevertheless - except for April and December - there is an undeniable downside tendency for the stock market during the particular time of the month.

In terms of real-world trading:

  • It probably does not make sense for long-term investors to unload their entire portfolio and then repurchase it six trading days later each month.  Potential tax implications, slippage, commissions, and the sheer logistics of doing so can make this an unwieldy approach.
  • That said, if an investor is looking to put money to work in the market, it can make a great deal of sense to wait until TDM -5 to do so.
  • If an investor is looking to sell (whether a large or small part of their portfolio), selling before the close of TDM -10 would seem to be a good idea.  The same goes for investors looking to hedge their portfolio or individual holdings within their portfolio.
  • This anomaly can be a terrific "weight of the evidence" input for shorter-term traders. I.e., if the preponderance of the evidence is bearish heading into this period, a short position may look much more attractive and should be pursued aggressively.  

Sorry, you don't have access to this report

Upgrade your subscription plan to get access
Go to Dasboard
DATA &
TECHnologies
IndicatorEdge
‍
BackTestEdge
‍
Other Tools
‍
DataEdge API
RESEARCH
reports
Research Solution
‍
Reports Library
‍
actionable
Strategies
Trading Strategies
‍
Smart Stock Scanner
‍
FREE
RESOUrCES
Simple Backtest
Calculator
Simple Seasonality
Calculator
The Kelly Criterion
Calculator
Sentiment Geo Map
‍
Public Research Reports
‍
Free Webinar
COMPANY
‍
About
‍
Meet our Team
‍
In the News
‍
Testimonials
‍
Client Success Stories
Pricing
Bundle pricing
‍
Announcements
‍
FAQ
© 2024 Sundial Capital Research Inc. All rights reserved.
Setsail Marketing
TermsPrivacyAffiliate Program
Risk Disclosure: Futures and forex trading contains substantial risk and is not for every investor. An investor could potentially lose all or more than the initial investment. Risk capital is money that can be lost without jeopardizing ones’ financial security or life style. Only risk capital should be used for trading and only those with sufficient risk capital should consider trading. Past performance is not necessarily indicative of future results.

Hypothetical Performance Disclosure: Hypothetical performance results have many inherent limitations, some of which are described below. No representation is being made that any account will or is likely to achieve profits or losses similar to those shown; in fact, there are frequently sharp differences between hypothetical performance results and the actual results subsequently achieved by any particular trading program. One of the limitations of hypothetical performance results is that they are generally prepared with the benefit of hindsight. In addition, hypothetical trading does not involve financial risk, and no hypothetical trading record can completely account for the impact of financial risk of actual trading. for example, the ability to withstand losses or to adhere to a particular trading program in spite of trading losses are material points which can also adversely affect actual trading results. There are numerous other factors related to the markets in general or to the implementation of any specific trading program which cannot be fully accounted for in the preparation of hypothetical performance results and all which can adversely affect trading results.

Testimonial Disclosure: Testimonials appearing on this website may not be representative of other clients or customers and is not a guarantee of future performance or success.